Analysis of the Type IIn Supernova 1998S: Effects of Circumstellar Interaction on Observed Spectra
Abstract
We present spectral analysis of early observations of the Type IIn supernova 1998S using the general non-local thermodynamic equilibrium atmosphere code PHOENIX. We model both the underlying supernova spectrum and the overlying circumstellar interaction region and produce spectra in good agreement with observations. The early spectra are well fit by lines produced primarily in the circumstellar region itself, and later spectra are due primarily to the supernova ejecta. Intermediate spectra are affected by both regions. A mass-loss rate of order yr-1 is inferred for a wind speed of km s-1. We discuss how future self-consistent models will better clarify the underlying progenitor structure.
1 Introduction
SN 1998S was discovered on Mar. 3 UT by Zhou Wan (Li et al. 1998) as part of the Beijing Astronomical Observatory (BAO) Supernova Survey (Qiao et al. 1997). The discovery was confirmed by the Katzman Automatic Imaging Telescope (KAIT) during the Lick Observatory Supernova Search (Treffers et al. 1997; Filippenko et al. 2000). SN 1998S is located in NGC 3877, a spiral galaxy classified as SA, with a heliocentric velocity of 902 km s-1 (Nilson 1973) and a Galactic extinction of mag (Burstein & Heiles 1982).
Filippenko & Moran (Li et al. 1998) obtained a high-resolution spectrum of SN 1998S on Mar. 4 with the Keck-1 telescope and classified SN 1998S as a Type II supernova (SN II) on the basis of broad H emission superposed on a featureless continuum. Further spectra were obtained at the Fred L. Whipple Observatory (FLWO) (Garnavich et al. 2000) and a campaign to monitor SN 1998S in the UV from the Hubble Space Telescope (HST) was mounted by the Supernova INtensive Study (SINS) team. Three epochs have been observed with HST — March 16, March 30, and May 13. SN 1998S is a Type IIn supernova (SN IIn; Schlegel 1990), a classification which shows wide variations in the spectra (Filippenko 1997), but includes narrow lines on top of an underlying broad-line supernova spectrum. This has been taken as strong evidence that the supernova ejecta were interacting with a slow-moving circumstellar wind (Leonard et al. 2000), probably in a fashion similar to (but possibly more extreme than) that of SN 1979C and SN 1980K (Lentz et al. 1999; Liu et al. 2000).
In order to get an initial understanding and to confirm the basic picture of SNe IIn as strong circumstellar interacters, a set of parameterized models of SN 1998S was examined with the fully relativistic, NLTE, multi-purpose, expanding atmosphere code, PHOENIX, (cf. Hauschildt & Baron 1999, and references therein). PHOENIX solves the spherically symmetric radiation transport along with the NLTE rate equations and the condition of radiative equilibrium (including deviations due to time dependence of the deposition of non-thermal gamma rays).
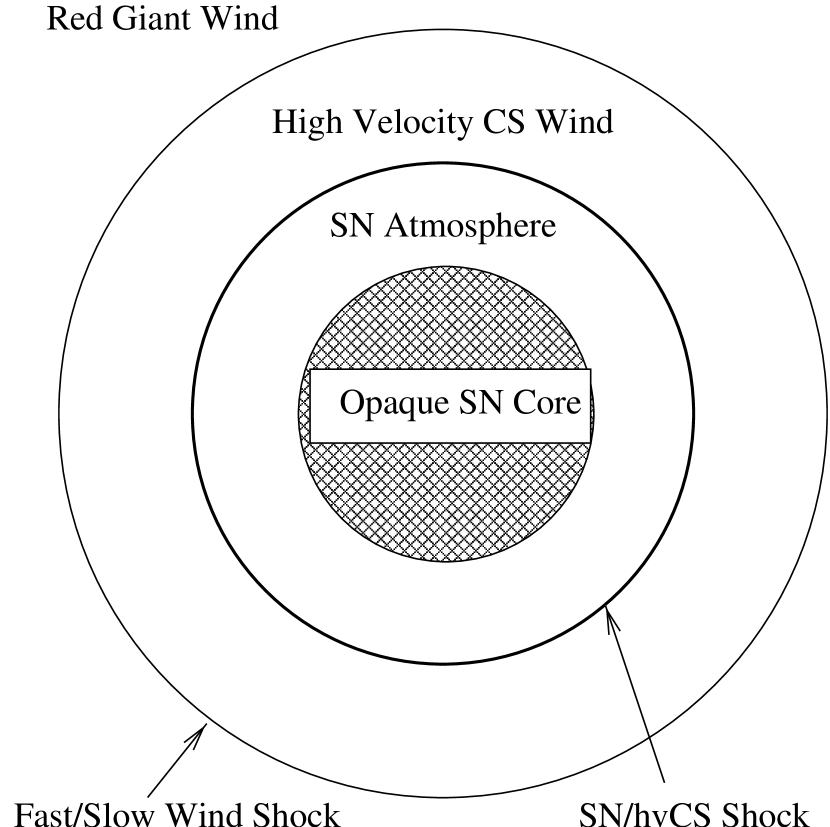
A modification of PHOENIX is underway in order to treat self-consistently both the underlying supernova spectrum and the overlying circumstellar interaction region; here we treat the two regions separately. Figure 1 shows a schematic representation of SN 1998S. Some of the important coupling between the two regions is not included in the calculations and therefore not all of the features observed can be expected to be reproduced by the synthetic spectra. However, our models serve to confirm the basic picture of a SN IIn as a Type II supernova that interacts strongly with a near-constant velocity wind. We are able to identify important physical effects that need to be included in future simulations.
While our models are spherically symmetric, Leonard et al. (2000) have shown that the spectra of SN 1998S are significantly polarized, which could be due to asymmetry in the outermost SN ejecta, the circumstellar medium (CSM), or both. Gerardy et al. (2000) suggest that dust and CO are likely to have formed in the SN ejecta while Fassia et al. (2000) argue that the early dust is likely to come from the CSM.
2 Models
In this paper we focus on three epochs in particular: an early epoch on Mar 16, days after explosion, using combined HST and ground-based spectra, where effects from the circumstellar region dominate; Mar 30, days after explosion, again where there are combined HST and ground-based data, and where effects from both photospheric SN ejecta and the circumstellar region are important, and a later ground-based spectrum from April 17, days after explosion, where the densest circumstellar gas has been largely, but not completely, overrun by the supernova ejecta. In the earlier spectrum most of the observed lines are formed in the low-velocity circumstellar material, whereas in the later spectrum the lines show the characteristic width of a Type II supernova. A detailed analysis of the light curve and other observed spectra will be presented elsewhere (Garnavich et al. 2000); see also Leonard et al. (2000) and Fassia et al. (2000, 2001).
2.1 March 16
We have modeled the circumstellar region as a constant-velocity wind with a density profile . While the underlying radiation below the circumstellar region is in fact due to the supernova itself and should show broad P-Cygni profiles as well as a UV deficit due to line blanketing in the differentially expanding supernova atmosphere, we ignore these complications for the present discussion and assume that the underlying radiation is given by a Planck function, with K. In future work we will treat the effects of the circumstellar interaction region on the supernova itself, and couple the proper supernova boundary condition into the circumstellar region. Nevertheless, our present decoupled prescription allows us to model the important physics, and to estimate velocities, density profiles, and the radial extent of the circumstellar interaction region and the supernova. The region modeled in these calculations coincides with the region labeled “High Velocity CS Wind” in Figure 1. High-resolution spectra (Fassia et al. 2001) have shown that there may be several velocity components present in the circumstellar medium with velocities as low as 80 km s-1. We focus here on only the higher velocity (but possibly still unresolved) components of the CS spectrum.
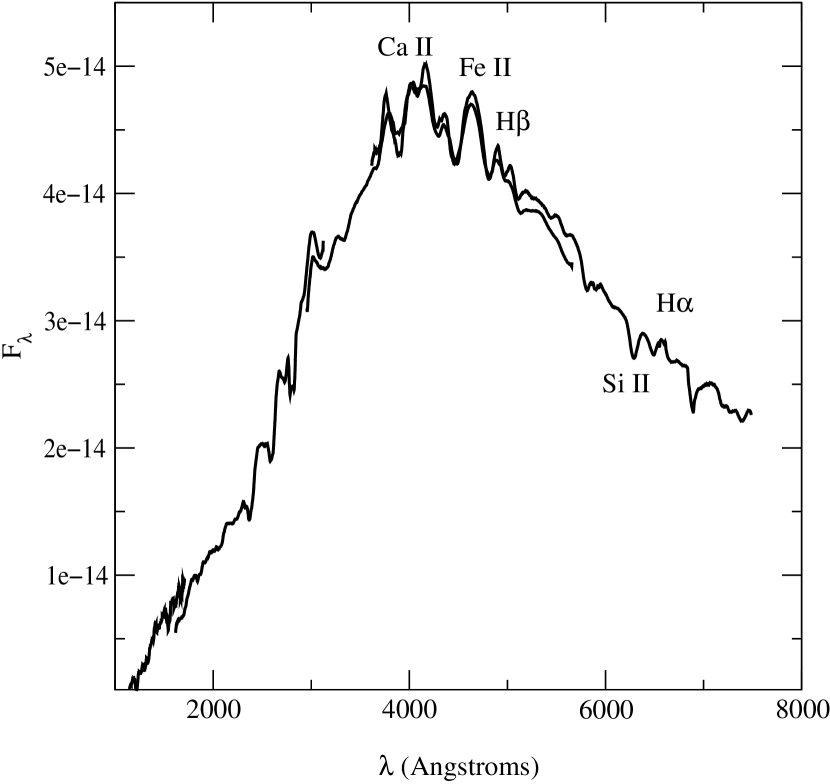
Figure 2 presents an overview of our best model fit compared with the observed HST UV + FLWO optical spectrum taken on Mar 16, 1998. The observed spectrum has been dereddened using the reddening law of Cardelli, Clayton, & Mathis (1989) and a color excess mag (Garnavich et al. 2000). The assumed extinction is also in agreement with the results of Fassia et al. (2000) who find mag. The overall agreement in the line positions and shape of the spectrum is excellent, particularly the pseudo-continuum near 2000 Å. The model consists of a constant-velocity circumstellar wind with km s-1, an inner density of g cm-3, an inner radius cm, and an outer radius cm. The total continuum optical depth at Å (roughly the electron scattering optical depth) is , (where is the total continuum optical depth at 5000 Å), and the mass of the wind is . Assuming the ejected wind velocity was 100 km s-1 this corresponds to a mass-loss rate of 0.0012 yr-1, which should be accurate to an order of magnitude. We believe that the high velocity seen here is due to radiative acceleration of a wind that was ejected at a lower velocity. Since the mass-loss rate depends inversely on the wind velocity at ejection and wind velocities typical of red-giants are km s-1, we think that assuming an ejection velocity of 100 km s-1 allows us to estimate the mass loss rate to an order of magnitude.
In Figures 3a-f we expand the wavelength scale and identify the features in the observed spectrum. Several of them are clearly pairs of interstellar absorption features where one member is due to absorption in our Galaxy and the other is due to absorption in the parent galaxy (Mg II h+k shows this effect clearly). Table 1 lists the line identifications. We note that the “interstellar” absorption lines in the parent galaxy may also have a circumstellar contribution. Close examination of Figure 3 shows that the observed lines are significantly wider than those in the synthetic spectrum. On the other hand, Fassia et al. (2001) observed IR features with velocities as low as 90 km s-1, and Bowen et al. (2000) observed UV P-Cygni features with velocities of km s-1. Convolving the synthetic spectrum with a Gaussian of width 400 km s-1 improves the fit, but since we have assumed a velocity higher than that of the lowest velocity observed (Fassia et al. 2001), it is difficult to separate out the instrumental resolution ( km s-1) from the velocity of the circumstellar medium. It could be that the velocity structure of the circumstellar region is quite complicated with a higher velocity component radiatively accelerated by the supernova, as was suggested for SN 1993J (Fransson et al. 1996), and a lower velocity component wind further away from the progenitor star.
Our model spectrum clearly does an extremely good job in reproducing the overall shape and position of the observed features; nevertheless, the line features are somewhat weaker in general than those observed. This could be due to the effects of the radiation from the circumstellar interaction. The effects of this radiation are not included in these simple preliminary calculations. The effects of the “top-lighting” or “shine-back” are not limited to radiative transfer effects alone, but will also affect the ionization state of the matter, particularly if there is significant X-ray emission from a reverse shock. In future work we will include the effects of external irradiation from the circumstellar region and replace the simple inner Planck function boundary condition that we have used here with a model supernova spectrum. Such a spectrum would be hotter, but diluted and contain both the UV deficit of a normal Type II supernova as well as broad P-Cygni features for which there is evidence in the observed spectrum.
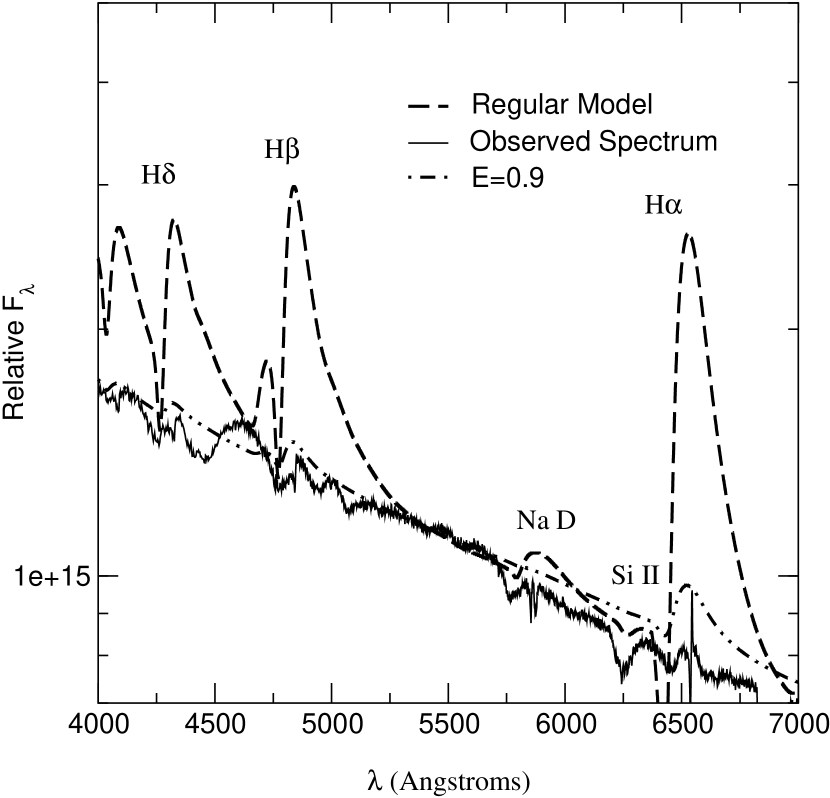
2.2 March 30
Figure 4 displays the combined HST spectra with an optical spectrum obtained at the FLWO. It is interesting to note that the narrow features present on Mar. 16 seem to have disappeared, and the broad lines are all quite weak. A simple analytical explanation of this is presented in Branch et al. (2000), which shows that with the additional emission (“toplighting” or “shine-back”) from the circumstellar shell, one expects the supernova features to appear muted. Figure 5 displays a PHOENIX spectrum, along with the results obtained when it has been muted according to the prescription in Branch et al. (2000). The regular PHOENIX spectrum is based upon the simplest assumptions: homogeneous solar abundances, a model temperature K (the model temperature is simply a way of parameterizing the total bolometric luminosity in the observers frame, see Hauschildt & Baron 1999), a velocity of 5000 km s-1 at , and a density structure . Using Eqn. 23 of Branch et al. (2000), we have calculated the muting, using , where is the ratio of the CS intensity to that of the SN intensity given in Eqn. 22 of Branch et al. (2000), we have assumed a ratio of , where the ratio is the radius of the circumstellar shell to the radius of the “SN photosphere”. While the fit is not terribly good, the trend is evident. Naturally, a fully consistent model would be better, but it would require significant computational resources to resolve both the ejecta and circumstellar region. Fransson (1984) calculated lineshapes expected from the CS wind and the cool, dense shocked material and compared them with those observed in SN 1979C.
Leonard et al. (2000) suggest that SN 1998S underwent a significant mass-loss episode that ended about 60 years prior to explosion and that there was a second, weaker mass-loss episode 7 years prior to explosion. Thus, we may be seeing the over-running of the closest CS shell and still observing effects of the more distant CS shells.
2.3 April 17
During the early evolution the nearest circumstellar material is overrun by the supernova ejecta so the effects of the CSM on the optical and UV spectra become smaller. Inspection of the observed optical spectra (Leonard et al. 2000; Garnavich et al. 2000) shows an increasing contrast in the broad features typical of Type II SNe during the time from the initial HST observation, March 16, to the FLWO spectrum of April 17. Blaylock et al. (2000) show that the strengthening of these features during this transition is well reproduced by including the effects of radiation from the circumstellar interaction region along with the scattering of light from the supernova photosphere in the circumstellar region.
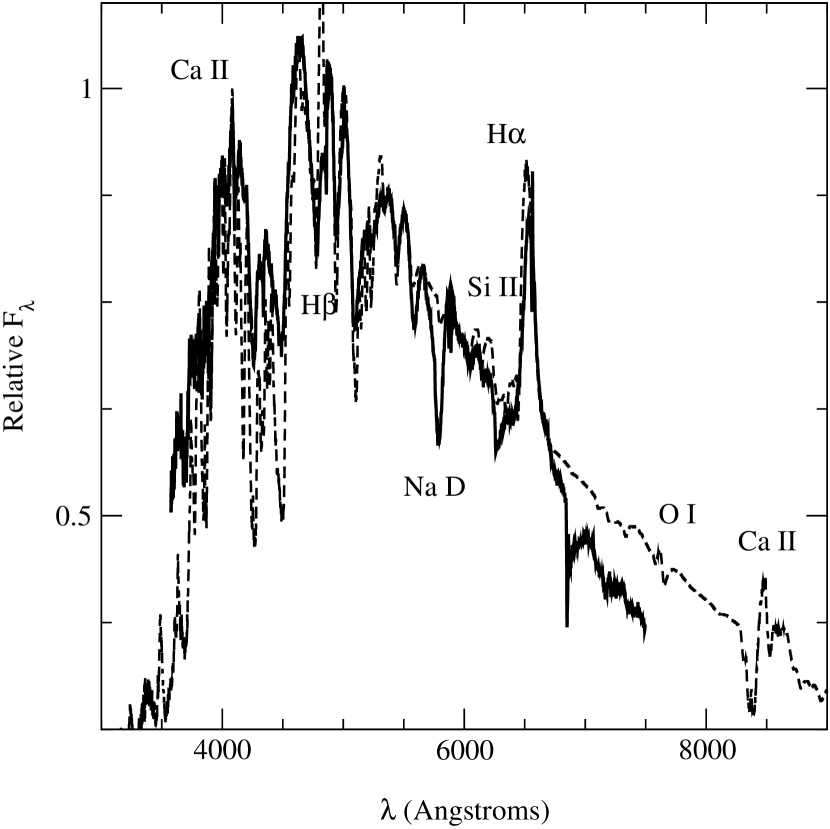
Figure 6 displays our best model fit to the observed optical spectrum taken at the FLWO (Garnavich et al. 2000). We again use simple assumptions: homogeneous solar abundances, a model temperature K, a velocity of 5000 km s-1 at , and a density structure . The highest velocity in the model is only 6,000 km s-1, which gives an indication that the ejecta are entrained by the circumstellar material, but this is not well constrained by our models. Again, overall the fit is very good. The Na D line in the observed spectrum is too weak in our synthetic spectrum, which may indicate the need to self-consistently include the effect of the circumstellar region or may be due to enhanced sodium. The extended absorption wing of H is due in our model to blending of weak Fe II lines, although some of the absorption may be due to Si II. In any case it is not evidence for high-velocity hydrogen.
3 Conclusions
We have shown that a simple model of an ordinary Type II supernova atmosphere interacting strongly with a radiatively accelerated wind reasonably well reproduces the observed line-widths and many of the observed features in both the UV and the optical spectra. This model is robust in that it works well at both very early times and more than a month after the explosion. This confirms the general picture of SNe IIn as being the core collapse of massive stars that have experienced a significant mass-loss epoch and thus are surrounded by a circumstellar medium with which the supernova ejecta interact. As expected from our models (Lentz et al. 1999), SN 1998S has been detected about 600 days after explosion at 6 cm (Van Dyk et al. 1999). Although SN 1998S is about 5 times less luminous than SN 1988Z, further monitoring of the radio light curve will be very interesting and will help determine the mass-loss rate. From the light curve Fassia et al. (2000) find that the mass of the ejected envelope was quite low and the wind was weaker than that of SN 1988Z. SN 1998S may well be more closely related to SN 1979C and SN 1980K. In future work we will develop a more self-consistent model of the supernova circumstellar interaction, and will be able to constrain mass-loss rates and total mass loss which are of great interest for the theory of stellar evolution.
References
- Blaylock et al. (2000) Blaylock, M. et al. 2000, ApJ, in preparation
- Bowen et al. (2000) Bowen, D., Roth, K., Meyer, D., & Blades, J. 2000, ApJ, 536, 225
- Branch et al. (2000) Branch, D., Jeffery, D., Blaylock, M., & Hatano, K. 2000, PASP, 112, 217
- Burstein & Heiles (1982) Burstein, D. & Heiles, C. 1982, AJ, 87, 1165
- Cardelli et al. (1989) Cardelli, J. A., Clayton, G. C., & Mathis, J. S. 1989, ApJ, 345, 245
- Fassia et al. (2000) Fassia, A. et al. 2000, MNRAS, in press, astro-ph/0006080
- Fassia et al. (2001) —. 2001, MNRAS, in preparation
- Filippenko (1997) Filippenko, A. V. 1997, Ann. Rev. Astr. Ap., 35, 309
- Filippenko et al. (2000) Filippenko, A. V. et al. 2000, ApJ, in preparation
- Fransson (1984) Fransson, C. 1984, A&A, 132, 115
- Fransson et al. (1996) Fransson, C., Lundqvist, P., & Chevalier, R. 1996, ApJ, 461, 993
- Garnavich et al. (2000) Garnavich, P. et al. 2000, in preparation
- Gerardy et al. (2000) Gerardy, C., Fesen, R., Höflich, P., & Wheeler, J. C. 2000, AJ, 119, 2968
- Hauschildt & Baron (1999) Hauschildt, P. H. & Baron, E. 1999, J. Comp. Applied Math., 109, 41
- Lentz et al. (1999) Lentz, E., Baron, E., Branch, D., Hauschildt, P. H., Fransson, C., Lundqvist, P., Garnavich, P., & Kirshner, R. P. 1999, BAAS, 30, 1324
- Leonard et al. (2000) Leonard, D., Filippenko, A. V., Barth, A., & Matheson, T. 2000, ApJ, 536, 239
- Li et al. (1998) Li, W. D., Li, C., Filippenko, A. V., & Moran, E. C. 1998, IAU Circ., 6829
- Liu et al. (2000) Liu, Q., Hu, J., Hang, H., Qiu, Y., Zhu, Z., & Qiao, Q. 2000, A&A, 144, 219
- Nilson (1973) Nilson, P. 1973, V, Vol. 1, Uppsala General Catalogue of Galaxies (Uppsala, Sweden: Nova Regiae Societatis Upsaliensis)
- Qiao et al. (1997) Qiao, Q., Li, W., Qiu, Y., Zhang, Y., & Hu, J. 1997, IAU Circ., 6612
- Schlegel (1990) Schlegel, E. M. 1990, MNRAS, 224, 269
- Treffers et al. (1997) Treffers, R. R., Peng, C. Y., & Filippenko, A. V. 1997, IAU Circ., 6627
- Van Dyk et al. (1999) Van Dyk, S. D., Lacey, C. K., Sramek, R. A., & Weiler, K. W. 1999, IAU Circ., 7322
| (Å) | Species | (Å) | Species |
|---|---|---|---|
| 1168 | N I 1168? | 1550 | C IV 1550 |
| 1668 | S II 1668 | 1561 | C I 1561? |
| 1176 | C III 1176 | 1601 | Fe III 1601,1607 |
| 1192 | Si II 1192, S III 1198 | 1625 | Fe II 1625 |
| 1216 | Ly alpha | 1657 | C I 1657 |
| 1234 | S II 1324 | 1666 | S I 1666?, O III 1665, Al II 1671 |
| 1243 | N I 1243? | 1698 | Si I 1698? |
| 1227 | C III 1247 | 1719 | N IV 1719 |
| 1249.5 | Si II 1250, 1263 | 1750 | N III 1750 |
| 1252 | S II 1256 | 1805 | S II 1805 |
| 1299 | Si III 1299 | 1815 | Si II 1815 |
| 1304 | O I 1304 | 1854 | Al III 1854,1862 |
| 1335 | C II 1335 | 1892 | Si III 1982? |
| 1338 | O IV 1338 | 1930 | C I 1930? |
| 1342 | Si III 1342 | 2287 | Co II 2287 |
| 1346 | N II 1346? | 2297 | C III 2297 |
| 1364.3 | Si III 1364 | 2344 | Fe II 2344 |
| 1371 | O V 1371? | 2374 | Fe II 2374 |
| 1394 | S IV 1394 | 2383 | Fe II 2383 |
| 1403 | S IV 1403 | 2396 | Fe II 2396 |
| 1428 | C III 1428? | 2406 | Fe II 2406 |
| 1493 | N I 1493? | 2586 | Fe II 2586,2600 |
| 1527 | Si II 1527,1533? | 2798 | Mg II h+k 2796,2804 |
| 2853 | Mg I 2853 |


![[Uncaptioned image]](/html/astro-ph/0010615/assets/x4.png)
![[Uncaptioned image]](/html/astro-ph/0010615/assets/x5.png)
![[Uncaptioned image]](/html/astro-ph/0010615/assets/x6.png)
![[Uncaptioned image]](/html/astro-ph/0010615/assets/x7.png)
![[Uncaptioned image]](/html/astro-ph/0010615/assets/x8.png)