Preliminary Spectral Analysis of the Type II Supernova 1999em
Abstract
We have calculated fast direct spectral model fits to two early-time spectra of the Type-II plateau SN 1999em, using the SYNOW synthetic spectrum code. The first is an extremely early blue optical spectrum and the second a combined HST and optical spectrum obtained one week later. Spectroscopically this supernova appears to be a normal Type II and these fits are in excellent agreement with the observed spectra. Our direct analysis suggests the presence of enhanced nitrogen. We have further studied these spectra with the full NLTE general model atmosphere code PHOENIX. While we do not find confirmation for enhanced nitrogen (nor do we rule it out), we do require enhanced helium. An even more intriguing possible line identification is complicated Balmer and He I lines, which we show falls naturally out of the detailed calculations with a shallow density gradient. We also show that very early spectra such as those presented here combined with sophisticated spectral modeling allows an independent estimate of the total reddening to the supernova, since when the spectrum is very blue, dereddening leads to changes in the blue flux that cannot be reproduced by altering the “temperature” of the emitted radiation. These results are extremely encouraging since they imply that detailed modeling of early spectra can shed light on both the abundances and total extinction of SNe II, the latter improving their utility and reliability as distance indicators.
1 Introduction
SN 1999em was discovered by the Lick Observatory Supernova Search (IAUC 7294) on Oct 29.44 UT and confirmed by the BAO supernova group on Oct 29.7 UT. It was followed spectroscopically and photometrically by ground-based observatories and was the subject of a Supernova Intensive Studies (SINS) Hubble Space Telescope (HST) observation on Nov 5, 1999. SN 1999em is in the SABc galaxy NGC 1637, with a heliocentric recession velocity of 717 km s-1. The first spectrum taken on Oct 29, 1999 is extremely blue and displays strong Balmer features typical of Type II supernovae with a characteristic velocity of around 10,000 km s-1.
SN 1999em appears to have been a normal Type IIP, likely the result of a core-collapse in a star with a massive hydrogen envelope (Leonard et al., 2000). The early and weak radio emission (IAU Circulars 7318 and 7336) hints that the star did not experience significant mass loss shortly before the explosion, which is also thought to be the normal situation for SNe IIP (see Weiler et al., 2000, and references therein). The lack of circumstellar interaction makes SNe IIP “clean” cases to model, resulting in more reliable atmospheric modeling which in turn makes SNe IIP ideal for cosmological use. Because SN 1999em was observed earlier, and over a wider wavelength range than any other normal bright SN IIP, it is a perfect test bed for our understanding of SNe IIP. These supernovae are of particular interest as distance indicators.
2 Observations
The observed spectra we use in this paper were obtained on Nov 4, 1999 at the Fred L. Whipple Observatory (FLWO), and on Oct. 29, 1999 at CTIO. Leonard et al. (2000) find that on Oct. 29 the V light curve is rising. The point at Nov. 4-5 is on a broad maximium prior to the plateau. The light curve settles down to a plateau phase on about Nov. 20.
3 SYNOW Models
We have used the fast, parameterized supernova synthetic spectra code SYNOW to make an initial investigation of line identifications and expansion velocities. The code is discussed in detail by Fisher (2000) and recent applications include Fisher et al. (1999), Millard et al. (1999), and Hatano et al. (1999a). SYNOW spectra consist of resonant–scattering profiles superimposed on a blackbody continuum. For the two synthetic spectra presented here, the radial dependence of all line optical depths is a power law of index 8. The observed spectra have been corrected for a redshift of 717 km s-1 and for reddening of mag (see below).
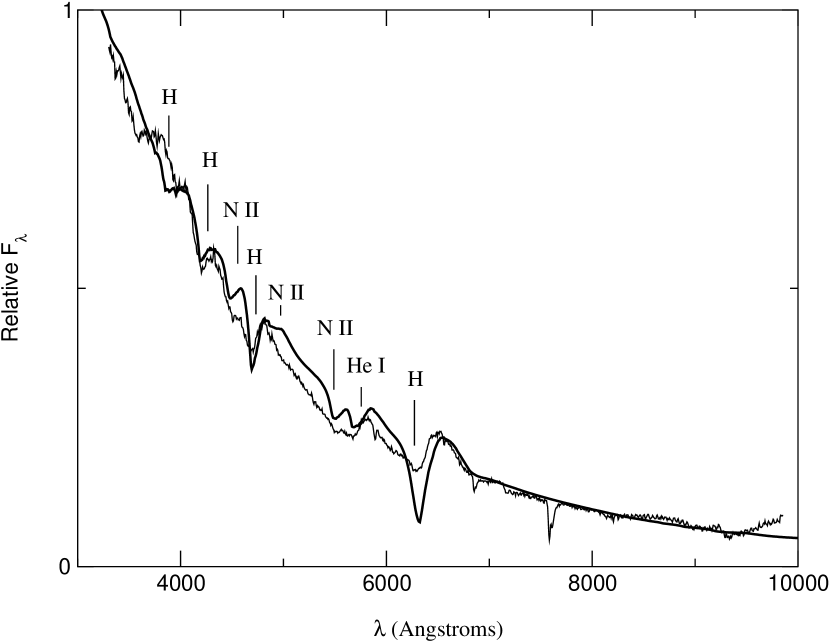
In Figure 1 the CTIO observed spectrum of October 29 is compared with a synthetic spectrum for which the continuum blackbody temperature and the excitation temperature are 13,000 K, the velocity at the photosphere is 11,000 km s-1, and only lines of hydrogen, He I, and N II are considered. The relative strengths of the lines of an ion are fixed by local thermodynamic equilibrium (LTE) at the excitation temperature, but the absolute strengths of the lines of each ion are controlled by a free parameter. The strength of the hydrogen lines has been chosen to make H and H about the same as in the observed spectrum; the relative optical depths of the hydrogen lines are of course fixed by atomic physics so the poor fit to H is due to a deficiency of the resonant–scattering source function for this transition. The only noticeable line of He I in the synthetic spectrum is that of 5876. Lines of N II have been introduced so that and can account for the absorptions near 4500 and 5500 Å, in which case N II also affects the synthetic spectrum slightly near 5000 Å. (In SYNOW when a particular species in introduced, all the lines of that species are included with their relative strengths set by assuming LTE populations, but we focus here on the strong optical features which are relevant to the observed spectra.) The hydrogen and He I identifications are definite, and (in anything remotely like LTE) we can offer no alternative to the N II lines. However, see § 4.1.1 regarding the possibility that some of the “N II” lines may actually be due to hydrogen.
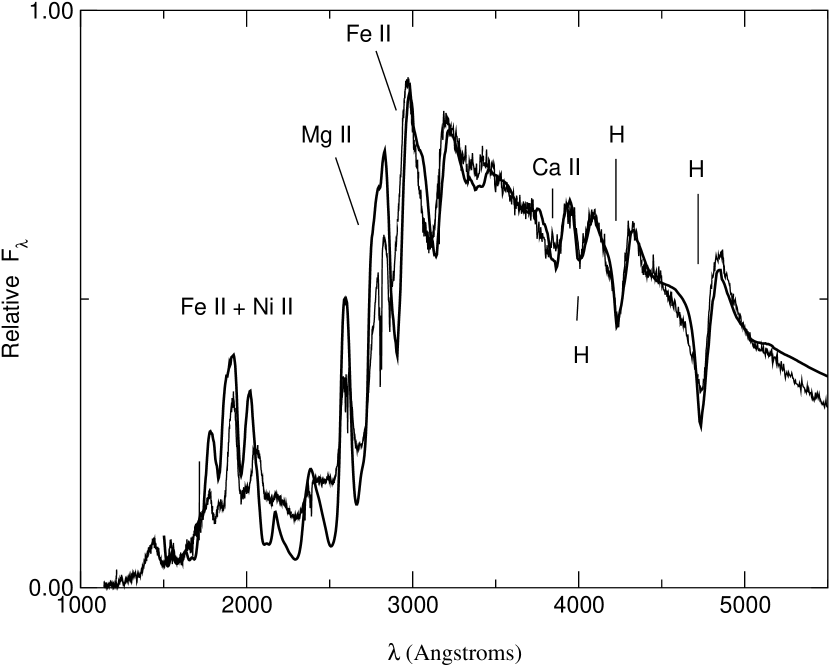
In Figure 2 the HST observed spectrum of November 5 is compared with a synthetic spectrum that has K, km s-1, and lines of hydrogen, Ca II, Mg II, Fe II, and Ni II. The resonance–scattering approximation gives good fits to the features produced by H, H, and H. Ca II contributes only the blend due to 3945 (the H and K lines) and Mg II contributes little other than the blend due to (the h and k lines). All other features in the synthetic spectrum are produced by Fe II and, to a lesser extent, by Ni II. The hydrogen, Ca II, and Mg II identifications are definite. The ultraviolet spectrum evidently is mainly a blend of singly–ionized iron–peak lines; Fe II definitely is present and Ni II probably contributes significantly. Other iron–peak ions that have not been introduced here may also affect the observed spectrum.
4 PHOENIX Models
4.1 Oct 29
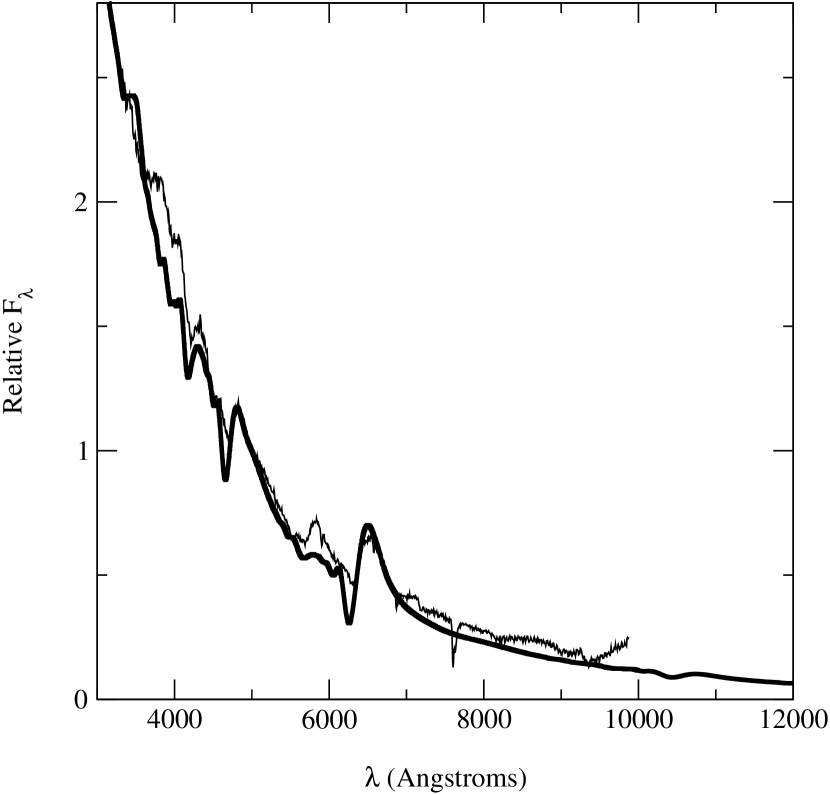
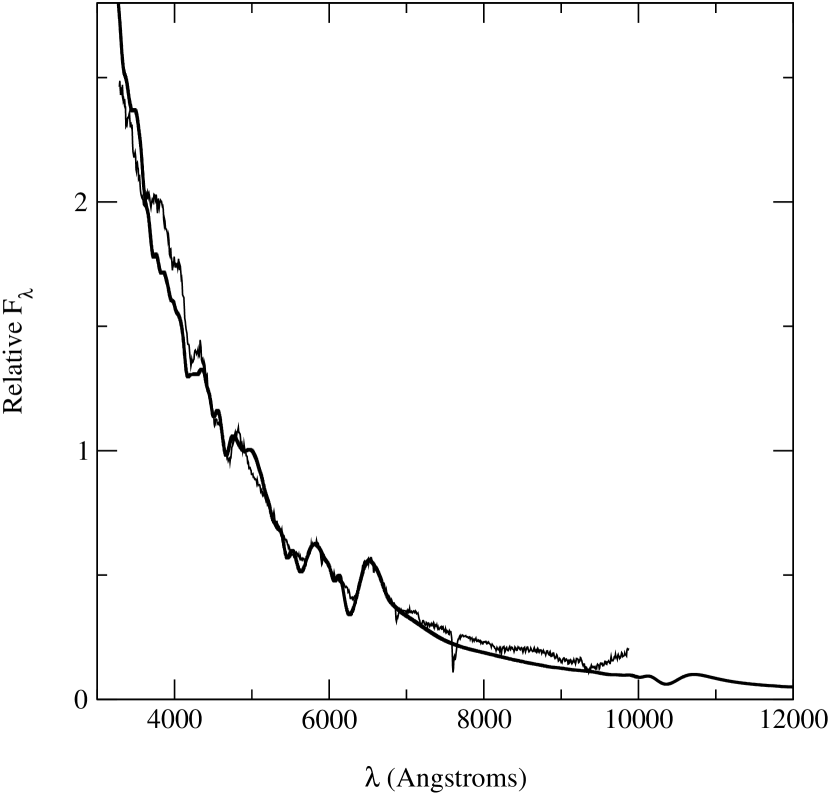
The Galactic extinction to NGC 1637 corresponds to a color excess of mag, but the observed spectrum of SN 1999em shows a distinct NaD interstellar absorption line that may indicate additional reddening in the parent galaxy. We have calculated a grid of detailed fully line-blanketed PHOENIX models in order to determine the “temperature” of the observed spectrum. With most supernova spectra we can trade off higher temperatures for larger reddening within prescribed limits (such that the atmosphere does not become so hot or cool that strong unobserved lines would predominate). Here, with this very early, very blue spectrum, we found that we were not able to freely exchange temperature for reddening, so that the reddening was well determined to be and the “temperature” was about 11,000 K. Figure 3 displays a fit with K and solar compositions; the observed spectrum has been dereddened with mag. The abundances were taken to be solar throughout the model atmosphere and the density was assumed to follow a power-law with and , somewhat shallower than in the SYNOW fits, though we don’t regard the difference as being too significant, since the true density structure is unlikely to follow an exact power-law. We also present models with (see Figure 8).
The fit is rather good, and the cannot be significantly reduced since the Ca II H+K line becomes very strong in the synthetic spectrum with K, but it is weak in the observed spectrum. Also, the observed feature due to He I is not reproduced in the synthetic spectrum. Hotter models are not ruled out but at K the Ca II H+K feature becomes weaker and there is a clear flux deficiency in the red. Normally one expects that one can trade off reddening for temperature in the red part of the spectrum, and this is indeed the case within a certain range of reddening. We assume a standard (Cardelli et al., 1989) reddening law with . However, since the spectrum depends strongly on the strength of the Ca II H+K feature, we find that K; the K model requires an extinction to reproduce the red flux, but it then does a poor job in the blue. Thus, we find that and . We show a model with below.
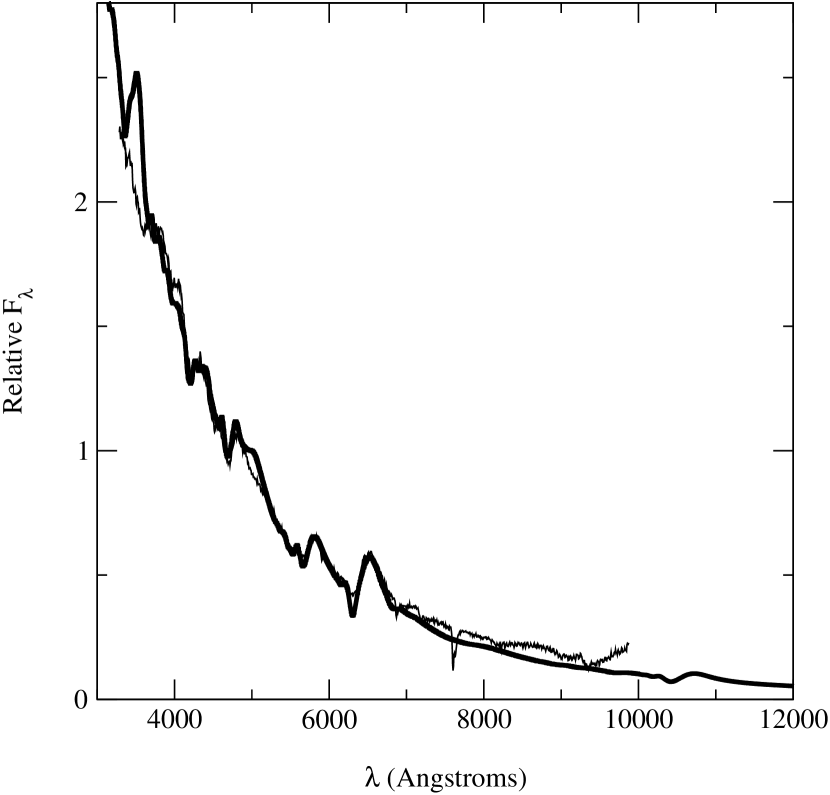
We also found that we could not reproduce the He I feature by enhancing the amount of gamma-ray deposition. Therefore, guided by the indications of enhanced N in the SYNOW fits, we calculated a series of spectra where we enhanced He by a factor of 2.5 (reducing H appropriately), and we enhanced N by a factor of 10 (reducing C+O). This fit is shown in Figure 4, where now the He I fits well, but K in order to keep the Ca H+K feature from becoming too strong in the synthetic spectrum. Figure 5 with K, the same compositions and shows that the effects of the Ca H+K feature can be reduced by increasing the model temperature and increasing the reddening modestly. Therefore we conclude that there is strong evidence for enhanced helium in SN 1999em [a similar result was found for SN 1987A (Arnett et al., 1989; Eastman & Kirshner, 1989; Lundqvist & Fransson, 1996; Blinnikov et al., 2000)]. We note at these early times that the material is hot enough for the optical helium lines to be excited even in LTE (see Hatano et al., 1999b), so while gamma-ray deposition was needed in e.g. SN 1993J (see Baron et al., 1995a, and references therein), it is not required at these early times (nor is it precluded at later times, although we did not find it necessary for the spectra a week later).
4.1.1 Complicated Balmer and He I Lines
We attempted to confirm the evidence in the SYNOW fits that nitrogen is also enhanced and that N II contributes to the observed features at . To do this we reduced the abundance of nitrogen from its solar value by a factor of ten. This synthetic spectrum showed that the and features do decrease, but the feature that is attributed to in the SYNOW fits is still present (this is not surprising, since the feature also appears in Figure 3 with solar compositions). Guided by the LTE line spectra presented by Hatano et al. (1999b), we reduced carbon by a factor of ten from its solar value and the 4600 Å feature remained. Finally, reducing both carbon and oxygen by a factor of ten from their solar values (leaving N fixed) still produces a feature with if anything a better shape than in previous calculations. Thus, with the “usual suspects” the source of the 4600 Å feature remains unidentified, and the evidence for enhanced nitrogen is weakened, but it does a good job on the features.
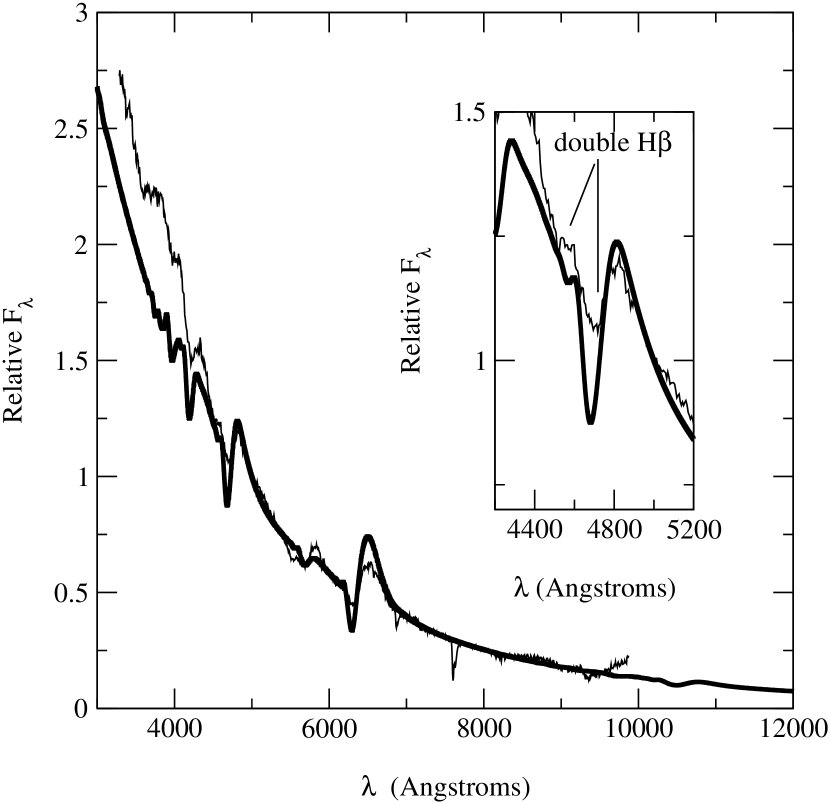
The lack of a strong candidate for the 4600 Å feature leads us to consider more exotic line identifications. Careful examination of Figure 3 reveals that even with solar compositions features appear in the synthetic spectrum at the approximately correct wavelength positions. This led us to test the hypothesis that the features are actually produced by “complicated P-Cygni” profiles, that is the usual wide P-Cygni profile with the peak centered near zero velocity and a second P-Cygni profile with a second absorption minimum around 20,000 km s-1. Figure 6 displays the synthetic calculation with the metalicity reduced to . One can be confident that all the lines in this synthetic spectrum are produced solely by hydrogen and helium and it is clear that each line is associated with high-velocity absorption, which matches the observed lines very well. (It may be a true P-Cygni feature, with both a peak and a dip, but it is probably premature to decide that at this point.) This is due to the shallow density gradient and high model temperature which keeps the actual electron temperature above 8000 K all the way to the highest velocity in the model, 37,500 km s-1. Complicated NLTE effects vary the Balmer level populations in the mid-velocity range, producing the double P-Cygni lines, i.e. there exist two line forming regions for hydrogen and helium. This is the first time that we have encountered this result and it shows that particularly in differentially expanding flows, one cannot be certain of line identifications until careful synthetic spectral models have been calculated. Thus, we therefore believe that the features that we have heretofore attributed to N II (and which would require enhanced N) are in actuality due to H I and He I, which form secondary features at high velocity. Since this appears in our modeling without any special parameters (i.e. Figure 3), we believe this is a true NLTE effect produced simply by the shallow density gradient.
4.2 Nov 4–5
Guided by our results in § 4.1 we have computed full NLTE models for the epoch observed with HST using both solar and enhanced He+N compositions (since we have not ruled out enhanced N, we will continue to use it for expediency). Figure 7 shows our best fit for solar compositions and with K. Figure 8 displays our best fit for the enhanced He+N compositions, where we have also found the fit is improved by setting and . Also displayed is a ground-based optical spectrum obtained on Nov. 4, 1999 at the FLWO, which lends support for enhanced He. All the models show unobserved strong features in the range 2000-3500 Å, which could be due to iron-peak elements. Thus, it is possible that the metallicity of SN 1999em was somewhat less than solar, but we will study this question in future work.
5 Conclusions
We have shown that both direct synthetic spectral fits and detailed NLTE models do a good job of reproducing the observed optical+UV spectra of SN 1999em. We have shown that detailed NLTE spectral modeling of very early spectra of Type II supernova can provide an independent estimate to the total reddening as well as abundance information. Specifically we find that and mag, and we find strong evidence for helium enhanced by at least a factor of 2 over the solar value. We obtain the striking result that observed features are likely due to “complicated P-Cygni” lines of hydrogen and helium, and thus one needs to be especially careful with line identifications in hot differentially expanding flows. That the observed complicated profiles fall right out of the PHOENIX calculations is remarkable and lends strong support to the reliablity of the modeling.
The fact that planned supernova search programs will preferentially find supernovae very early, combined with our results that the extinction can be determined by modeling the very early spectra, lends promise to the use of Type II supernovae as distance indicators, through the use of phenomenological applications like the “Expanding Photosphere Method” (Baade, 1926; Kirshner & Kwan, 1974; Branch et al., 1981; Schmidt et al., 1992; Eastman et al., 1996) or through sophisticated modeling of the “Spectral-fitting Expanding Atmosphere Method” (Baron et al., 1993, 1994, 1995a, 1995b, 1996).
References
- Arnett et al. (1989) Arnett, W. D., Bahcall, J., Kirshner, R. P., & Woosley, S. E. 1989, Ann. Rev. Astr. Ap., 27, 629
- Baade (1926) Baade, W. 1926, Astr. Nach., 228, 359
- Baron et al. (1994) Baron, E., Hauschildt, P. H., & Branch, D. 1994, ApJ, 426, 334
- Baron et al. (1995a) Baron, E., Hauschildt, P. H., Branch, D., Austin, S., Garnavich, P., Ann, H. B., Wagner, R. M., Filippenko, A. V., Matheson, T., & Liebert, J. 1995a, ApJ, 441, 170
- Baron et al. (1996) Baron, E., Hauschildt, P. H., Branch, D., Kirshner, R. P., & Filippenko, A. V. 1996, MNRAS, 279, 779
- Baron et al. (1993) Baron, E., Hauschildt, P. H., Branch, D., Wagner, R. M., Austin, S. J., Filippenko, A. V., & Matheson, T. 1993, ApJ, 416, L21
- Baron et al. (1995b) Baron, E., Hauschildt, P. H., & Young, T. R. 1995b, Physics Reports, 256, 23
- Baron et al. (2000) Baron, E., Nugent, P., Branch, D., Hauschildt, P. H., Leonard, D., Filippenko, A. V., Turatto, M., & Cappellaro, E. 2000, Phys. Rev. Lett., in preparation
- Blinnikov et al. (2000) Blinnikov, S., Lundqvist, P., Bartunov, O., Nomoto, K., & Iwamoto, K. 2000, ApJ, 532, 1132
- Branch et al. (1981) Branch, D., Falk, S. W., McCall, M. L., Rybski, P., Uomoto, A. K., & Wills, B. J. 1981, ApJ, 244, 780
- Cardelli et al. (1989) Cardelli, J. A., Clayton, G. C., & Mathis, J. S. 1989, ApJ, 345, 245
- Eastman & Kirshner (1989) Eastman, R. & Kirshner, R. P. 1989, ApJ, 347, 771
- Eastman et al. (1996) Eastman, R., Schmidt, B. P., & Kirshner, R. 1996, ApJ, 466, 911
- Fisher (2000) Fisher, A. 2000, PhD thesis, Univ. of Oklahoma, unpublished
- Fisher et al. (1999) Fisher, A., Branch, D., Hatano, K., & Baron, E. 1999, MNRAS, 304, 67
- Hatano et al. (1999a) Hatano, K., Branch, D., Baron, E., & Fisher, A. 1999a, ApJ, 525, 881
- Hatano et al. (1999b) Hatano, K., Branch, D., Fisher, A., Deaton, J., & Baron, E. 1999b, ApJ Suppl., 121, 233
- Kirshner & Kwan (1974) Kirshner, R. P. & Kwan, J. 1974, ApJ, 193, 27
- Leonard et al. (2000) Leonard, D. et al. 2000, ApJ, in preparation
- Lundqvist & Fransson (1996) Lundqvist, P. & Fransson, C. 1996, ApJ, 464, 924
- Millard et al. (1999) Millard, J., Branch, D., Baron, E., Hatano, K., Fisher, A., Filippenko, A. V., Kirshner, R. P., Challis, P. M., Fransson, C., Panagia, N., Phillips, M. M., Sonneborn, G., Suntzeff, N. B., Wagoner, R. V., & Wheeler, J. C. 1999, ApJ, 527, 746
- Mitchell et al. (2000) Mitchell, R., Baron, E., Branch, D., Lundqvist, P., Blinnikov, S., & Hauschildt, P. H. 2000, ApJ, in preparation
- Schmidt et al. (1992) Schmidt, B. P., Kirshner, R., & Eastman, R. 1992, ApJ, 395, 366
- Weiler et al. (2000) Weiler, K., Panagia, N., Sramek, R. A., Dyk, S. V., Montes, M. J., & Lacey, C. 2000, in Cosmic Explosions! Proc. of the 10th Maryland Conference on Astrophysics, ed. V. Trimble (New York: American Inst. of Physics), in press