A low global star formation rate in the rich galaxy cluster AC 114 at
Abstract
We present the results of a wide-field survey for H-emitting galaxies in the cluster AC 114 at . Spectra centred on H at the cluster redshift have been obtained for 586 galaxies to out to a radius of Mpc. At most, only % of these were found to be H–emitting cluster members. These objects are predominantly blue and of late-type spiral morphology, consistent with them hosting star formation. However, % of the cluster members classified morphologically as spirals (with HST), have no detectable H emission; star-formation and morphological evolution in cluster galaxies appear to be largely decoupled. Changes in the H detection rate and the strength of H emission with environment (as traced by local galaxy density) are found to be weak within the region studied. Star formation within the cluster members is also found to be strongly and uniformly suppressed with the rates inferred from the H emission not exceeding 4 M⊙ yr-1, and AC 114’s H luminosity function being an order of magnitude below that observed for field galaxies at the same redshift. None of the galaxies detected have the high star formation rates associated with ‘starburst’ galaxies; however, this may still be reconciliable with the known (%) fraction of ‘post-starburst’ galaxies within AC 114, given the poorly determined but short lifetimes of starbursts and the possibility that much of the associated star formation is obscured by dust.
Subject headings:
galaxies: clusters — galaxies: evolution — galaxies: formation1. Introduction
Clusters of galaxies provide a powerful laboratory for studying the evolution of galaxies. In the hierarchical picture of galaxy formation, clusters grow in mass by accreting galaxies from the surrounding field. Once these galaxies enter the dense environment of the cluster, star formation is suppressed and the galaxies evolve to become early-type galaxies. Many processes operate to make the cluster environment hostile to star forming galaxies. The most important processes include: mergers and violent encounters between galaxies (Lavery & Henry, 1994); tidal stripping and ‘harassment’ (Byrd & Valtonen 1990, Moore et al. 1996); ram pressure stripping of the gas disk (Gunn & Gott 1972, Abadi et al. 1999, Quilis et al. 2000); and simply the removal of any gas reservoir surrounding each galaxy (thus preventing replenishment of the gas disk; Larson, Tinsley & Caldwell 1980, Balogh et al. 1999).
Since clusters can be observed out to , we can use the look-back times of the distant systems to directly investigate the evolution of cluster galaxies. Butcher & Oemler (1978a) and many subsequent authors have noted that the fraction of blue galaxies in cluster cores increases with redshift. Spectroscopic surveys have confirmed that these blue galaxies are indeed cluster members (e.g. Dressler & Gunn 1982, 1983; Couch & Sharples 1987, hereafter CS; Lavery & Henry 1988; Dressler et al. 1999) and have identified a conspicuous population of galaxies with no detectable emission (e.g. [Oii]3727) but with abnormally strong Balmer absorption lines (termed ‘E+A’ galaxies by Dressler & Gunn, 1982 and ‘k+a’ or ‘a+k’ galaxies by Dressler et al. 1999). It has also been proposed that the systematically higher blue galaxy fractions in distant clusters is coupled with a reduction in the S0 galaxy populations in these systems [identified from imaging with the Hubble Space Telescope (HST)] in comparison to their local counterparts (Dressler et al. 1997; Couch et al. 1998, hereafter C98).
The evolution of the galaxy populations in distant clusters may be explained as the result of the increased activity of field galaxies at intermediate redshift (Lilly et al. 1996), combined with a higher accretion rate in these more distant systems (Bower 1991, Kauffmann 1996, Diaferio et al. 2000): not only are the galaxies forming stars more rapidly when they arrive in the cluster, but they also arrive at a higher rate. However, while an overall picture of the evolution of cluster galaxies is emerging, we have no detailed understanding of the physical mechanism responsible for the suppression of star formation and its effect on other properties such as mass and morphology. The key issues can be summarised by three questions: (1) By how much and how quickly is star formation suppressed in the infalling field galaxies? (2) What is the radial dependence of the star formation suppression? (3) Does the cluster simply suppress star formation or does it first promote a burst of star formation?
The ability of current observations to address these issues is, however, seriously hindered by most distant cluster studies having largely concentrated on the central core ( Mpc) regions in which the BO-effect was originally discovered: spectroscopic data of the quantity and quality needed to track in detail the star formation characteristics of galaxies well outside the core remain in short supply. Progress towards redressing this problem has been made by Balogh et al. (1997, 1998), who used the CNOC Survey data (Yee, Ellingson & Carlberg 1996) to trace the spectral properties of galaxies out to and beyond the virial radius in 15 X-ray bright clusters at . Using the equivalent width of the [Oii]3727 emission line as a star formation indicator, they found a smooth decline in the star formation rate from the field into the interior of their clusters, an effect which they claimed was likely to be independent of the morphology–density relationship established by Dressler (1980). That this decline should extend so far out in their clusters is surprising, since simple cluster mass models would suggest that galaxies at and beyond the virial radius should have only become recently bound to the cluster.
While the CNOC study is an important first step to understanding the star formation patterns at large radii in distant clusters, a number of issues remain. In particular, Poggianti et al. (1999; hereafter P99) and Smail et al. (1999) have questioned the reliability of [Oii]3727 as a star formation indicator. P99 have noted that there are insufficient bright, star-forming galaxies in their clusters to explain the abundance of a+k/k+a objects. Instead, they suggest that the progenitors of the a+k/k+a galaxies are e(a) emission line objects (which show both weak [Oii] emission and strong absorption) in which the bulk of the star formation is obscured by dust (see also Poggianti & Wu 2000). Furthermore, Smail et al. (1999) suggest, on the basis of radio continuum observations, that a significant number of the apparently post-starburst (a+k/k+a) galaxies in the core of Abell 851 () are in fact on-going star burst galaxies in which the star formation (as measured by the [Oii] emission line) is completely hidden by dust.
Motivated by these issues and the clear need to explore further the star formation behaviour at large cluster-centric radii, we have embarked on an intensively–sampled, wide–field ( Mpc) H survey of galaxies in 3 optically–selected clusters at . These clusters – AC103, AC118, and AC 114 – have been subjected to extensive imaging and spectroscopy both from the ground and from space (HST and ROSAT), the results of which have shown them to be quite diverse in their structural and X-ray properties. They therefore not only provide useful targets for studying the cluster-to-cluster variations in star forming galaxies, but also provide an important test of how the global star formation history is dependent on cluster morphology. By exploiting recent innovations in telescope instrumentation, our program is able to survey large numbers of () galaxies in each cluster field for H emission – the most direct indicator of star formation – down to very low, sub–1 M⊙ yr-1 levels. Hence it provides a highly complete inventory of star-forming galaxies with sufficient statistical sampling at large cluster-centric radii to robustly determine cluster-to-cluster trends.
In this paper we present the first observations to be made as part of this program: H spectroscopy of galaxies in the field of AC 114 at . In the next section we describe our observations and outline the novel techniques that allow us to obtain spectra for this number of galaxies in just 4 hrs on a 4-m telescope. In section 3, we provide details of our reduction techniques and the detection and measurement of H emission in our spectra. The numbers of H emitting galaxies found, their distribution within the cluster, and the star formation rates and luminosity function associated with this population are then examined in section 4. We then discuss our results in section 5 and summarise our conclusions in section 6.
2. Observations
The observations were made on the nights of 1999 August 14 and 15, using the upgraded Low Dispersion Survey Spectrograph (LDSS) on the 3.9 m Anglo-Australian Telescope. LDSS is a combined imager/spectrograph whose performance has recently been enhanced by the installation of a new red-optimised volume phase holographic (VPH) grism and the use of a MIT/Lincoln Lab ‘deep depletion’ pixel format CCD as its detector. In combination, they give LDSS a factor of 2 better throughput (at 7000Å) than its predecessor when working in the ‘high dispersion’ (177Å mm-1, 9.5Å resolution) mode used here (for further details see Glazebrook 1998).
In addition to these improvements, a ‘nod-and-shuffle’ technique has been implemented with LDSS, providing for a significant increase in multiplex gain when using the instrument in multi-slit mode. This technique involves simultaneously shuffling the charge on the CCD in concert with moving the telescope back and forth on the sky (nodding), so that the objects and sky are observed through the same part of the slit and with the same pixels of the detector. It provides for high-precision sky-subtraction – particularly in the 0.7–1.0m region where the rapid time-sampling of the varying night-sky emission is a distinct advantage – and obviates the need for long slits (in order to get good sampling of the sky adjacent to the object); consequently, it is possible to work with very small apertures (‘micro-slits’) in the focal plane mask and thus observe many more objects simultaneously. For this study, this multiplex gain advantage was extended further by the use of a blocking filter to restrict our spectral coverage to the wavelength window in which the H emission from cluster members would be seen: . As a result of these innovations, we were able to observe up to galaxies with a single mask over the (Mpc2 at , for ) field-of-view of LDSS. Furthermore, a particular advantage of observing clusters at a redshift of is that H is redshifted into a wavelength region relatively clear of night sky emission lines.
In order to relate the H emission to the underlying galaxy mass, our selection of spectroscopic targets was based on an -band limited galaxy sample identified within the field of AC 114. Here we used the automated image detection and photometry package, SExtractor (Bertin & Arnouts 1996), to generate a galaxy catalogue from a deep, AAT prime-focus -band image taken (for another project) in seeing of 1.2′′ (FWHM). In doing so, a detection threshold of 1- above sky and a minimum object area size of 10 pixels was used. A zero-point was established for the photometry by comparing our ‘total’ SExtractor magnitudes with calibrated -band photometry derived for the central region of AC 114 from a CCD image taken as part of the lensing study of Smail et al. (1991). This yielded a zero-point with a 1 uncertainty of mags. The final list of potential targets then consisted of all galaxies with , supplemented by objects going mags fainter than this limit to provide some flexibility in the mask design process.
The multi-slit mask design was done semi-automatically using the design package purposely written by two of us (K.G.B. & R.G.B.) for general LDSS use. This takes the list of targets and their astrometric positions, and optimally assigns slits to them to maximise the number of objects observed. Here, we adopted a circular ‘micro-slit’ geometry – a round hole 1.5′′ in diameter (corresponding to 9 kpc at ) – thought to be the size and shape which best accommodated the typical seeing experienced at the AAT (median of ) and the desire to keep aperture affects to a minimum. In running design, some manual intervention was required to ensure that a reasonable number of galaxies from the spectroscopic samples of CS, Couch et al. (1994), and C98 were included for comparison purposes. In addition, ‘double’ slits were assigned to about 30% of the objects, allowing them to be observed in both the ‘on-object’ and ‘off-object’ positions and thus avoiding, in these cases, any reduction in on-source integration time due to beam-switching. This involved placing a second slit 5′′ east of the object, being the location to which the telescope was moved for the ‘off-object’ exposure.
![[Uncaptioned image]](/html/astro-ph/0010505/assets/x1.png)
Fig. 1.– Our sampling rates and H detection rates as a function of magnitude and radius from the centre of AC 114. (a)The connected solid squares indicate the percentage of galaxies observed as a function of magnitude; the expected composition of these galaxies in terms of being ‘cluster’ and ‘field’ objects is indicated by the dotted and dashed lines, respectively. (b)As for (a) but with clustercentric radius plotted on the abscissa. (c)The detection rate of H-emitting ‘cluster’ galaxies versus magnitude. The connected solid squares indicate all detections, be they case (i) or case (ii); the dotted line indicates case (i) detections only. (d)As for (c) but as a function of radius. The dashed line shows the rise with increasing radius in the fraction of morphologically classified cluster spirals.
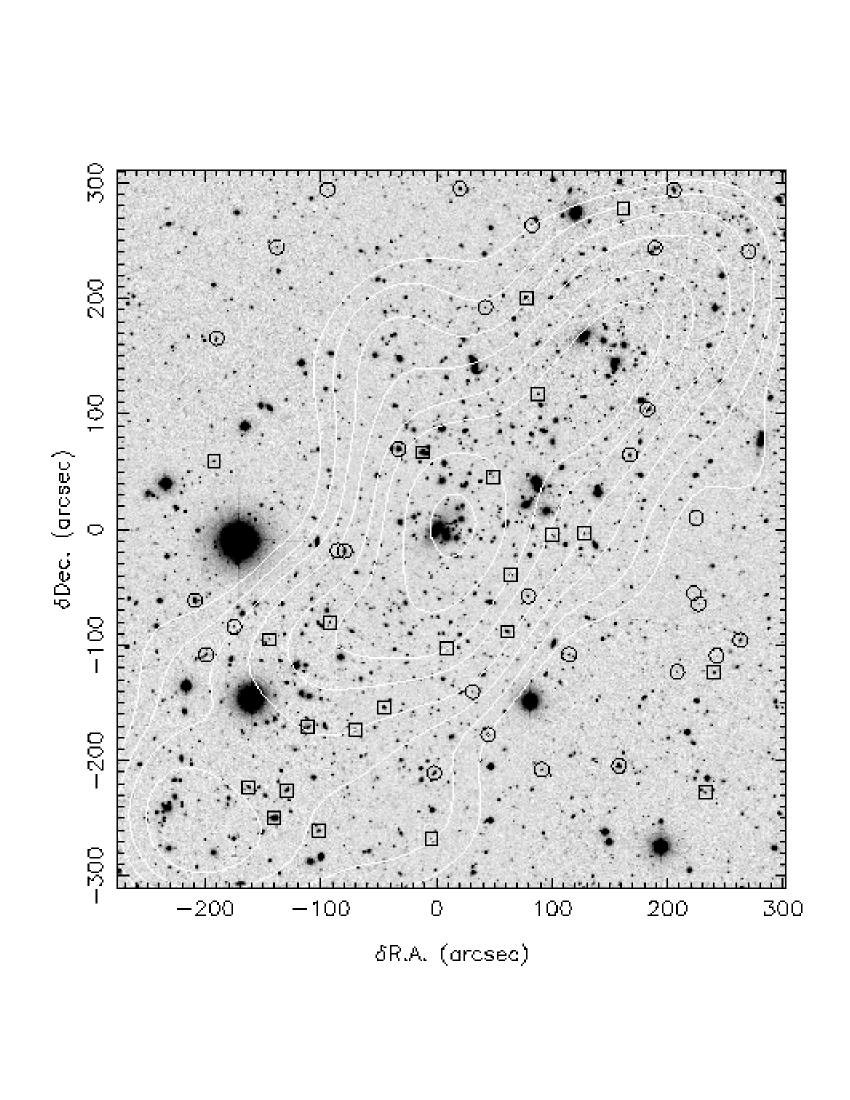
Upon completion of the mask design process, two masks were manufactured each containing slits for unique galaxies and slits in total. Our photometric selection function for spectroscopic targets is shown in Fig. 1(a) where it is seen that the sampling rate drops almost monotonically from at to 25% at . In terms of how our slits sample the galaxy distribution as a function of radius from the centre of AC 114, this is seen in Fig. 1(b) to be reasonably constant at % out to Mpc. For comparison, we also show in Figs. 1(a) and 1(b) the expected composition of our sample in terms of ‘cluster’ and ‘field’ galaxies as a function of and cluster-centric radius, respectively. These percentages (shown as the broken lines) are based on both number counts from our -band image and those of Metcalfe et al. (1995), the latter being used to estimate the surface density of field galaxies. We see that while the field contamination does rise with radius, it does so only slowly (going from % to %). This is due to AC 114 being significantly elongated in the SE-NW direction as can be seen in Fig. 2. Here we show a combined grey-scale image of our LDSS field with contours showing the distribution of galaxies with and which populate or lie close to AC 114’s E/S0 color-magnitude sequence () overlayed. The contours show how flattened the cluster is, with it extending right across the full diagonal of the LDSS field. This flattened structure is also mirrored in the X-ray emission from AC 114 (Terlevich 1999).
Observations through only one of the two masks were possible, due to the mixed weather conditions experienced on the 2 nights of our run. A total of 4 hours integration, 2 hours ‘on-object’ and 2 hours ‘off-object’, were obtained in clear conditions and seeing of 1.2–1.5′′ (FWHM). This was broken up into a series of 30 min exposures during which 30 nod-and-shuffle cycles were executed, each cycle involving a 30 s integration in the ‘on-object’ position, a 2 s interval in which the telescope was ‘nodded’ and the charge on the CCD shuffled, followed by another 30 s integration in the ‘off-object’ (or ‘sky’) position, and then a further 2 s delay in order to nod the telescope and shuffle the charge on the CCD back to its original position. The performance of LDSS is such that in these 2 hours of on-source integration, a 3 flux limit of erg s-1 cm-2 per 9.5Å resolution element can be reached, allowing us to detect cluster members with an H luminosity of (H) erg s-1 and a star-formation rate of M⊙ yr-1.
3. Reductions and H measurements
The final CCD image read out after each series of 30 nod-and-shuffle cycles contains two equal pixel regions, one of which has recorded the signal in the ‘on-object’ position and the other the signal in the ‘off-object’ position. These were extracted separately from all 8 of the CCD images obtained over our 4 hours of observation, with the iraf routine ficpix used to interpolate over the column defects introduced by the combination of trapping sites and the charge shuffling process. They were then combined to produce two final co-added ‘on-object’ and ‘off-object’ frames. The co-addition process was performed using the imalign and imcombine routines within iraf; these ensured that there was perfect registration between the individual frames and provided for cosmic-ray removal (via the ‘avsigclip’ option in imcombine) when combining them. The final step was to subtract the co-added ‘off-object’ frame from its ‘on-object’ counterpart, thereby (and quite trivially) producing an image containing sky-subtracted spectra.
The exact location of each of these spectra on the image was determined using the associated arc-lamp exposure, with a program written to search for the pattern of 4 arc lines (8408.2, 8424.6, 8521.4 and 8667.9Å) expected over our observed wavelength interval. Once recognised, their centroids were used to define the bounds of each spectrum in both the spatial and dispersion directions. Since the 1.5′′ diameter ‘micro-slits’ project to pixels on the LDSS detector, the spatial bounds were set so as to include 2 CCD rows either side of the row in which the mean centroid position was located. In the dispersion direction, a calibration between wavelength and CCD column was established using the centroids of the 4 arc lines; this was used to define the bounds of each spectrum, being those columns which lay within the interval Å (the limits of the blocking filter). With these bounds defined, each spectrum was then extracted from the image and collapsed down in the spatial direction to produce a final one-dimensional sky-subtracted and wavelength calibrated spectrum. A total of 675 spectra were recovered in this process, providing observations of 586 unique galaxies (given the number of duplicate ‘double’ slit spectra).
All of the spectra were then inspected independently by two of us (M.L.B. & W.J.C.), to search for H emission. Any conspicuous emission-line feature was checked in two ways: firstly, to see that it was not residual night-sky emission that had not been fully removed in the sky-subtraction process, and secondly, to confirm its identification as H by detection at the correct observed wavelength of the nearby [Nii]6548, 6583Å lines (as also any other line; in particular [SII]Å). The two separate lists of identifications were then compared and this revealed 3 distinct categories of detections: (i) clear cut cases where H was easily identified and confirmed by one or more other emission lines; (ii) an emission line was clearly identified, but its confirmation as H via the presence of one or both of the [Nii] lines was highly dubious, (iii) an emission feature was seen but flagged as being highly doubtful due it being either ambiguous (ie. there were other equally significant but doubtful emission line features in the spectrum) or a possible residual night-sky feature. In case (i) there was no disagreement between the two identifiers. As might be expected, there were more instances of disagreement for the case (ii) and (iii) objects; these were resolved by further inspection and checking of features and coming to a consensus on their identification. As a result, there was some promotion and demotion of objects between the two classes. The final merged list contained 43 case (i) objects and 80 case (ii) objects; any case (iii) object was at this point discarded from any subsequent analysis. Representative examples of case (i) and case (ii) spectra are shown in Fig. 3.
To quantify the emission observed from these objects, a flux calibration was derived for our spectra using the same -band image upon which our target selection was based. It was used to calculate the magnitudes objects would have when observed through our 1.5′′ circular ‘micro-slits’111The fact that the -band image and our LDSS observations were taken in almost identical seeing conditions ( FWHM) should ensure that this is done accurately, free of any profile-dependent systematic effects.. The corresponding flux (in erg s-1 cm-2 Å-1) received by the spectrograph was computed from these ‘slit’ magnitudes using the nicmos converter, which in turn was used to determine the flux that fell within the wavelength interval of each spectrum. This was compared with the total number of continuum counts recorded in our observed spectra (corrected for any scattered light; see below) to give a mean flux (per count) calibration of erg s-1 cm-2 count-1. In applying this to the data, the uncertainty of the flux in each pixel was computed using the standard, Poisson treatment, including the read noise and Poisson uncertainty resulting from the sky subtraction. We also included the 12% uncertainty in the flux calibration which was added in quadrature.
One complication of the nod and shuffle technique is that scattered light affects the object and sky spectra differently. This introduces a small systematic error in the continuum level of the extracted spectra. For a subset (88) of the spectra, the underlying scattered light component was determined locally on the ‘subtracted’ image by taking the mean signal just above and below the extracted spectra and averaging the two values. For these galaxies, a good correlation was found between the mean (corrected) continuum flux near H and the total I band magnitude: , where is the continuum flux in ergs s-1cm-2pix-1 and the rms scatter in the logarithm of this quantity was found to be 0.02. We used this correlation to estimate the continuum level for the remaining spectra, and the appropriate flux was added to the spectrum to achieve this.
The H flux was measured automatically for each spectrum, using a fortran program available upon request. First, the continuum was determined by fitting a single line to the pixels lying in the rest wavelength ranges and (chosen to avoid the [Nii] lines), using weighted linear regression with the flux in each pixel weighted by the inverse square of its uncertainty. An iterative rejection of points lying 1.5 away from the fit was employed to exclude noise spikes and absorption features. The H flux was then computed by summing the flux above this continuum, in the rest wavelength range , which includes all the flux from our widest lines and stays well clear of the adjacent [Nii] lines. For the pixels at the extreme ends of this wavelength interval, we only include a fraction of the flux, equal to the fraction of the pixel which lies within the specified interval. The uncertainty in the line flux for each pixel is then computed as the quadrature sum of the uncertainties in the total flux and in the continuum fit at that pixel (including the correlation coefficient in the latter).
We did not compute equivalent widths in the usual way, because the continuum level is very low (consistent with zero) for many galaxies, and because there are systematic uncertainties in its level due to the scattered light problem discussed above. However, it is still of interest to have a measure of a galaxy’s fractional H luminosity; that is, how bright the H line is compared with the total continuum flux of the galaxy. We therefore computed the ratio of the H flux to the I-band continuum flux. In approximate terms, multiplying this ratio by the rest-frame width of the H line in our spectra (typically Å) yields a value comparable to a rest-frame equivalent width.
The detection limit in this survey is a strong function of wavelength, as the sky is much brighter at the blue and red ends of our spectral range than it is in the centre. In order to estimate a limit which corresponds as closely as possible to the manner in which we detected our lines, we repeatedly chose spectra at random from those in which we did not detect an emission line. To each spectrum we added a gaussian H emission line at a random redshift (but within our filter limits) and with a randomly selected flux. The two [Nii] lines were also added with random fluxes, with the (fairly arbitrary) additional restrictions that they each had less than 70% of the flux of the H line, and had fluxes within 10% of each other. This whole process was done 1000 times. One of us (M.L.B.) then tried to locate the H line in each of these spectra, with an effort to mimic the detection criteria for the real sample as closely as possible. We then determined the success rate in identifying these lines as a function of line flux and redshift; in particular, we identify the line flux at which our success rate was 50%, in four redshift bins. For objects with , the 50% detection limit is ergs s-1 cm-2; since the detection rate rises steeply with flux for these galaxies, we adopt this value as our flux limit. For galaxies with , the 50% limit is about a factor of two brighter, due to the presence of several bright sky lines.

4. Results
A total of 51 cluster members – 24 in the case(i) category and 27 in the case (ii) category – were found to be above our H flux limit, and we now confine our attention to their properties. As a percentage of the number of galaxies observed, these numbers are rather small; at most the H emitters make up only 9% (51/586) of our sample, with only 4% (24/586) being secure case (i) detections. Taking these results for a single cluster at face value, the low detection rate emphasises the need for spectroscopy with large multiplexing () in order to obtain samples of these objects of modest size.
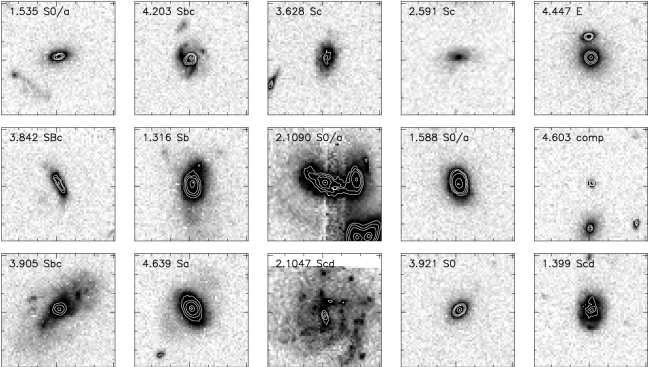
The number of cluster members detected in H and for which HST morphologies are available is also small: 15 fall within the C98 WFPC2 mosaic and of these, 10 (67%) were classified as spirals (1 Sa, 3 Sb, 6 Sc and later), 3 (20%) as S0’s or S0/a’s, 1 as an elliptical, and 1 a compact galaxy. The HST F702W images of a representative collection of these objects is shown in Fig. 4. While the majority are spiral galaxies, as we might expect, it is of note that H emission is not solely confined to these types with some of our detections being in the supposedly dormant S0 and E galaxies.
The incidence of H emission as a function of magnitude and radius from the centre of AC 114 is shown in the top two panels of Fig. 1. In both plots, the points connected by the solid lines show the incidence of both case (i) and case (ii) types, while the dotted line shows just the case (i) types. Note that in both cases the points have been corrected for the varying sampling rate of ‘cluster’ galaxies with magnitude and radius, having been divided by the corresponding cluster galaxy fraction as shown by the dotted line in the bottom two panels. In constructing Fig. 1(d), we have used radial bins of unequal size to ensure each point is based on approximately the same number of galaxies and hence has equal statistical weight.
We see in Fig. 1(c) a marginally higher detection rate at brighter magnitudes () than at fainter magnitudes, and given the way we have set our flux limit (see §3), this is likely to be real and not due to any increase in incompleteness with magnitude. In comparison, Fig. 1(d) is remarkable for how flat the H detection rate is with radius, with no gradient seen at all from the centre right out to Mpc 222Although we note that there are no H–emitting galaxies within the central 250 kpc – something which is obscured by the binning procedure used in Fig. 1(d). This can be contrasted with the morphological content of AC 114 observed by C98 over the central Mpc. In particular, they found the fraction of spiral galaxies to rise from 6 to % within the central Mpc and then remain approximately constant beyond that; this translates to spiral fractions of 45% and 50% within the two broad, innermost radial bins used in Fig. 1d (as shown by the 2 solid triangular points connected by the dot–dashed line). Clearly, then, there are many spirals members of AC 114 which have no significant H emission and thus ongoing star formation (SFRM⊙ yr-1); at radii of Mpc these make up of the order of two-thirds of AC 114’s spiral population! This lends further support to the conclusion of P99 that spiral-arm structure can persist in distant cluster spirals for a considerable time after star formation has ceased .
While we might expect the H detection rate to increase with radius, it is plausible that any underlying cluster-centric variation simply gets washed out in Fig. 1(d) due to AC 114’s elongated galaxy distribution. In Fig. 5(a), therefore, we plot the detection rate as a function of local projected galaxy density333Based on the circular area containing the 10 nearest neighbouring galaxies within our SExtractor catalogue, with a correction applied for field galaxy contamination., which will track galaxy ‘environment’ much more closely than radius. Once again we correct for the variation in the rate at which ‘cluster’ galaxies are sampled at different local densities. In this case we do see evidence of a trend, with the detection rate at the lowest densities being conspicuously (although, due to the large uncertainties, not that significantly) higher, and the rate in the highest density bin being marginally lower than that at intermediate densities. Hence we would conclude that there is a link between the incidence of H emission and ‘environment’ as measured in this way, although it is revealed only rather weakly here.
As a further check, we plot the H detection rate as a function of galaxy color; here colors have been measured from a pair of and AAT prime-focus images also taken for another program. As we might anticipate, we see a clear trend with the detection rate rising monotonically with decreasing (bluer) color. This is to be expected given that bluer galaxies are known to be more gas rich and active in star formation, but it is of note that our detection rate does not drop to zero for the reddest () galaxies, with % of these objects showing H emission. These could well be the known population of spiral galaxies whose colors are as red as the E/S0 population and which contribute to the red wing of the color distribution (Butcher & Oemler 1978b). Further insight into the distribution in color, as also luminosity, of the H-emitting population can be seen in Fig. 6 where a color-magnitude diagram of the galaxies observed in this study is shown with the H detections highlighted. This emphasises further the tendency of H emitters to be amongst the bluer galaxies, but to also be present amongst the redder galaxies, in particular those which populate the E/S0 color-magnitude sequence (seen as the sloped ridge-line that runs across the diagram). The figure also demonstrates that there is nothing peculiar about their luminosity distribution with respect to the population they were sampled from.
In addition to the incidence of H emission, its strength in galaxies at different locations within the cluster is also highly pertinent to understanding the mechanism(s) by which star formation is modulated in the cluster environment. The observed H fluxes, (H), have therefore been converted into luminosities and star formation rates (SFR) using the relations:
and
where the latter relation is taken from Kennicutt (1992). The quantity (H) is a factor which corrects for the extinction suffered at H; we have adopted here Kennicutt’s canonical value of 2.5. [The measured values of (H), (H), and SFR for those cluster members detected in H are included in a full listing of all the relevant data for the 586 unique galaxies observed in this study, to be made available as a machine-readable table in the on-line version of the paper. Other data included in this listing are: RA(J2000), Dec(J2000), , detection class and, where available, Hubble (and T-) type, and (H).]
The star formation rates calculated in this way are plotted as a function of local galaxy density in Fig. 7. The extent to which the star formation is suppressed in the cluster galaxies is striking with the bulk of the objects in Fig. 7 populating the bottom of the diagram (SFR’s in the range 0.5–1.0 M⊙ yr-1), accompanied by a sprinkling of objects above them but whose star formation rates do not exceed SFR M⊙ yr-1. Furthermore, we see little if any evidence for any gradient with projected galaxy density. It would appear, therefore, that local galaxy density does not have any detectable influence on cluster members’ star formation rate.
![[Uncaptioned image]](/html/astro-ph/0010505/assets/x5.png)
Fig. 5.– The H detection rate as a function of: (a) projected local galaxy density, and (b) color.
The upper bound to the star formation rates we see in AC 114 of SFR M⊙ yr-1 – which is about the same level as that observed in the Milky Way (Rana 1991) – contrasts quite dramatically with the levels of star formation seen in field galaxies at the same redshift (Tresse & Maddox 1998; hereafter TM), where many galaxies have rates in the 5–10 M⊙ yr-1 range, with some even higher than this. This can be seen more quantitatively in Fig. 8 where we compare AC 114’s H luminosity function derived from this work with that derived for field galaxies at by TM [based on the Canada-France Redshift Survey (CFRS) sample; Lilly et al. 1996]. Here the ‘field’ luminosity function has been normalised onto our vertical scale via consideration of TM’s detection rate over the same limits in apparent magnitude () and H luminosity [H] that applied to this study. The difference between the two luminosity functions is very stark: AC 114’s function is suppressed by an order of magnitude with respect to the field be it from the point of view of the numbers of objects at a given H luminosity or the H luminosities at which the numbers of objects are equal. Moreover, AC 114 is completely deficient of galaxies with erg s-1 and SFR M⊙ yr-1.
5. Discussion
The results of our analysis in the preceding section are quite unambiguous: the fraction of galaxies with on-going star formation in AC 114 is uniformly low (% at most) right out to Mpc from its centre, and where star formation is detected, the rates are highly suppressed with respect to those observed in the ‘field’ at the same redshift.
None of the galaxies detected in this study have the high star formation rates typically associated with ‘starburst’ galaxies. Of the 586 unique galaxies observed, we expect 380 to be cluster members; we can therefore determine that the fraction of starburst galaxies (with, say, star formation rates greater than 10 yr-1) in this cluster is less than 0.3% with 1 confidence (or 2.3% at 3). This may seem surprising in light of the large number of galaxies with apparently ‘post-starburst’ spectra discovered in some clusters (CS, C98 and Dressler et al. 1999). However, this is not at all a universal property, as there are clusters with very few post-starburst galaxies (Balogh et al. 1999), and the fraction of such galaxies in AC 114 is not tightly constrained: in combination, CS, Couch et al. (1994) and C98 find % of the observed galaxies in AC 114 have the blue colors, strong H lines and lack of [Oii] emission characteristic of post-starbursts. It is typically assumed that the lifetime of a starburst is about a factor of ten smaller than that of the post-starburst phase, in which strong Balmer lines persist for up to about 1 Gyr. Our results would then rule out a post-starburst fraction % with 1 confidence and % with 3 confidence. However, the bursts could conceivably be much shorter, with lifetimes of only a few 100 Myr, in which case the constraint becomes much weaker. Alternatively, Balogh & Morris (2000) find that the fractions of post-starburst galaxies (as determined from [Oii] and H measurements) are overestimated, because some of them show H emission; none of the three such galaxies in AC 114 are detected in H in the present work, however.
![[Uncaptioned image]](/html/astro-ph/0010505/assets/x6.png)
Fig. 6.– The distribution in the color-magnitude plane of our spectroscopic targets (open triangles); those plotted as filled triangles indicate our H detections. Targets whose membership of AC 114 had been confirmed by previous spectroscopy are circled.
Both P99 and Smail et al. (1999) have cautioned that a considerable amount of the star formation going on in distant cluster galaxies could be obscured by dust. Line equivalent widths will not be affected if the dust is distributed as a uniform screen; however, they will be reduced if the lines (produced in HII regions) are preferentially extincted, relative to the continuum (P99). Unfortunately, only three of the galaxies detected in our sample have measurements of [Oii]3727 emission. These three galaxies have EW([Oii])/EW(H + [Nii]) ratios of , and ; these ratios are not lower than the canonical value of 0.4 observed for the ‘normal’ nearby galaxy sample of Kennicutt (1992), as would be expected if dust obscuration was important. We cannot rule out the possibility that there exists a population of starburst galaxies in which the dust extinction is strong enough to reduce the H flux below our detection limit, though we note that it would take about 4 magnitudes of extinction (at Å) to obscure the H flux from a galaxy with a star formation rate of 10 yr-1 in this way.
![[Uncaptioned image]](/html/astro-ph/0010505/assets/x7.png)
Fig. 7.– The star formation rate inferred from the observed H flux plotted as a function of projected local galaxy density. The solid squares indicate the secure, case(i) detections while the open squares represent the less secure, case(ii) detections.
The general lack of ‘activity’ seen amongst galaxies observed in this study is perplexing, as we are probing this cluster out to large cluster-centric radii ( Mpc), where the chances of encountering recent arrivals to the cluster might be expected to be higher. As the data of TM would indicate (see Fig. 6), such objects should be conspicuous by their higher (on average) H luminosities and thus star formation rates. The fact that we do not see any sign of such a population suggests that either we have not gone out far enough, or AC 114 just happens to be a peculiar cluster in terms of its structure (we have already noted its highly elongated galaxy distribution), or perhaps both.
There has been recent theoretical work which suggests that the former could certainly be the case. The modelling of star formation gradients in distant clusters by Balogh et al. (2000) has shown that many of the galaxies even at 444 is the virial radius which we estimate to be Mpc for AC 114. have already passed through the cluster body one or more times, and therefore cannot be considered recent arrivals. A similar result is found in the semi-analytic models of Diaferio et al. (2000), where there is little gradient in the mean star formation rate of cluster galaxies out to ; beyond this radius it increases strongly, but does not reach the field value until beyond 2. Despite the relatively wide field, the present observations still do not reach the virial radius of AC 114; it will be important to obtain observations at even larger radii to map the star formation gradient further from the cluster, until it matches the field properties, as this will provide important constraints on models of cluster formation.
What is also very clear from the simulations is that the process of cluster growth is a highly dynamic one with the episodic merging of group and sub-cluster structures with the consequent mixing and ‘splashing’ of galaxies. This serves to further concentrate galaxies toward the centre of the cluster but at the same time fling a significant number back out to larger radii. While the simulations allow this behaviour to be followed with time and thus the time-averaged distribution of infallers and the associated gradients in star formation to be determined, the observations – such as those of AC 114 that we have obtained here – provide just a ‘snapshot’ of the cluster assembly process at these earlier epochs. While AC 114 clearly offers a view of a system where these dynamic processes have advanced sufficiently to create a massive, high density, virialised core (Smail et al. 1997, Natarajan et al. 1998), its pronounced elongation suggests its growth may still be some way from being complete. Moreover, a more complete observational picture will require many ‘snapshots’ covering the entire formation process; our observations of AC118 (a merging double mass component system) and AC103 (a poor and irregular single component system) which will be presented in forthcoming papers, will be important steps in this direction.
![[Uncaptioned image]](/html/astro-ph/0010505/assets/x8.png)
Fig. 8.– A comparison of the H luminosity function measured here for AC 114 with that of field galaxies at a similar redshift measured from the CFRS sample by Tresse & Maddox (1998). The corresponding star formation rate is shown on the horizontal axis at the top of the diagram.
6. Conclusions
In this paper we have presented H spectroscopy for 586 unique galaxies to over a Mpc field centred on the rich galaxy cluster AC 114 at . The major conclusions to be drawn from this survey of H emitting galaxies within this cluster can be summarised as follows:
-
•
The incidence of H emission in cluster galaxies is low with 4% of the galaxies surveyed here having highly secure detections and the total being no more than 9% if less secure detections are included.
-
•
The galaxies in which H emission is observed, have morphologies and colors that are largely consistent with them hosting star formation activity. From the small sub-sample of H emitters which have HST morphologies, the majority (67%) are found to be spirals predominantly of later type. H emission is preferentially found in bluer galaxies although we note that the detection rate does not drop to zero for the reddest galaxies in the cluster.
-
•
In the central, Mpc region of AC 114 where our HST imaging overlaps with this study, approximately two-thirds of the galaxies with spiral morphology were undetected in H. This provides further evidence that morphological and star-formation evolution in clusters, is largely decoupled.
-
•
Apart from the complete absence of H–emitting galaxies within a radius of 250 kpc from the centre of AC 114, the H detection rate shows no detectable radial variation out to Mpc. However, any radial trend will clearly be weakened by the highly elongated structure of this cluster. A weak anti-correlation between detection rate and local galaxy density is found, indicating that the incidence of star–forming cluster galaxies increases by roughly a factor of 2 in going from the highest ( gals Mpc-2) to the lowest ( gals Mpc-2) density regions probed within AC 114.
-
•
The rate of star formation inferred from the H luminosities measured for the detected galaxies is found to be uniformly low across the entire region of the cluster studied here. The maximum SFR observed is M⊙ yr-1, with the majority of galaxies having rates M⊙ yr-1. No discernible variation in SFR with ‘environment’ (as traced by local galaxy density) was found.
-
•
A comparison of the H luminosity function for galaxies in AC 114 with those in the field at a similar redshift shows the former to be highly suppressed. At the same H luminosity, AC 114’s luminosity function falls below that of the field by an order of magnitude. Furthermore, galaxies with luminosities erg s-1 (and hence a SFRM⊙ yr-1), are absent from the cluster environment.
References
- (1) Abadi, M. G., Moore, B., Bower, R. G., 1999, MNRAS, 308, 947
- (2) Balogh, M.L., Morris, S.L., Yee, H.K.C., Carlberg, R., & Ellingson, E. 1997, ApJ, 488, 75.
- (3) Balogh, M.L., Schade, D., Morris, S.L., Yee, H.K.C., Carlberg, R., & Ellingson, E. 1998, ApJ, 504, 75
- (4) Balogh, M.L., Morris, S.L., Yee, H.K.C., Carlberg, R.G., & Ellingson, E. 1999, ApJ, 527, 54
- (5) Barger, A., Aragon-Salamanca, A., Ellis, R., Couch, W., Smail, I., & Sharples, R. 1996, MNRAS, 279, 1
- (6) Bertin, E., & Arnouts, S. 1996, A&AS, 117, 393
- (7) Bower, R.G. 1991, MNRAS, 248, 332
- (8) Butcher, H., & Oemler, A. 1978a, ApJ, 219, 18
- (9) Butcher, H., & Oemler, A. 1978b, ApJ, 226, 559
- (10) Byrd, G., & Valtonen, M. 1990, ApJ, 350, 89
- (11) Couch, W.J., Ellis, R.S., Sharples, R.M., & Smail, I. 1994, ApJ, 430, 121
- (12) Couch, W.J., Barger, A., Smail, I., Ellis, R., & Sharples, R. 1998, ApJ, 497, 188 (C98)
- (13) Couch, W., & Sharples, R. 1987, MNRAS, 229, 423 (CS)
- (14) Diaferio, A., Kauffmann, G., Balogh, M.L., White, S.D.M., Schade, D., & Ellingson, E. 2000, astro-ph/0005485
- (15) Dressler, A. 1980, ApJ, 236, 351
- (16) Dressler, A., & Gunn, J.E. 1982, ApJ, 263, 533
- (17) Dressler, A., & Gunn, J.E. 1983, ApJ, 270, 7
- (18) Dressler, A., Oemler, A., Butcher, H., Gunn, J.E. 1994, ApJ, 430, 107
- (19) Dressler, A., Oemler, A., Couch, W.J., Smail, I., Ellis, R.S., Barger, A., Butcher, H., Poggianti, B., & Sharples, R.M. 1997, ApJ, 490, 577
- (20) Dressler, A., Smail, I., Poggianti, B., Butcher, H., Couch, W.J., Ellis, R.S., Oemler, A. 1999, ApJS, 122, 51
- (21) Glazebrook, K. 1998, Anglo-Australian Observatory Newsletter, No. 84, p9
- (22) Gunn, J.E., & Gott, J.R. 1972, ApJ, 176, 1
- (23) Kauffmann, G., 1996, MNRAS, 281, 487
- (24) Kennicutt, R. 1992, ApJS, 79, 255
- (25) Larson, R. B., Tinsley, B. M., & Caldwell, C. N. 1980, ApJ, 237, 692
- (26) Lavery, R.J. & Henry, J. P. 1988, ApJ, 330, 596
- (27) Lavery, R.J. & Henry, J. P. 1994, ApJ, 426, 524
- (28) Lilly, S.J., Le Fevre, O., Hammer, F., Crampton, D. 1996, ApJ, 460, L1.
- (29) Metcalfe, N., Shanks, T., Fong, R., & Roche, N. 1995, MNRAS, 273, 257
- (30) Moore, B., Katz, N., Lake, G., Dressler, A., & Oemler, A. 1996, Nature, 379, 613
- (31) Natarajan, P., Kneib, J.P., Smail, I., Ellis, R.S. 1998, ApJ, 499, 600
- (32) Poggianti, B., Smail, I., Dressler, A., Couch, W.J., Barger, A., Butcher, H., Ellis, R., Oemler, A., 1999, ApJ, 518, 576 (P99)
- (33) Poggianti & Wu, H., 2000, ApJ, 529, 157
- (34) Quilis V., Moore B., Bower R.G. 2000, Science, (in press)
- (35) Rana, N.C. 1991, Ann. Rev. Astr. & Astrophys., 29, 129
- (36) Smail, I., Morrison, G., Gray, M.E., Owen, F.N., Ivison, R.J., Kneib, J.P., Ellis, R.S. 1999, ApJ, 525, 609
- (37) Smail, I., Ellis, R.S., Fitchett, M.J., Norgaard-Nielsen, H.U., Hansen, L., Jorgensen, H.E. 1991, MNRAS, 252, 19
- (38) Smail, I., Dressler, A., Couch, W., Ellis, R., Oemler, A., Butcher, H., & Sharples, R. 1997, ApJS, 110, 213
- (39) Terlevich, A. 1999, PhD thesis, University of Durham
- (40) Tresse, L. & Maddox, S. 1998, ApJ, 495, 691 (TM)
- (41) Yee, H.K.C., Ellingson, R., & Carlberg, R.G. 1996, ApJS, 102, 269
- (42)