Starburst activity in a ROSAT Narrow Emission-Line Galaxy
Abstract
We present multiwaveband photometric and optical spectropolarimetric observations of the narrow emission line galaxy R117_A which lies on the edge of the error circle of the ROSAT X-ray source R117 (from [McHardy et al.]). The overall spectral energy distribution of the galaxy is well modelled by a combination of a normal spiral galaxy and a moderate-strength burst of star formation. The far infra-red and radio emission is extended along the major axis of the galaxy, indicating an extended starburst.
On positional grounds, the galaxy is a good candidate for the identification of R117 and the observed X-ray flux is very close to what would be expected from a starburst of the observed far infra-red and radio fluxes. Although an obscured high redshift QSO cannot be entirely ruled out as contributing some fraction of the X-ray flux, we find no candidates to within the X-ray errorbox and so conclude that R117_A is responsible for a large fraction, if not all, of the X-ray emission from R117.
Searches for indicators of an obscured AGN in R117_A have so far proven negative; deep spectropolarimetric observations show no signs of broad lines to a limit of one per cent and, for the observed far infra-red and radio emission, we would expect a ten times greater X-ray flux if the overall emission were powered by an AGN. We therefore conclude that the X-ray emission from R117 is dominated by starburst emission from the galaxy R117_A.
keywords:
X-rays: galaxies – galaxies: starburst1 Introduction
Despite extensive investigation, there remains much uncertainty regarding the origin of the X-ray emission from narrow emission line galaxies (NELGs) found in deep X-ray surveys ([Boyle et al.]; [McHardy et al.]; [Schmidt et al.]; [Roche et al.] 1995, 1996). There are several possible emission mechanisms, where the two most plausible are starburst activity or the presence of an active galactic nucleus (AGN). A burst of intense star-forming activity creates large numbers of hot OB stars, which are strong X-ray emitters, and such galaxies have been proposed as a significant contributor to the X-ray Background (XRB) Radiation (e.g. [Griffiths & Padovani]). It is also generally agreed that obscured AGN can account for the majority of the energy in the XRB (Madau, Ghisellini & Fabian 1994; [Comastri et al.]). AGN have intrinsically soft spectra, but photo-electric absorption by gas surrounding the AGN has the effect of preferentially removing lower energy photons, thereby hardening the observed spectra to agree with the spectrum of the XRB.
Results from deep ROSAT X-ray surveys show that the number of X-ray sources at faint fluxes continues to rise faster than the contribution from QSOs and clusters ([Georgantopoulos et al.]; [McHardy et al.]). Through accurate positions from the ROSAT HRI [Hasinger et al.], many of these faint X-ray sources appear to be unambiguously identified with galaxies showing narrow emission lines in their optical spectra. It is difficult to determine the dominant power source from the usual line ratio diagnostics [Osterbrock] since many of these objects lie on the border between AGN and starburst, and it is also likely that the two phenomena may coexist in some objects ([Iwasawa et al.]; [McHardy et al.]).
Here we present multiwavelength imaging and photometry of R117, a ROSAT source from the UK Deep Survey of [McHardy et al.] (1998), identified with a NELG at . These observations include spectropolarimetry, to search for broad emission lines in polarized light as a sign of AGN activity. In addition, submillimetre (sub-mm) photometry aims to detect thermal emission from dust associated with the source of the X-ray flux, whether due to starburst activity within the galaxy or the presence of an obscured AGN. The available data point towards a pure starburst origin to the soft X-ray emission in R117, which implies that star-forming galaxies may make a significant contribution to the soft X-ray background radiation.
2 Observations
| Band | Wavelength | Frequency | Flux density | Telescope/ | Notes |
|---|---|---|---|---|---|
| () | (Hz) | () | Instrument | ||
| ROSAT/PSPC | (0.5-2 keV)=(2.810.70) | ||||
| INT/WFC | |||||
| CFHT | |||||
| UH88 | ∗ | ||||
| UKIRT/UFTI | |||||
| IRAS | estimated from FSC sources nearby | ||||
| ISO/CAM | adu ( error in mJy/adu conversion) | ||||
| IRAS | estimated from FSC sources nearby | ||||
| IRAS | SCANPI measurement† | ||||
| ISO/PHOT | includes calibration errors | ||||
| IRAS | SCANPI measurement† | ||||
| JCMT/SCUBA | upper limit | ||||
| JCMT/SCUBA | |||||
| VLA | |||||
| VLA |
In this Section, we present the multiwavelength data obtained for the ROSAT source, R117, and the proposed optical counterpart. Each of the observations of R117 is described in turn, from the X-ray through to radio wavelengths, and the measurements are summarized in Table LABEL:tab:data. We take and throughout.
2.1 X-ray Data
ROSAT X-ray source 117, henceforth known as R117, was detected in the UK ROSAT Deep Survey [McHardy et al.]. The UK ROSAT Deep Survey consists of PSPC observations totalling at the position (J2000), which lies in a region of low Galactic absorption, . A complete sample of 70 X-ray sources is defined above a flux limit of . R117 is one of the fainter sources in the sample, with a flux of , so the measurement of its X-ray spectrum is not possible. R117 is not detected in the soft () band, putting a limit on its hardness ratio, i.e., the ratio of counts in the band to those in the band, of . This value of the hardness ratio would correspond to an unabsorbed power-law of energy spectral index (c.f. table 6 in [McHardy et al.]), where .
2.2 Selection of the Optical Counterpart
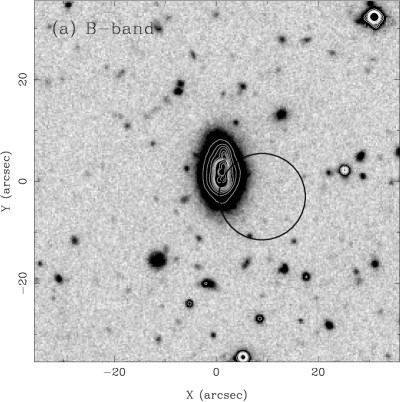
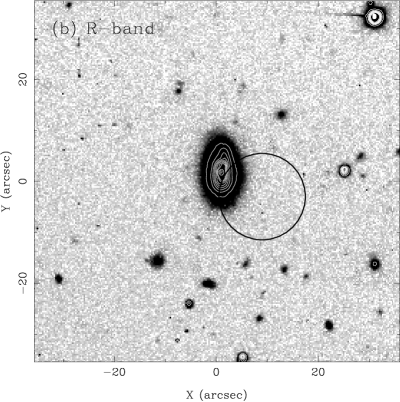
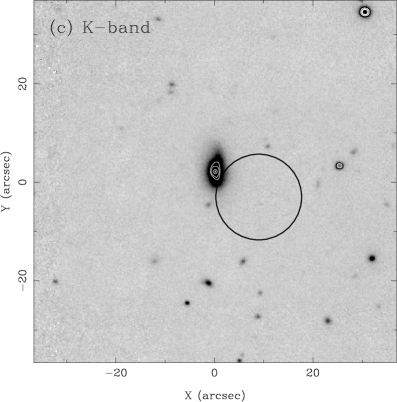

The potential counterparts to the X-ray sources in the UK ROSAT Deep Survey are found from deep optical CCD images. In Fig. 1(a-c), we present the available digital imaging data for R117, in the optical and near infra-red.
Our simulations show that, for an X-ray source with the flux of R117, the 95 per cent error-radius is arcsec (fig. 4 of [McHardy et al.]). We therefore overlay the 10 arcsec X-ray circle on each of these three images, from which it can clearly be seen that the most obvious optical counterpart to the X-ray source is a bright galaxy ( J2000) which lies only 11.9 arcsec from the PSPC X-ray centroid ( J2000). This galaxy, referred to here as R117_A, is therefore positionally a reasonable candidate. We should however consider the possibility of a galaxy of that magnitude () occurring at that position by chance. The surface density of galaxies of is 0.017 per square arcmin [Jones et al.]. There are 30 errorboxes in [McHardy et al.] which do not have an unambiguous identification with a QSO, a cluster of galaxies or a star. For an assumed average errorbox radius of 10 arcsec, we therefore expect 0.04 random occurences with galaxies of . If we take a rather pessimistic average errorbox radius of 15 arcsec, then we double the number of expected chance coincidences, giving a 0.3 per cent probability of such a galaxy being in the R117 errorbox by chance. Of course, if we consider only starburst galaxies, then this probability is reduced still further.
In view of the claim by [Lehmann et al.] (2000) that all of the low luminosity NELGs in the UK Deep Survey are chance coincidences, we must consider carefully the likelihood that this galaxy is the correct identification. The possibility of an alternative optical counterpart for the X-ray emission is discussed fully in Section 4.5. However, for the remainder of Section 2 and the whole of Section 3 we proceed on the assumption that the bright galaxy, R117_A, is the correct counterpart.
2.3 Optical and near infra-red photometry
From the images in Fig. 1, we obtain total galaxy magnitudes for R117_A of , and . Additional – band photometry, , gives , which is more typical of a spiral than an elliptical galaxy. A distance modulus of gives an absolute magnitude of . The surface brightness profile of the – band image is well fit by an exponential disc, as expected for a spiral galaxy, and has a scale length of arcsec or at the redshift of the galaxy. The central surface brightness of the galaxy is . Careful visual examination of the – band image indicates the probable presence of faint spiral structure, although it is very hard to reproduce such displays on hard copy. However, in the contours of the – band image, there is an indication of some linear structure, possibly indicating a central bar.
2.4 Optical Spectroscopy
An optical spectrum of R117_A was taken using the ISIS dual-beam spectrograph on the WHT, and is presented in fig. 13 of [McHardy et al.] (1998). The spectrum shows narrow Balmer emission lines, with FWHM , plus the forbidden lines, [O ii], [N ii] and [S ii]. From this, a NELG identification for R117 is obtained, at a redshift of .
In order to determine the X-ray emission mechanism for R117, [McHardy et al.] plotted the standard diagnostic line ratios of [O iii]/ against [N ii]/, and [O iii]/ against [S ii]/ [Veilleux & Osterbrock], which can be used as a discriminant between starburst galaxies and AGN. Although the [O iii] line in R117_A can just be detected, the dichroic at has attenuated the [O iii] emission, assuming a standard ratio of 3:1 for :. R117_A lies close to the boundary between the two emission mechanisms, in the starburst domain, and the uncertainty on the strength of the [O iii] line would have the effect of moving the galaxy more firmly into this region.
2.5 Optical Spectropolarimetry

Spectropolarimetric observations of a sample of NELGs were taken on the nights of 1999 June 5-10, using the blue arm of the ISIS spectrograph on the WHT (Almaini et al. in preparation). In Fig. 2, we present the spectropolarimetric observations of R117_A. The spectrum was calibrated using observations of both polarized and unpolarized standard stars. Although a very high spectrum was obtained, and polarization of the continuum was detected, there was no evidence of polarized broad emission lines, to a limit of less than one per cent. This argues against an AGN origin for the source of the X-ray emission, but cannot rule it out completely, as any scattering region may also be obscured [Young et al.].
From Serkowski, Mathewson & Ford (1975), the maximum contribution to the detected continuum polarization from dust in our own Galaxy is given by . The line of sight extinction for R117_A is , which limits the Galactic contribution to per cent. This therefore implies that the detected polarization is intrinsic to R117_A. ‘Normal’ galaxies tend to have continuum polarization at a level of per cent, whereas aligned dust grains in starburst galaxies can cause a higher level, of the order of the 1-2 per cent continuum polarization observed in R117_A (see e.g. [Brindle et al.]). The position angle of the magnetic field vector is at , which is roughly aligned with the major axis of the galaxy, consistent with the presence of a dust lane or bar.
2.6 Far Infra-red Data
The UK Deep ROSAT field was observed by ISO as part of the European Large Area ISO Survey (ELAIS; [Oliver et al.]). Approximately two-thirds of the ROSAT field-of-view was covered by ISO, within which 8 ISO sources were detected at . Of these 8 ISO sources, 3 are coincident with ROSAT X-ray sources, and are identified as 2 stars and 1 galaxy, R117_A.
R117_A is the optically brightest X-ray NELG in the ISO-ROSAT overlap region, and was detected as an ISO source at with a count rate of using 20 arcsec radius aperture photometry. This gives a flux of , where the error is mainly due to uncertainty in the conversion between adu and (see [Serjeant et al.]). The ISO image appears extended in the N-S direction, consistent with the structure seen in the radio data (see Section 2.8). At , R117_A is detected and flux calibrated with the pipeline described in [Efstathiou et al.] (2000a), with .
2.7 Sub-millimetre Data
R117 was observed at sub-mm wavelengths as part of a program to investigate the sub-mm properties of X-ray selected galaxies and QSOs (Gunn et al. in preparation). On the night of 1999 May 28, the Sub-millimetre Common User Bolometer Array (SCUBA; [Holland et al.]) on the JCMT was used in the standard photometry mode to make simultaneous and observations. The secondary mirror was chopped using a 9 point jiggle pattern, nodding between the signal and reference beams every . The data were corrected for the atmospheric opacity, which was in the range during the observation of R117, and calibrated against Mars. R117 was detected at with a flux of , whereas at we obtain a upper limit of .
2.8 Radio Data
Fig.1(d) shows the VLA A-array map of R117 at (). The A-array data consists of 25 hours of observations from 1999 August 2, 6 and 7, and were made in 4 IF multi-channel continuum mode. The map shown in Fig.1(d) is the result of an initial reduction and residual large scale stripes are still visible going from north-east to south-west across the map. However, well-resolved emission is still easily visible, coincident with the galaxy. Interestingly, the spiral structure, which can be discerned with some difficulty on the optical image, shows up clearly and in the same location on the radio image. The total flux density of the galaxy is .
Observations at made in full continuum mode with the VLA on 1991 April 26, reveal a flux of . These observations indicate a steep () spectral index, implying a starburst origin for the radio emission.
3 Modelling of the SED
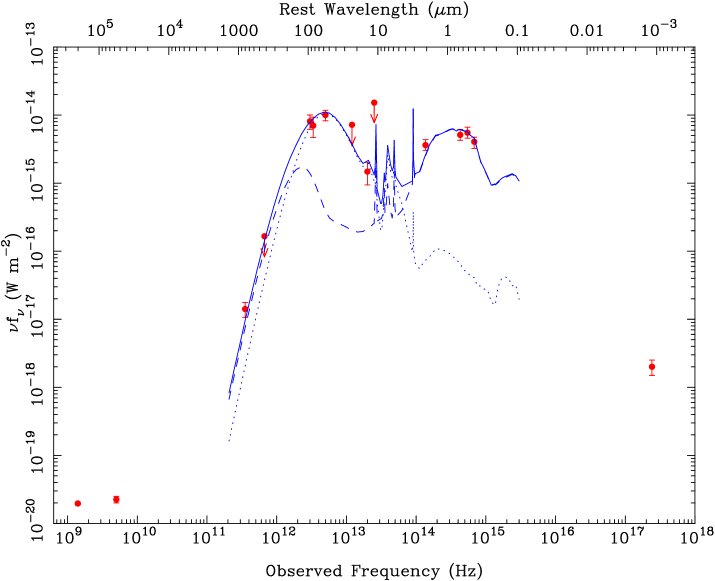
In Fig. 3, we combine the data described in Section 2 to create the spectral energy distribution of R117, assuming that the bright optical galaxy, R117_A, is the true counterpart to the X-ray source. By plotting as a function of frequency, we see that the bulk of the emission emerges in two peaks, one in the far infra-red and the other in the optical, with the far infra-red peak dominating slightly. The data for R117 (filled circles) can be fit by the sum (solid line) of two components. The bulk of the FIR emission comes from an exponentially decaying old burst of star-formation, with an e-folding time of (dotted line). The optical light is most likely to be dominated by an older stellar population, with associated dust, and this cirrus component (dashed line) contributes about half of the sub-mm flux. For full details of the models used, see Efstathiou, Rowan-Robinson & Siebenmorgen (2000b). This model gives a bolometric luminosity of .
4 Discussion
So far we have assumed that the bright galaxy, R117_A, is the true counterpart of the X-ray source R117. In this Section, we now investigate whether the multiwavelength properties of R117 are consistent with a NELG origin for the X-ray emission, either due to starburst or AGN activity, or whether we can rule out the optical counterpart in this way. We then go on to discuss in detail the possibilities for alternative sources for the X-ray emission, using the optical and near infra-red imaging data.
4.1 X-ray/FIR properties

The combined X-ray and FIR properties of both active and normal galaxies have been studied by Green, Anderson & Ward (1992), who chose a large sample of galaxies from the literature for which both IRAS fluxes and Einstein fluxes had been measured. In this sample, they observe a distinct bi-modal distribution in the ratio of X-ray to FIR luminosities, with broad and narrow line galaxies appearing to be distinct populations. Galaxies with a ratio are found to almost always have broad emission lines.
To find this ratio for R117, we estimate the luminosity from the ROSAT luminosity, by assuming a power-law slope of , typical of NELGs ([Romero-Colmenero et al.]; [Almaini et al.]), which gives (c.f for ). To calculate the FIR luminosity, i.e., the luminosity in the IRAS (restframe) band, we use the relationship from Green et al. (1992), which uses the flux density at , , and the spectral slope between and , . For R117, we take the IRAS flux density, , and we use the and fluxes to estimate , as being the most reliable measurements. This gives a value of , compared with that measured for emission line galaxies of , spirals/irregulars of , and QSOs of . In this way, we find for R117, .
The X-ray to FIR luminosity ratio for R117, , places R117 firmly in the domain of narrow emission line galaxies, as expected from the optical data. Green et al. include all types of narrow-line galaxies in this class, including Seyfert 2s, and therefore this method cannot be used as a discriminant between an AGN and starburst origin for the X-ray and FIR emission. However, such a correlation between the and is to be expected, given a common stellar origin for both components.
David, Jones & Forman (1992) look for X-ray emission, detected by Einstein, associated with galaxies in the IRAS Bright Galaxy Sample. In Fig. 4, we reproduce their fig. 2, including the best-fit to relationship, which takes account of both detections and upper limits. They find that the X-ray luminosities of the Seyfert galaxies in the sample are approximately ten times more X-ray luminous than normal or starburst galaxies with the same FIR luminosity.
The X-ray/FIR relationship for R117 is also very similar to the spiral galaxies studied by Read, Ponman & Strickland (1997), where the diffuse fraction of the X-ray emission is of order per cent, and is more typical of a normal starburst galaxy than a merger [Read & Ponman]. Since both the ISO and radio emission are extended, we take this as evidence for the presence of an extended starburst in R117_A. We therefore propose that at least per cent of the X-ray emission is associated with the starburst, but note that we cannot rule out some contribution from an obscured AGN at a level of per cent.
4.2 Sub-mm spectral index
By measuring the apparent spectral index below the peak of the thermal emission, an indication of the opacity of the dust can be obtained. Since a pure black-body satisfies the Rayleigh-Jeans law for , the flux density obeys the relationship . For optically thin dust, the spectrum is much steeper, and , where usually (see e.g. [Cimatti et al.]). Using the SCUBA flux and upper limit, we calculate that for R117, implying that the dust here is almost optically thick. However, the presence of dust at a range of temperatures will have the effect of lowering the measured value of , which may be the case here.
4.3 Radio/FIR properties
Following the method of [Carilli & Yun] (1999), we can use the radio to sub-mm flux ratio of R117 as a diagnostic of the emission mechanism of the low frequency radiation in this galaxy. In their paper, [Carilli & Yun] state that for a starburst galaxy, both the radio emission (1.4 GHz) and sub-mm emission () are directly proportional to the total star-formation rate, and therefore that their ratio, , will be constant in the source frame. However, since the spectral shape changes slope between these two regimes (e.g. see Fig. 3), then the observed spectral index:
will evolve with redshift due to the -correction effect. For a source of unknown redshift, measurement of can then be used to place limits on the redshift. Conversely, if the redshift is known, then any dominant emission component from something other than star-formation, i.e., the presence of an AGN, will serve to move the galaxy away from the predicted position in the vs redshift plane.
R117 has flux densities of and , which gives . Knowing that this galaxy lies at a redshift of , we compare the value of with the predicted values, and find that R117 is totally consistent with a starburst galaxy at this redshift. In this scenario, the observed flux is due to synchrotron emission from supernova remnants associated with the starburst [Condon].
We cannot rule out the presence of an AGN with this method, but can infer that any AGN component will not be the dominant emission mechanism at these wavelengths.
4.4 Comparison with other galaxies

In Fig. 5, we compare the model fit to the spectral energy distribution (SED) of R117 with the SEDs of a ‘normal’ galaxy, and those of infra-red luminous galaxies at both low and high redshift.
When the SED of the typical ‘normal’ spiral galaxy, NGC 4414 [Braine & Hughes], is normalized to the optical flux of R117, we find that the FIR flux of R117 is a factor of five times higher than that of NGC 4414, implying considerably more star-formation activity in R117. However, as seen in Fig. 5, R117 is not as strongly star-forming as extreme examples of starburst galaxies such as M82, implying an intermediate star-formation rate, between those of M82 and NGC 4414. Arp 220, the dusty AGN F10214+4724, the extremely red object HR10, and M82, would all be underluminous in the optical for the same FIR luminosity as R117.
Fig. 5 also shows that R117 has a similar SED to the sub-mm selected high redshift galaxy, SMM J02399-0136 [Ivison et al.], which is interesting as this galaxy is not only strongly star-forming, but also contains an active nucleus. However, the SED of SMM J02399-0136 is not strongly defined in the mid infra-red part of the spectrum.
4.5 Alternative optical counterparts
Although in Section 2.2 we have shown on statistical grounds that the probability of the galaxy R117_A being a chance identification is low, we nonetheless examine the optical, infra-red and radio images of the PSPC X-ray error circle for any indication of a likely alternative identification. Examination of Fig. 1 shows that no objects of unusual colour lie in or very close to the errorbox. Neither are there any bright objects in or near the errorbox.
The nearest bright object is a stellar object 20 arcsec from the X-ray centroid to the west, R117_B, which is visible on the , and images. Recent spectroscopy has identified R117_B to be an M-star, with a magnitude of . M-stars often show coronal X-ray emission and for the typical X-ray/optical ratios found by [Stocke et al.] (1991), such an M-star could be a noticeable contributor to the total X-ray flux of R117. Its location, far from the X-ray centroid, rules out the M-star as being the major contributor but is very consistent with it contributing enough flux to pull the X-ray centroid a little away from R117_A.
The two faint objects seen on the edge of the error circle in the – band image have and . Even if identified as unobscured QSOs, such faint objects would be unlikely to account for more than a small fraction of the X-ray flux of R117 (see fig. 9, [McHardy et al.]).

The deep UKIRT/UFTI image (4050s) shows no evidence for any faint objects closer to the X-ray centroid than R117_A to a 5 limit of . This limit is fainter that the magnitudes of any obscured QSOs found so far in ROSAT surveys [Lehmann et al.], and so argues against a large contribution to the X-ray flux of R117 from such a QSO. However it is never possible to completely exclude an absorbed QSO from any X-ray errorbox, including from HRI errorboxes already containing bright QSOs, and so we consider which regions of parameter space are allowable for an obscured QSO. Fig. 6 shows the region of parameter space allowed by these observations. The hatched region excludes objects which would be too bright in for the observed ROSAT flux, i.e., . The cross-hatched region excludes objects with , which would not have been detected by ROSAT, even if at high redshift. The solid lines show the position in the vs plane of QSOs with unabsorbed luminosities of for which the received ROSAT flux is as detected for R117.
We can therefore see that the only allowed luminosity range for an absorbed QSO is between few and . As discussed above, such a QSO cannot be ruled out from almost any X-ray errorbox but, by Occam’s razor, the bright galaxy R117_A is a much more likely identification. If an obscured QSO, with carefully tuned redshift and absorption, did contribute to the X-ray flux from R117, we would have to explain why the X-ray flux from R117_A was less than that from other similar starburst galaxies.
5 Conclusions
Here we have presented a multiwavelength study of the properties of the ROSAT X-ray source R117, from the radio to the X-ray. Having ascertained that the galaxy, R117_A, is the most likely source of the X-ray emission, we have used a variety of techniques in order to determine the dominant process behind this activity. The SED of the galaxy is well modelled by a spiral galaxy with a moderate burst of star-formation. Optical photometry and morphology are consistent with R117_A being a spiral galaxy, with a central bar structure or nuclear star-forming region. This galaxy counterpart to the X-ray source is highly plausible on positional grounds, and in the absence of any strong alternatives. The ratios between the X-ray, FIR and radio fluxes are consistent with this emission being due to a starburst, as if an AGN were the dominant source of the power in this object, the X-ray flux would be ten times larger. Spectropolarimetric observations of R117_A place strong limits on the presence of any broad components to the optical emission lines which would be expected from AGN activity. The starburst nature of R117 is also consistent with both the detection of weak radio emission and the radio-to-submm spectral index. From the multiwavelength photometric data, combined with the lack of any broad emission line component in polarized light, we therefore conclude that starburst activity is the dominant source of the soft X-ray flux detected by ROSAT from the galaxy R117.
The broader implications of these observations concern the identification and classification of X-ray sources found in deep X-ray surveys. In particular, galaxy identifications have been criticised as being misidentifications in ROSAT X-ray surveys and it has been claimed that there is no starburst contribution to deep X-ray surveys (e.g. [Lehmann et al.]). Here we show that, in at least one case, a starburst galaxy is by far the most likely identification of a faint ROSAT X-ray source. We also note that [Fiore et al.] (2000) find one definite starburst galaxy in a sample of a dozen Chandra sources. Although we agree with the hypothesis that obscured AGN are probably major contributors to the XRB, and that high luminosity NELGs are probably mostly powered by an AGN, we conclude that low luminosity X-ray emission from starburst galaxies cannot be entirely neglected as contributing to the X-ray background, particularly at softer energies.
Acknowledgments
We would like to thank the staff of the WHT, CFHT, UH 88-in, UKIRT, JCMT and VLA telescopes and their observatories for their help in obtaining the data on R117, and in particular, the UKIRT Service Program for their prompt observation of R117. We thank Harry Lehto for assistance with the VLA observations, Rob Ivison for the SED datapoints of M82, etc., and Mat Page for useful discussions. KFG and IMH thank PPARC for support. This paper was prepared using the Southampton STARLINK node facilities.
References
- Almaini et al. Almaini O., Shanks T., Boyle B. J., Griffiths R. E., Roche N., Stewart G. C., Georgantopoulos I., 1996, MNRAS, 282, 295
- Boyle et al. Boyle B. J., McMahon R. G., Wilkes B. J., Elvis M., 1995, MNRAS, 272, 462
- Braine & Hughes Braine J., Hughes D. H., 1999, A&A, 344, 779
- Brindle et al. Brindle C., Hough J. H., Bailey J. A., Axon D. J., Sparks W. B., 1991, MNRAS, 252, 288
- Carilli & Yun Carilli C. L., Yun M. S., 1999, ApJL, 513, L13
- Cimatti et al. Cimatti A., Bianchi S., Ferrara A., Giovanardi C., 1997, MNRAS, 290, L43
- Comastri et al. Comastri A., Setti G., Zamorani G., Hasinger G., 1995, A&A, 296, 1
- Condon Condon J. J., 1992, ARA&A, 30, 575
- David, Jones, & Forman David L. P., Jones C., Forman W., 1992, ApJ, 388, 82
- Efstathiou et al. Efstathiou A. et al., 2000a, MNRAS in press (astro-ph/0008065)
- Efstathiou, Rowan-Robinson, & Siebenmorgen Efstathiou A., Rowan-Robinson M., Siebenmorgen R., 2000b, MNRAS, 313, 734
- Fiore et al. Fiore F. et al., 2000, New Astronomy, 5, 143
- Georgantopoulos et al. Georgantopoulos I., Stewart G. C., Shanks T., Boyle B. J., Griffiths R. E., 1996, MNRAS, 280, 276
- Green, Anderson, & Ward Green P. J., Anderson S. F., Ward M. J., 1992, MNRAS, 254, 30
- Griffiths & Padovani Griffiths R. E., Padovani P., 1990, ApJ, 360, 483
- Hasinger et al. Hasinger G., Burg R., Giacconi R., Schmidt M., Trümper J., Zamorani G., 1998, A&A, 329, 482
- Holland et al. Holland W. S. et al., 1999, MNRAS, 303, 659
- Ivison et al. Ivison R. J., Smail I., Le Borgne J. F., Blain A. W., Kneib J. P., Bezecourt J., Kerr T. H., Davies J. K., 1998, MNRAS, 298, 583
- Iwasawa et al. Iwasawa K., Fabian A. C., Brandt W. N., Crawford C. S., Almaini O., 1997, MNRAS, 291, L17
- Jones et al. Jones L. R., Fong R., Shanks T., Ellis R. S., Peterson B. A., 1991, MNRAS, 249, 481
- Lehmann et al. Lehmann I. et al., 2000, A&A, 354, 35
- Madau, Ghisellini, & Fabian Madau P., Ghisellini G., Fabian A., 1994, MNRAS, 270, L17
- McHardy et al. McHardy I. M. et al., 1998, MNRAS, 295, 641
- Oliver et al. Oliver S. et al., 2000, MNRAS, 316, 749
- Osterbrock Osterbrock D. E., 1989, Astrophysics of gaseous nebulae and active galactic nuclei. University Science Books, University of Minnesota, Mill Valley, CA.
- Read & Ponman Read A. M., Ponman T. J., 1998, MNRAS, 297, 143
- Read, Ponman, & Strickland Read A. M., Ponman T. J., Strickland D. K., 1997, MNRAS, 286, 626
- Roche et al. Roche N., Griffiths R. E., Della Ceca R., Shanks T., Boyle B. J., Georgantopoulos I., Stewart G. C., 1996, MNRAS, 282, 820
- Roche et al. Roche N., Shanks T., Georgantopoulos I., Stewart G. C., Boyle B. J., Griffiths R. E., 1995, MNRAS, 273, L15
- Romero-Colmenero et al. Romero-Colmenero E., Branduardi-Raymont G., Carrera F. J., Jones L. R., Mason K. O., McHardy I. M., Mittaz J. P. D., 1996, MNRAS, 282, 94
- Schmidt et al. Schmidt M. et al., 1998, A&A, 329, 495
- Serjeant et al. Serjeant S. et al., 2000, MNRAS, 316, 768
- Serkowski, Mathewson, & Ford Serkowski K., Mathewson D. L., Ford V. L., 1975, ApJ, 196, 261
- Stocke et al. Stocke J. T., Morris S. L., Gioia I. M., Maccacaro T., Schild R., Wolter A., Fleming T. A., Henry J. P., 1991, ApJS, 76, 813
- Veilleux & Osterbrock Veilleux S., Osterbrock D. E., 1987, ApJS, 63, 295
- Young et al. Young S., Hough J. H., Efstathiou A., Wills B. J., Bailey J. A., Ward M. J., Axon D. J., 1996, MNRAS, 281, 1206