FUSE Observations of the Hottest DA White Dwarfs
Abstract
We report early FUSE observations of the very hot DA white dwarfs PG1342+444 and REJ0558371. Detection of photospheric absorption lines allows us to estimate the abundances of C, O, Si, P, S and Fe, the first measurements reported for DA stars at such high temperatures. Values of and log g determined for PG1342+444 from the Lyman line series disagree with the results of the standard Balmer line analysis, an issue that requires further investigation.
Department of Physics and Astronomy, University of Leicester, University Road, Leicester LE1 7RH, UK
Lunar and Planetary Laboratory, University of Arizona, Tucson, AZ 85721, USA
Laboratory for Astronomy and Solar Physics, NASA/GSFC, Greenbelt, Maryland, MD 20711 USA
1. Introduction
Very few true white dwarfs are known to have effective temperatures above K and, therefore, the proposed direct evolutionary link between H-rich CSPN and white dwarfs has hardly been explored. The discovery of several very hot DA white dwarfs with temperatures in excess of 70000K (e.g. REJ1738+665 - 90000K, Barstow et al. 1994; EGB1 - 100000K, Napiwotzki & Schönberner 1993; WDHS1 - 100000 to 160000K, Liebert, Bergeron & Tweedy 1994), through various observational programmes, provides an opportunity to study this upper range of the DA cooling sequence.
While Balmer line analyses (including the effect of metals) provide important measurements of the DA temperature scale, there remains a serious problem in their use to study the hottest DA stars. At effective temperatures in excess of K, the photospheric hydrogen is almost completely ionized. Hence, the populations of the levels involved in the Balmer line transitions are severely depleted and the observed line strengths extremely weak. As a result, at high temperatures, the values of become increasingly poorly determined. The use of the Lyman series lines has provided an additional tool to determine and log g but only a limited number of observations have been available from the ORFEUS and Hopkins Ultraviolet Telescope (HUT) missions (e.g. Dupuis et al. 1998; Finley et al. 1997).
The availability of the Far Ultraviolet Spectroscopic Explorer (FUSE), covering the Å wavelength range, presents us with an opportunity of obtaining many more Lyman series spectra for white dwarfs. We present FUSE observations of the very hot DA white dwarfs PG1342+444 and REJ0558376, comparing the Balmer and Lyman series measurements of . An important result is the first detection of photospheric OVI lines in the atmosphere of a DA white dwarf.
2. Far UV spectroscopy with FUSE
2.1. Observations and data reduction
The FUSE mission was placed in low Earth orbit on 1999 June 24. After several months of in-orbit checkout and calibration activities, science observations began during 1999 December. An overview of the FUSE mission has been given by Moos et al. (2000) and the spectrograph performance is described in detail by Sahnow et al. (2000). Further useful information is included in the FUSE Observer’s Guide (Oegerle et al. 1998) which can be found on the FUSE website (http://fuse.pha.jhu.edu) along with other technical documentation.
Several problems have been encountered during early in-orbit operations of the FUSE satellite which need to be taken account of in the data reduction process. Maintaining the coalignment of the individual spectral channels has been difficult, probably due to thermal effects. Sometimes, a target may completely miss the aperture of one or more channels, while being well-centred in the others. In addition, even if the channels are well-aligned at the beginning of an observation, the target may subquently drift out of any of the apertures. There are also several effects associated with the detectors and electronics, including deadspots and fixed-pattern efficiency variations. Potentially, these can lead to spurious absorption features in the processed data if they cut the dispersed spectrum at any point.
The FUSE observations of PG 1342+444 and RE J0558376 were obtained during 2000 January 11/12 and 1999 December 10 respectively. Inspection of the combined FUSE spectra of each star shows the expected flux levels but reveals some discontinuities in the flux matching particular channel wavelength ranges. This indicates that in some channels the actual exposure time achieved does not match the nominal value, possibly arising from the source drifting out of the science aperture. Consequently, we examined each individual extracted and calibrated spectrum and developed our own approach to combining the various exposures and channels based on an assessment of the data quality. Since, the nominal wavelength binning (Å) oversamples the true resolution by a factor of 2-3, all the spectra were re-binned to 0.02Å pixels for analysis. Barstow et al. (2000, in preparation) describe our procedure in much more detail.
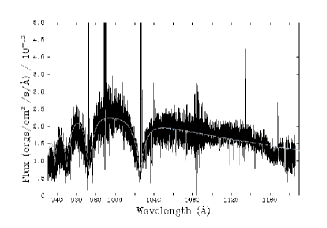
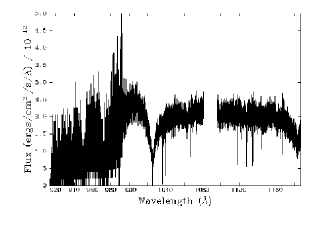
Figure 1 shows the final merged spectra constructed from the best exposures in each spectral channel. A broad dip in the region above Å can be seen in each case, caused by a region of low instrumental efficiency known as the “worm” and which is not currently taken into account in the flux calibration. The short wavelength region (SiC channel) of the RE J0558276 spectrum, below 990Å, is considerably noisier than the longer wavelength (LiF channel) data due to periods when the source drifted out of the SiC aperture during the exposure or was missed completely during acquisition of the target. A number of apparent emission features seen in PG 1342+444 are not stellar features but arise from geocoronal emission.
2.2. Detection of photospheric and interstellar features in FUSE spectra
It is not surprising that absorption lines from both the local ISM and the photosphere of the stellar sources are seen in the FUSE spectra. Such features have already been reported in the ORFEUS spectra of G191-B2B and RE J0457281 (Vennes et al. 1996), including the detection of S and P, which are not seen in any other wavebands. However, ORFEUS was only able to observed a handful of WDs in its limited duration mission. With a planned mission lifetime of at least 2 years and a superior spectral resolution (), FUSE will provide a more comprehensive study of hot WDs and is capable of detecting weaker features.
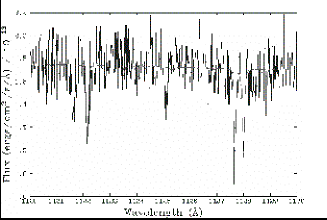
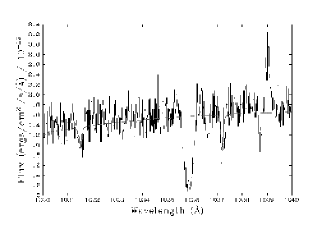
The compressed wavelength scale of Figure 1 renders invisible all but the strongest absorption features. However, closer examination reveals many absorption lines. For example, the 1120 to 1130 region of the PG 1342+444 spectrum shows photospheric SiIV and PV together with interstellar CI and FeII (figure 2). These same species are seen in RE J0558371, while photospheric CIV, SVI and FeVI are also detected in both objects.
Possibly the most interesting result is the presence of the OVI resonance absorption lines at 1031.912Å and 1037.613Å in both stars (figure 2), the first detection of OVI in any H-rich WD. This results also represents the first observation of these resonance features in any WD. Such a high oxygen ionization state is typically associated with the very hot PG1159 stars, being detected at optical wavelengths in those objects (e.g. Werner, Heber, & Hunger 1991). Hence, its appearance in a DA spectrum might appear to be something of a surprise since, at 70,000K, PG 1342+444 and RE J0558371 are considerably cooler. Nevertheless, the presence of OVI features is predicted by the model atmosphere calculations. Interestingly, OVI was not detected in the ORFEUS spectra of the cooler objects G191-B2B and RE J0457281. Table 1 lists the photospheric abundances of all elements detected in the FUSE spectral range, determined using the latest non-LTE model calculations, and compares these with values measured from ORFEUS data for G191-B2B.
| Element | Abundance (Nelem/H) | ||
|---|---|---|---|
| PG 1342+444 | RE J0558371 | G191-B2B | |
| Carbon | |||
| Oxygen | |||
| Silicon | |||
| Phosphorus | |||
| Sulphur | |||
| Iron |
3. Determination of Temperature and Gravity
To measure the values of and log g from the Lyman lines visible in the FUSE spectra, we have adapted the standard technique we have used previously for Balmer line studies (e.g. Barstow et al. 1997b). All the lines () included are fit simultaneously and an independent normalisation constant was applied to each, ensuring that the result was independent of the local slope of the continuum and reducing the effect of any systematic errors in the flux calibration of the spectra. We summarise the results of the Lyman line analyses in Table 2 and compare these with new Balmer line studies, utilising the same non-LTE heavy element-rich models, and earlier Balmer line work based on pure H atmospheres.
| PG 1342+444 | RE J0558371 | |||
| (K) | log g | (K) | log g | |
| Nominal (pure H) | 79000 | 7.82 | 70000 | 7.37 |
| Lyman | 55800 (660) | 8.00 (0.02) | 61100 (660) | 7.61 (0.05) |
| Balmer | 66750 (2500) | 7.93 (0.01) | 60800 (2500) | 7.55 (0.15) |
4. Discussion
As has been reported for cooler hot DA WDs (Barstow, Hubeny and Holberg 1998), the values of measured with fully line blanketed, heavy element-rich, non-LTE model atmospheres are significantly lower than those reported for pure H analyses. Hence, we must conclude that, overall, the temperature scale of the very hottest white dwarfs such as PG 1342+444 and RE J0558371 is lower than currently believed. Since these stars, together with other objects in our FUSE programme, were selected on the basis of their location in the temperature range between the hot DAs, such as G191-B2B, and the CPN, this result seems to reopen a gap between the CPN and the white dwarf cooling sequence. However, no CPN have yet been subjected to the same kind of analysis as that applied to these hot DAs. It seems likely that a similar reduction in will be found when such an analysis is carried out.
It is interesting to note that, the uncertainties in the values of determined from the Lyman line work are lower than for the Balmer lines. This probably arises from the fact that the Balmer lines become increasingly weak at these high temperatures, whereas the Lyman lines are much less affected by this problem. The respective Lyman and Balmer line measurements are in good agreement for RE J0558371 but there is a 10000K inconsistency between the two PG 1342+444 results. At the moment, this is difficult to explain as there are few examples of similar analyses with which to compare these results. The relative behaviour of Lyman and Balmer lines can be influenced by assumptions built into the model atmosphere calculations, although in this case we might expect to see differences for all stars. Alternatively, there may be signficant interstellar H opacity in PG 1342+444 which has not been properly accounted for in the analysis. Such material would increase the strength of the Lyman lines, leading to a lower value of .
5. Conclusion
We have presented observations of some of the hottest known white dwarfs made with the FUSE spectrometer. Detection of photospheric CIV, SiIV, OVI, PV, SVI and FeVI absorption lines allows us to estimate the abundances of these elements, the first such measurements reported for DA WDs at these high temperatures. The observed abundances are similar to those found in the somewhat cooler star G191-B2B (K). However, PG 1342+444 seems to have a large excess of C when compared to both REJ 0558371 and G191-B2B. The OVI resonance lines are uniquely present in the FUSE wavelength range, and their detection in the PG 1342+444 and RE J0558371 spectra is the first such report for any hot white dwarf.
The Balmer and Lyman line studies yield values of lower than reported for pure H Balmer line studies, as might be expected. The inconsistency between the PG 1342+444 Lyman and Balmer results sn an issue that requires further investigation. Forthcoming observations of the remaining targets in our sample will help examine whether or not the discrepancy originates in the model atmosphere calculations or arises from systematic effects due to interstellar absorption, or in the FUSE spectrometer calibration.
Acknowledgements
The work reported in the papers was based on observations made with the FUSE observatory, operated on behalf of NASA by Johns Hopkins University. MAB, MRB and NPB were supported by PPARC, UK.
References
Barstow, M.A. et al., 1994, MNRAS, 271, 175
Barstow, M.A., Holberg, J.B., Cruise, A.M., & Penny A.J., 1997, MNRAS, 290, 505
Barstow, M.A., Hubeny, I., and Holberg, J.B., 1998, MNRAS, 299, 520.
Dupuis, J., Vennes, S., Chayer, P., Hurwitz, M., and Bowyer, S., 1998, ApJL, 500, L45.
Finley, D.S., Koester, D., Kruk, J.W., Kimble, R.A., and Allard, N.F., 1997, in Proc 10th European Workshop on White Dwarfs, eds. J. Isern, M. Hernanz & E. Garcia-Berro (Dordrecht: Kluwer), 245.
Liebert, J., Bergeron, P., & Tweedy, R.W., 1994, ApJ, 424, 817
Moos, H.W., et al., 2000, ApJL, 538, 1.
Napiwotzki, R., Schönberner, D., 1993, In ‘White Dwarfs: Advances in Observation and Theory’, ed. M.A. Barstow, Kluwer, Dordrecht, 99
Oegerle, W.R., et al., 2000, The Fuse Observers Guide, Version 2.1.
Sahnow, D.J., et al., 2000, ApJL, 538, 7.
Vennes, S., Chayer, P., Hurwitz, M., & Bowyer, S., 1996, ApJ, 468, 989
Werner, K., Heber, U., and Hunger, K., 1991, A& A, 244, 437.