email: machalsk@oa.uj.edu.pl, jamrozy@oa.uj.edu.pl
J1343+3758: The third largest FRII-type radio galaxy
in the Universe
Abstract
A radio source of the Fanaroff–Riley type II with the angular size of 11.3 arc min is identified with an optical galaxy at . Thus, the projected linear extent of the radio structure is 3.14 Mpc which makes it the third largest classical double radio source known after 3C236 and WNB2147+816. The high-frequency VLA observations, a galaxy identification and its optical spectroscopy are reported. The equipartition magnetic field and energy density in the source is calculated and compared with corresponding parameters of other giants known, indicating that either parameter of the source investigated is extremely low. On the other hand, the age estimate of relativistic electrons and the advance speed of the lobe material are comparable to the respective parameters characterizing other low-luminosity giant sources, as well as much smaller and brighter 3CR sources. The environment analysis suggests that J1343+3758 lies in a significantly poor region of intergalactic medium.
Key Words.:
Radio continuum: galaxies – Galaxies: active – Galaxies: individual: J1343+37581 Introduction
In this letter, we report a discovery of the third largest radio galaxy in the Universe. Known from years, the record holder radio galaxy 3C236 with the linear extent of 5.65 Mpc (if km s-1 Mpc-1 and which we assume hereafter) was mapped with the WSRT over 20 years ago (cf. Willis, Strom & Wilson 1974; Strom & Willis 1980). The second largest, recently discovered, 3.56-Mpc radio galaxy is WNB2147+816 (Palma et al. 2000). Proceeding with our investigation of low-luminosity giant radiosource candidates (cf. Jamrozy & Machalski 1999; Machalski & Jamrozy 2000), selected from the VLA surveys: FIRST (Becker, White & Helfand 1995) and NVSS (Condon et al. 1998), we focussed our attention on the source J1343+3758. This source can be discerned in the 325-MHz WENSS survey (Rengelink et al. 1997) and 1.4-GHz VLA NVSS survey as a 11.3 arc min large FRII-type radio source. The source consists of the two extended radio lobes, possibly connected with a very dimmed bridge. At the outer edges of both lobes there are more compact bright regions clearly visible on the relevant FIRST map J134300+38071E.COADD.1, however from that FIRST map alone one could not be sure that these bright regions belong to the same source. The region in the NE lobe contains a very bright hot spot. The source was also detected during the low-resolution sky surveys at 151 and 232 MHz (6C2: Hales, Baldwin & Warner 1988; Zhang et al. 1997, respectively). In the 408 MHz and 4.85 GHz surveys (B3: Ficarra, Grueff & Tomassetti 1985; GB6: Gregory et al. 1996, respectively), only its SW lobe was detected above the survey’s limit.
The FIRST map may suggest a radio core with 1.4-GHz flux density of about 1.5 mJy at the J2000 position: RA , Dec. , but the rms noise on this map (0.15 mJy beam-1) produced other spots of comparable intensity. Therefore, we have made additional high-frequency VLA observations which allow us to confirm its radio core and firmly identify the source with a galaxy at the redshift of 0.229. This VLA observations are described and the radio spectrum of the entire source and its lobes are determined in Sect. 2. The optical spectroscopy of the identified galaxy is described in Sect. 3. In Sect. 4, the equipartition magnetic field and energy density within the lobes as well as the lifetime of relativistic electrons at the frequency of 325 MHz and the mean advance velocity of the lobes, are calculated and compared with the respective values found for other giants as well as for much smaller 3CR sources by Ishwara-Chandra & Saikia (1999). Finally, the environment density is estimated by the simple counts of galaxies around the identified galaxy and the calculation of particle density around the radio lobes.
2 Radio observations
A field centred at the pressumed core position taken from the FIRST map (cf. Sect. 1) was observed with the VLA B–array at 4.86 GHz. This observing frequency and the array configuration did not allow us to map the brightness distribution in the extended lobes with their brightest regions lying 5–6 arc min apart from the core.
The observations were conducted on December 13, 1999. of the synthesized beam was . With the integration time of min, the rms fluctuations were about 26 Jy beam-1. The core component of 0.7 mJy beam-1 and the integral flux density of 1.1 mJy was detected at , (J2000). Besides the core, very much attenuated emission was detected from the hotspot in the NE lobe.
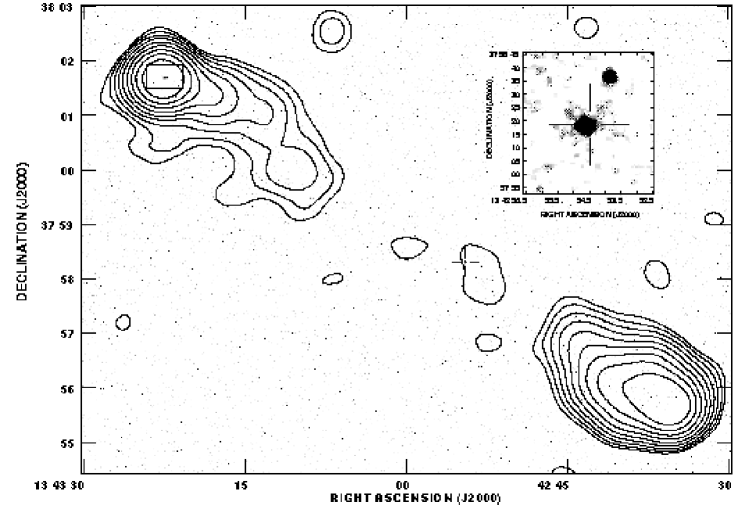
Fig. 1 shows the radio contours of the source taken from the NVSS map C1348P36.IQU.1 overlayed on the brightness from our 4.86-GHz map (gray scale). Because of very large scale of the entire source, poorly visible dot indicating the radio core is marked by the cross. The most compact structure in the NE lobe, reproduced from the 1.4-GHz FIRST map (cf. Sect. 1), and our 4.86-GHz map resolving the hotspot are shown in Fig. 2. The deconvolved size of the hotspot at 1.4 GHz is at PA=+83. This hotspot is resolved at 4.86 GHz into two components with the deconvolved sizes of and . These sizes are used in Sect. 4 to estimate the area of the bowshock and ambient density of the environment in front of a head of the NE lobe.

The degree of asymmetry of J1343+3758 is low. The ratio of separation between the core and brightest regions in the lobes and the misalingnment angle are 1.32 and 3 deg, respectively. The widths of the lobes (322 kpc and 274 kpc) are determined using the prescription of Leahy & Williams (1984), i.e. the deconvolved half-power widths are multiplied by the factor . The average of the above values give the overall axial ratio of 10.5.
The flux densities available for the source at frequencies from 151 MHz to 5 GHz are given in Table 1.
| Freq. | Survey | Total flux | SW lobe | NE lobe |
|---|---|---|---|---|
| (GHz] | Tel. | [mJy] | [mJy] | [mJy] |
| 0.151 | 6C2 | |||
| 0.232 | Miyun | |||
| 0.325 | WENSS | |||
| 0.408 | B3 | |||
| 1.4 | NVSS | |||
| 4.85 | GB6 |
Note: a) original B3 flux density is multiplied by 1.087,
i.e.
adjusted to the common scale of Baars et al. (1977)
The integrated spectrum of the entire source and its lobes is shown in Fig. 3. In order to calculate the total radio luminosity, we fit the observed flux density data with an assumed functional form. The best fit to the data in column 3 of Table 1 is achieved with a parabola [mJy], where [GHz]. This fit gives the best-fitted 1.4 GHz total flux density of 136 mJy, and the fitted spectral indices of and at 151 MHz and 5 GHz, respectively. Though the quoted errors of spectral indices are large, the integrated spectrum clearly steepens at high frequencies. A change of the spectrum slope of about 0.5 suggests that the break frequency is likely between 151 MHz and 5 GHz, however its too short frequency range did not allow a reliable fit of any theoretical spectrum accounting for radiative losses to the observations.

3 Optical observations
The radio core position coincides perfectly with a galaxy of R=17.94 mag at , (J2000) according to the magnitude calibration and astrometric position in the Digitized Sky Survey (DSS) data base. The optical image of this galaxy is shown in the upper-right subset of Fig. 1 where the position of the very compact radio core is indicated.
In order to determine a redshift of the identified galaxy, we have made optical spectroscopic observations with the 2.1m telescope of the McDonald Observatory (Texas). These observations constituted a part of the larger project involving optical spectroscopy of the other giant candidates in our sample (cf. Introduction). The ‘Imaging Grism Instrument’ (IGI) equipped with the TK4 CCD detector and cooled with liquid nitrogen was used. IGI allows direct imaging and spectroscopy with a spatial scale of per pixel within the field of view of 8 8 arc min. We used a grism sensitive to the wavelength range 3750 Å to 7600 Å and a 2 wide slit, that provided a dispersion of 3.7 Å per pixel and spectral resolution of about 12 Å. Three exposures of 30 min were taken on two nights of February 28 and 29, 2000, which allowed to improve S/N ratio without an increase of smearing of the spectrum during a too long single exposure and due to imperfect tracking of the telescope. The wavelength calibration was carried out using exposures to helium and mercury lamps. The flux calibration was provided by exposures of the standard star HZ 44. The data reduction and calibration were performed with the use of packages of the IRAF software. The reduced 1-D spectrum is shown in Fig. 4.
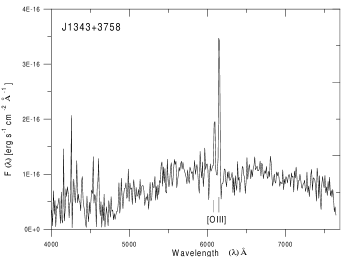
The spectrum reveals a weak continuum with prominent narrow emission lines [OIII] 4959 Å and 5007 Å, which give a redshift .
4 Physical parameters
Recently, Ishwara-Chandra & Saikia (1999) have published very interesting statistics of some physical parameters calculated for 44 known giants exceeding 1 Mpc, and compared them with the corresponding parameters of smaller 3CR radio sources. Following Ishwara-Chandra and Saikia, we calculate the equipartition magnetic field and minimum energy density in J1343+3758 using the standard method (e.g. Miley 1980), as well as the ratio , where nT is the equivalent magnetic field of the microwave background radiation, and which represents the ratio of the energy losses by synchrotron radiation to the total energy losses due to the synchrotron and inverse Compton processes. Following their analysis and assuming: a cylindrical geometry of the source with a base diameter of 298 kpc (which is the mean of the deconvolved widths of the lobes derived in Sect. 2) and the projected length of 3140 kpc, the filling factor of unity, and equal energy distribution between relativistic electrons and protons, we found the total radio luminosity of the source between 10 MHz and 10 GHz erg s-1 and the source volume of cm3. Since the parabolic fit of the spectrum may underestimate fluxes (and thus the source luminosity) at frequencies below 151 MHz, we also calculated for constant spectral slope of at MHz and found only 8 per cent increase of . Then we found nT, erg cm-3, , and . The errors in and are calculated adopting errors of 15 per cent in the integral luminosity, 0.2 in spectral index, and 50 per cent in the volume.
The equipartition magnetic field and energy density found for J1343+3758 are extremely low. Only two giants in the sample of Ishwara-Chandra & Saikia have their parameters comparable to the above values. The respective parameters are compared in Table 2.
| Source | ||||
|---|---|---|---|---|
| name | [nT] | [erg cm-3] | ||
| NGC6251 | 0.061 | 0.38 | 5.6 | 0.031 |
| DA240 | 0.077 | 0.61 | 4.5 | 0.046 |
| J1343+3758 | 0.083 | 0.63 | 5.9 | 0.028 |
The age of relativistic electrons in the radio lobes radiating at a given frequency can be deduced from the values of and . Again following the analysis of Ishwara-Chandra & Saikia, we have calculated at MHz. Using their expression (cf. also Alexander & Leahy 1987 and Liu, Pooley & Riley 1992) which is derived under assumption that electrons are isotropized on time-scales much shorter than their radiative lifetime (JP model: Jaffe & Perola 1974), we found yr. It is somehow lower than yr for Ishwara-Chandra & Saikia’s giants with , and closer to yr for those at .
However, this is worth to emphasize that the JP model predicts the fastest steepening of synchrotron spectrum at high frequencies, while its slowest steepening is provided in the case of continuous injection of energetic particles (CI model); for the detailed description cf. Myers & Spangler (1985). Because of very limited observational data, one cannot distinguish which model of the radiative losses would be plausible for J1343+3758, but this model-dependent uncertainty of the synchrotron lifetime of particles in its lobes is less than that introduced by other effects like unknown filling factor, energy distribution between electrons and protons, or uncertain volume.
If the main axis of the source is close to the plane of the sky, the distance from the core to the brightest regions in the lobes will be within 1.4 Mpc and 1.8 Mpc. Relating yr to any distance between the above values, the advance speed of the lobes material should be about . This value is still within the speed range found for much smaller, double 3CR radio sources (e.g. Alexander & Leahy; Liu et al.). This advance speed can suggest that the source achieved its present size due to expansion in a low-density environment. To check this, we followed Hill & Lilly (1991) and estimated the environment density by simple counts of galaxies around the identified galaxy. We define as the net excess number of galaxies with magnitude from to and within 1.5 Mpc radius around our galaxy. Using the DSS data base and adopting mag, we found 30 galaxies to meet the above criterium. However, the number of galaxies with mag can be underestimated in the DSS as they can be seen at the POSS E–plates only, therefore we adopt . The relevant number of background galaxies, was found using the differential counts deg-2mag-1] (Tyson 1988). Resultant negative net value indicates that J1343+3758 lies in a distinctly poor region of intergalactic medium. This conclusion is further supported by an estimate of the particle density around the lobes. Following Lacy et al. (1993), we assume that the heads of lobes are ram-pressure confined. Taking the deconvolved diameter of the hotspot in the NE lobe as 3 arc sec, we can estimate the ambient density g cm-3. This estimate is lower by an order than that found for the other giants (cf. Parma et al. 1996: Mack et al. 1998; Schoenmakers et al. 1998).
Acknowledgements.
Authors acknowledge (i) the National Radio Astronomy Observatory (Socorro, NM) for the target-of-opportunity observing time, (ii) the National Optical Astronomy Observatories (Kitt Peak, AZ) for the usage of the IRAF software, (iii) the Space Telescope Science Institute for the usage of the DSS data base, and (iv) Dr U. Klein for his constructive remarks and suggestions improving this paper. This work was supported in part by the State Committee for Scientific Research (KBN) under the contract PB 0266/PO3/99/17.References
- (1) Alexander P., Leahy J.P., 1987, MNRAS 225, 1
- (2) Baars J.W.M., Genzel R., Pauliny-Toth I.I.K., Witzel A., 1977, A&A 61, 99
- (3) Becker R., White R., Helfand D., 1995, ApJ 450, 559
- (4) Condon J.J., Cotton W.D., Greisen E.W., et al., 1998, AJ 115, 1693
- (5) Ficarra A., Grueff G., Tomassetti G., 1985, A&AS 59, 255
- (6) Gregory P.C., Scott W.K., Douglas K., Condon J.J., 1996, ApJS 103, 427
- (7) Hales S.E.G., Baldwin J.E., Warner P.J., 1988, MNRAS 234, 919
- (8) Hill G.J., Lilly S.J., 1991, ApJ 367, 1
- (9) Ishwara-Chandra C.H., Saikia D.J., 1999, MNRAS 309, 100
- (10) Jaffe W.J., Perola G.C., 1974, A&A 26, 423
- (11) Jamrozy M., Machalski J., 1999, Acta Astron. 49, 181
- (12) Lacy M., Rawlings S., Saunders R., Warner P.J., 1993, MNRAS 264, 721
- (13) Leahy J.P., Williams A.G., 1984, MNRAS 210, 929
- (14) Liu R., Pooley G., Riley J., 1992, MNRAS 257, 545
- (15) Machalski J., Jamrozy M., 2000, In: The Universe at Low Radio Frequencies (Proc. IAU Symp. No.199, Pune, India), ed. ASP Conference Series (in print) bibitem[1998]mack Mack K.H., Klein U., O’Dea C.P., Willis A.G., Saripalli L., 1998, A&A 329, 431
- (16) Miley G.K., 1980, ARA&A 18, 165
- (17) Myers S.T., Spangler S.R., 1985, ApJ 291, 52
- (18) Palma C., Bauer F.E., Cotton W.D., et al., 2000, prep. astro-ph/0002033
- (19) Rengelink R., Tang Y., de Bruyn A.G., et al., 1997, A&AS 124, 259
- (20) Schoenmakers A.P., Mack K.H., Lara L., et al., 1998, A&A 336, 455
- (21) Strom R.G., Willis A.G., A&A 85, 36
- (22) Tyson J.A., 1988, AJ 96, 1
- (23) Willis A.G., Strom R.G., Wilson A.S., 1974, Nature 250, 625
- (24) Zhang X., Zheng Y., Chen H., et al., 1997, A&AS 121, 59