Testing the origin of the gamma-ray background
Abstract
Fluctuations of the gamma-ray background (GRB) are investigated. It is assumed that the GRB is produced by discrete sources. Two basic classes of objects as dominant contributors to the GRB are considered: a) blazars and b) starburst galaxies. Predicted counts are calculated for these two models. In both cases strong cosmic evolution is needed to produce a substantial fraction of the observed GRB. Since on the average blazars are several orders of magnitude more luminous than starburst galaxies, their number required to saturate the GRB is much smaller than the number of starburst galaxies. In effect, fluctuations of the GRB in the blazar model are relatively high. It is shown that moderate improvement in the measurement accuracy of the GRB flux will allow us to discriminate between these models.
keywords:
background radiation, gamma-ray sources, infra-red sources1 Introduction
Using the present detection techniques we are unable to define a true nature of the diffuse extragalactic gamma-ray background. The status of the GRB is now analogous to that of the X-ray backgrund in 1960s and 70s. Although some classes of objects are known -ray emitters, it is by no means certain what fraction of the GRB is produced by any particular classes of objects and even by the discrete sources in general. Furthermore, it seems likely that some fraction of the diffuse emission considered previously to be of the extragalactic origin is produced in the halo of our Galaxy (Strong et al., 1999). Dar & De Rújule (2000) postulate that most if not all of the GRB is produced in the Galactic halo.
One should expect that structural features of the GRB are related to its origin. It is likely that trully diffuse processes produce the GRB of smooth distribution without strong well defined fluctuations. On the contrary, small scale variations would indicate the discrete nature of the background. In the present paper we concentrate on a class of models which assume that the whole GRB is produced by a well defined population of discrete sources. We discuss two cases in detail. The source counts are estimated and prospects for the detection of individual sources by the present-day and the near future instruments are assessed. Next we estimate amplitude of the GRB fluctuations in various angular scales characteristic to both these models.
2 Discrete source model
It is assumed that the extragalactic -ray background is produced by a population of unresolved discrete sources. We assume further that these sources are distributed randomly, i.e. effects of source clustering on the GRB fluctuations are neglected (it is straightforward to show that for any realistic model of the source clustering the latter assumption is reasonable). Since it is not clear which class of sources contributes most to the GRB, we consider two types of objects which potentially could generate the GRB: a) blazars and b) starburst galaxies. Blazars are known to be -ray emitters (e.g. Mukherjee et al. 1997), while starburst have been considered as potential sources (e.g. Sołtan & Juchniewicz 1999). The low sensitivity and poor angular resolution of the present-day -ray telescopes allows only for the detection of the most luminous objects, mostly blazars. However, the contribution of blazars to the GRB remains highly uncertain and depends strongly on the cosmic evolution. The question whether the GRB could be produced by the starburst galaxies also cannot be answered directly. Locally these objects are much weaker than blazars, but their space density is higher and there are indications that these objects also are subject to the strong cosmic evolution (Saunders et al. 1990, Pearson & Rowan-Robinson 1996).
3 Source counts
The source counts are related to the luminosity function (LF) by the formula:
| (1) |
where and denote the -ray flux and luminosity, respectively, is the evolving with redshift luminosity function and all the symbols have their ususal meaning. Low luminosty limit in the second intergral is defined as , where is the luminosity distance and is the average energy () spectral index of the -ray sources: . In the subsequent calculations data taken from the literature have been scaled to the Hubble constant km s-1Mpc-1 and .
3.1 AGN model
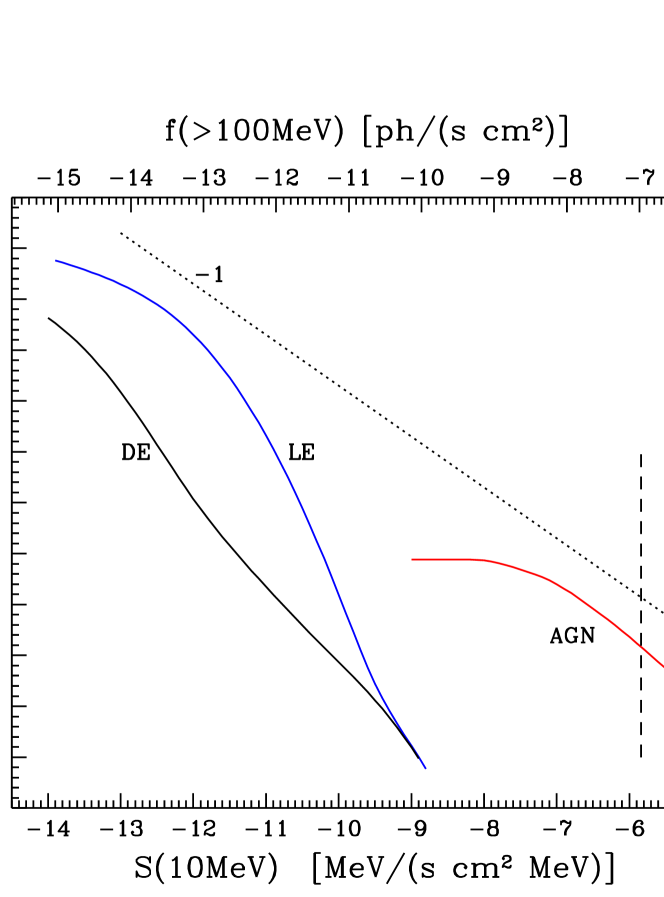
Predicted counts of the -ray blazars have been calculated using data on the local luminosity function and the luminosity evolution rate of these objects from Chiang & Mukherjee (1998). AGNs loud in the -rays detected by EGRET have been used. The local LF shows pronounced flattening at luminosities below erg s-1. Estimates of the luminosity evolution parametrized by a power-law give at redshifts smaller than 2.5. At higher redshifts the evolution slows down and in the present calculations we assumed . Although both the LF and the evolution are subject to large uncertainties, the overall shape of the predicted by the model only weakly depends on the particlular choice of parameters. The counts shown in Fig. 1 are labelled ’AGN’. According to the present model counts flatten substantially at fluxes of . It implies that most of the GRB is produced by relatively small number of bright sources.
3.2 Starburst galaxy model
Significantly different predictions concerning the source counts and the structure of the GRB are obtained in the model of the -ray emission by starburst galaxies proposed by Sołtan & Juchniewicz (1999). In this case the -rays are produced as a result of the inverse Compton scattering of the far infrared (FIR) photons on the cosmic ray electrons. Both cosmic microwave background photons and intrinsic galaxy radiation contribute to the production of -rays. Since cosmic ray electrons manifest their presence in the galaxy via synchrotron radiation, measurements of radio luminosities of starburst galaxies provide data on the number of these electrons. Consequently, the correlation between the FIR and radio luminosities observed for the starburst galaxies (e.g. Chi & Wolfendale 1990) allows for relatively safe estimates of the -ray luminosity of each galaxy and the local volume emissivity of the whole starburst galaxy population (see Sołtan & Juchniewicz (1999) for details). In fact, the obtained figures are just lower limits for the high energy emission of these objects. This is because apart from the inverse Compton mechanism, one should also take into consideration Bremsstrahlung emitted by cosmic ray electrons in the interaction with the galactic gas.
The FIR evolution rate of starburst galaxies is not well determined, but some direct estimates at low redshifts are available (e.g. Saunders et al. 1990). Various observations provide data on the star formation history covering redshifts up tu (e.g. Moorwood 1996). There is an agreement that star formation rate (SFR) below varies roughly as , and for higher is either stable or smoothly decayes to low levels at (e.g. Franceschini et al. 1997, Hopkins et al. 2000). Approximate data on SFR do not constrain strongly our estimates of the evolution of the -ray volume emissivity and source counts. This is because the -ray source counts depend strongly on the evolution type of the FIR properties of starburst galaxies. If these objects are subject to the density evolution (DE), the normalization of the FIR LF increases with redshift, but luminosities on the average do not evolve. In the luminosity evolution (LE) case, the space concentration of objects is constant while their FIR luminosities () increase with redshift.
High energy luminosity of the individual galaxy due to the inverse Compton effect is proportional to the total number of cosmic ray electrons and the energy density of FIR photons (e.g. Rybicki & Lightman 1979). Since production of the cosmic ray electrons is also related to the (indirectly via rate of supernova explosions), the -ray luminosity, , should be proportional roughly to the square of the . A more scrupulous analysis of the relevant correlations between radio luminosity, cosmic ray electron spectrum and strength of the magnetic field, , as well as radio and FIR luminosities, and the correlation between the and (Chi & Wolfendale 1990) gives the number of electrons proportional to (Sołtan & Juchniewicz 1999), and finally . Thus, in the case of the LE of FIR luminosity function, we expect a much stronger growth of the -ray emissivity by the starburst galaxies than in the DE case. Accordingly, the predicted counts for the LE model are much steeper. In Fig. 1 curves labelled ’LE’ and ’DE’ show the count for both models (in both cases evolution rate of the FIR volume emissivity is the same).
4 Fluctuations
Sreekumar et al. (1998) using the EGRET data above 100 MeV have estimated the isotropy of the GRB by measuring the backgound intensity over the sky (far from the galactic center and the galactic plane). Analysis of 28 regions of approximately 0.26 sr each gave the average flux of ph (s cm2 sr)-1 with the rms scatter between the regions of ph (s cm2 sr)-1. The average uncertainty of the measurement for each field was equal to ph (s cm2 sr)-1. This apparent concordance implies that the detected fluctuations are consistent with the noise of the EGRET measurements. Below we estimate amplitude of the GRB fluctuations generated in the present models and compare our predictions with the parameters of the INTEGRAL instruments.
Although integrated fluxes of the GRB predicted by the ’AGN’ and ’starburst LE’ models are similar, the source counts in these two cases are distinctly different. The vertical dashed line shows the threshold sensitivity of EGRET ( above 100 MeV). A number of sources above this threshold have been in fact detcted by EGRET. However, these sources produce a small fraction of the total GRB. In the ’starburst LE’ model most of the GRB is produced by sources fainter by several orders of magnitude, while in the ’AGN’ model the substantial fraction of the GRB is generated by sources with , i.e. just an order of magnitude weaker than the EGRET limit. Thus, with the sensitivity improved by an order of magnitude below the EGRET threshold, both models would be distinguished directly. Since the predicted sensitivities of the main INTEGRAL instruments, IBIS and SPI, are comparable to EGRET (assuming the average source spectral slope of ), it is unlikely that dicrete source observations would allow an unambiguous differentaition of both models. However, one can assess the source counts below the threshold of (what roughly corresponds to ) using the fluctuation analysis. The number of sources per steradian producing most of the GRB in the AGN model is relatively small. In this case fluctuation of the GRB resulting from its discrete nature are substantially larger than in the starburst model.
To illustrate a potential of the GRB fluctuation analysis we consider the AGN model shown in Fig. 1. Integrated counts in this case give the GRB flux of MeV/(s cm2 MeV sr) at 10 MeV, what amounts approximately to 73 % of the actually observed total background. Roughly half of the model flux is produced by sources below the EGRET detection threshold (assuming the energy index of ). The relative rms fluctuations produced by the Poissonian distribution of sources in the 0.26 sr bins are of the order of 5 % of the total (observed) GRB. However, if we use regions comparable with the SPI field of view ( sr) the rms amplitude amounts to 10 % and for the IBIS fov of sr it reaches 15 %. This figure is roughly equal to the signal-to-noise ratio reached in the EGRET measurements in the sr fields. Thus, if the INTEGRAL instruments give similar S/N, some estimates of the GRB fluctuations would become feasible.
Numerical results in the above calculations depend strongly on the assumed model parameters. In particular, if the blazars produce % of the GRB (not just %, as assumed in the example), the amplitude of fluctuations could be substantially larger. On the other hand, the starburst galaxy model provides more definite results on the amplitude of the GRB fluctuations. The variations of the GRB predicted for this latter model are very low and remain invariably below the detection threshold for a wide range of model parameters.
5 Conclusions
Simple, discrete source models of the GRB have been constructed to investigate effects of the background anisotropies at different angular scales. Source counts predicted in the balazar and starburst galaxy models are distinctly different. We have shown that precise measurements of the GRB using of the INTEGRAL detectors would allow to distinguish between these two cases. Isotropic GRB would indicate that the large number of faint sources contributes to the GRB making the starburst model more likely, while detectable GRB fluctuations would point to the blazar model.
Acknowledgments
This paper was supported by the Polish KBN grant 2P03D 002 14.
References
- Chi & Wolfendale (1990) Chi, X., & Wolfendale, A. W., 1990, MNRAS 245, 101
- Chiang & Mukherjee (1998) Chiang, J. & Mukherjee, R., 1998, ApJ 494, 752
- Dar & De Rújule (2000) Dar, A. & De Rújula, A., 2000 astrophys-ph/0005080
- Franceschini et al. (1997) Franceschini, A., Aussel, H., Bressan, A., et al., 1997, ESA First Symposium, ESA SP 401, astrro-ph/9707080
- Hopkins et al. (2000) Hopkins, A. M., Connolly, A. J., & Szalay, A. S., 2000, astro-ph/0009073
- Moorwood (1996) Moorwood, A. F. M., 1996, SSRv 77, 303
- Mukherjee et al. (1997) Mukherjee, R., Bertsch, D. L., Bloom, S. D. et al., 1997, ApJ 490, 116
- Pearson & Rowan-Robinson (1996) Pearson, C. & Rowan-Robinson, M., 1996, MNRAS 283,174
- Rybicki & Lightman (1979) Rybicki, G. B. & Lightman, A. P., 1979, Radiative Processes in Astrophysics, John Wiley & Sons, New York
- Saunders et al. (1990) Saunders, W., Rowan-Robinson, M., Lawrence, A. et al., 1990, MNRAS 242, 318
- Sołtan & Juchniewicz (1999) Soltan, A. M., & Juchniewicz, J., 1999, Astro. Lett. and Comm., 39, 197
- Sreekumar et al. (1998) Sreekumar, P., Bertsch, D. L., Dingus, B. L. et al., 1998, ApJ 494, 523
- Strong et al. (1999) Strong, A. W., Moskalenko, V. I. & Reimer, O., 1999, astrophys-ph/9906229