Cygnus X-3 with ISO: investigating the wind
Abstract
We observed the energetic binary Cygnus X-3 in both quiescent and flaring states between 4 and 16 m using the ISO satellite. We find that the quiescent source shows the thermal free-free spectrum typical of a hot, fast stellar wind, such as from a massive helium star. The quiescent mass-loss rate due to a spherically symmetric, non-accelerating wind is found to be in the range (0.4–2.9) yr-1, consistent with other infrared and radio observations, but considerably larger than the yr-1 deduced from both the orbital change and the X-ray column density. There is rapid, large amplitude flaring at 4.5 and 11.5 m at the same time as enhanced radio and X-ray activity, with the infrared spectrum apparently becoming flatter in the flaring state. We believe non-thermal processes are operating, perhaps along with enhanced thermal emission.
keywords:
stars: individual: CygX-3 – stars: Wolf-Rayet – binaries: close – stars: mass-loss – infrared: stars – X-rays: stars1 Introduction
The Infrared Space Observatory ISO (Kessler et al. 1996) with its on-board complement of cameras and spectrometers, provided a rare opportunity to study sources at wavelengths not accessible from the ground. We present photometry and images of the Cygnus X-3 field made using ISOCAM (Cesarsky et al. 1996), the camera on ISO, in the wavelength range 4 to 16 m. We report the first spectrum of this source in this wavelength range.
Cygnus X-3 is an enigmatic and unusual X-ray binary which was discovered 30 years ago (Giacconi et al. 1967). Observations of it have been made from radio to gamma rays and in every wavelength bands the system exhibits unusual behaviour. In X-rays and infrared, the emission is partially modulated by a 4.8 h period (Mason, Córdova & White 1986), and this is believed to be the orbital period of the system.
In 1991, van Kerkwijk et al. observed Cyg X-3 in the infrared with the CGS4 spectrometer on UKIRT and discovered He i and He ii together with N emission lines which were modulated at the 4.8 h period (van Kerkwijk et al. 1992; van Kerkwijk et al. 1996). They concluded that the lines originated from the companion star, either a Wolf–Rayet of the WN7 class, or an earlier WN4–6 in an outburst phase. This was investigated in more detail by Fender, Hanson & Pooley (1999, hereafter FHP99), who took spectra during a variety of activity states and confirmed that the underlying quiescent spectral type is of an earlier WN4–5 Wolf–Rayet star.
Galactic Wolf–Rayet stars have high velocity winds, up to 2500 km s-1 (Crowther, Hillier & Smith 1995; Bohannan & Crowther 1999). The Wolf–Rayet wind from Cyg X-3 is believed to be the main contributor in providing mass and angular momentum loss which increase the orbital period ( s s-1, Kitamoto et al. 1995). This period increase is consistent with a mass-loss rate of yr -1, where is the total mass in the system (Kitamoto et al. 1995; Matz 1997). Kitamoto et al. (1994) modelled changes in the radio activity, infrared and X-ray states caused by changes in the density of the WR wind (Table 1). The multi-wavelength predictions of Kitamoto et al. (1994) were tested by FHP99, who find that during an outburst the infrared K band spectrum becomes dominated by strong twin-peaked He i emission lines. These lines show strong V/R variability correlated with the orbital phase. Due to the small size of the binary ( separation, 4.8 hour period) the observed line flux could not arise from a region of this size as the environment would be too hot. FHP99 conclude that the He i emission lines are emitted from a region which is significantly larger than the binary separation, and that the variability of these lines indicate an asymmetric emission region, possibly from a flattened disc-like wind.
| Regime | Emission | Rare wind | Dense wind |
|---|---|---|---|
| Radio | Continuum* | Quiescence | Flaring |
| Infrared | Continuum* | Weak | Strong |
| Line strength* | Weak | Strong | |
| Ionisation* | High | Low | |
| Modulation | Large | Small | |
| X-ray | Luminosity* | Low | High |
| Spectrum | Hard | Soft |
The compact object in Cyg X-3 is less well defined. Cherepashchuk & Moffat (1994) suggest that the high X-ray luminosity (greater than the Eddington luminosity for a 1 object) implies that the compact object is a black hole. Schmutz, Geballe & Schild (1996) related time-variations of infrared spectral lines to an orbital velocity and derived a mass for the compact object in the range of 7–40 , assuming realistic values for the mass of the Wolf–Rayet star and the inclination of the system. However, their model does not account for all the relative phasing of the X-rays and infrared lines. Ergma & Yungelson (1998) point out that if the progenitor to the binary is two massive helium stars then the mass-loss and common envelope phase of these two stars prevents the formation of a black hole & Wolf–Rayet binary with an orbital period less than several days. This ambiguity does not resolve itself if the compact object is a neutron star; Ergma & Yungelson (1998) also comment that the propeller motion of a spinning neutron star would prevent wind accretion in the system, thus removing the jet-creation mechanism.
With a high mass, high mass-loss (wind) object in close proximity to a compact object, a high degree of interaction takes place. Radio observations at wavelengths ranging from 1–20 GHz have shown Cyg X-3 to undergo many states of emission and are used to define the state of Cyg X-3. For most of its time, the system occupies a quiescent radio state, with 8.3 GHz flux around 100 mJy (Waltman et al. 1994). Major flares (8.3 GHz flux 1 Jy) occur at random intervals every 18 months or so and relaxation after a flare can last up to several weeks (Waltman et al. 1995). More common are minor flares (8.3 GHz flux 200–1000 mJy) and these usually occur during a flaring period typically several weeks duration, with several small flares occurring in close proximity to each other (Waltman et al. 1996). Minor flares can reach peak emission in a few hours and decay over several hours (Ogley 1998). The minor and major flares have been shown to be intrinsically different in their production, rise and relaxation times (Newell 1996). Preceding a major flare, the system enters a quenching state with fluxes at 8.3 GHz dropping to around 10 mJy. The system returns to quiescence then flares (Waltman et al. 1996).
The main mechanism for radio flares is thought to be associated with the acceleration of relativistic electrons in the base of jets. Synchrotron emitting plasmons have been detected, travelling at 5 mas d-1 on both arcsec and mas scales (Spencer et al. 1986; Mioduszewski et al. 1998). There is no confident determination of the velocity of ejecta: while a velocity of 0.3 is generally taken as the speed on the larger arcsec scale (e.g. Spencer et al. 1986), other highly-relativistic interpretations are possible on the mas scale (e.g. Ogley, Bell Burnell & Newell 1997; Newell, Garrett & Spencer 1998).
The Wolf–Rayet contributes not only to the enigmatic qualities of the system, but also a significant and varying opacity. The true nature of the secondary is a top priority for the understanding of the system. Observations at the ISO wavelengths provide a unique opportunity to study the Wolf–Rayet wind, and spectra obtained can track its true nature.
2 ISOCAM observations
2.1 In quiescence
Quiescent observations were taken on 1996 April 07 (MJD 50180) with 6 long-wavelength (LW) filters on the CAM instrument. Cyg X-3 is in the galactic plane at a distance of around 10-kpc and so is heavily obscured by dust along our line of sight. Around the object, emission from cirrus is particularly strong at longer wavelengths so our observations were focused in the 1–16 m range. The wavelengths chosen are presented in Table 2. We observed for a total of 2895 s in 6 filters in order to obtain a rough spectrum of the source. A 6 arcsec pixel size was used for the observations and single frames, stare-mode, were taken with the 4 shorter wavelength filters, whereas the 12 and 15 m images were taken as mosaics. The integration time for individual frames was 2.1 s and the total integration times for all filters are given in Table 2
| Filter | Wavelengths | Integration |
|---|---|---|
| name | range (m) | time (s) |
| LW 1 | 4.10–4.90 | 161 |
| LW 4 | 5.50–6.50 | 161 |
| LW 5 | 6.50–7.00 | 119 |
| LW 6 | 7.00–8.50 | 144 |
| LW 10 | 8.60–14.4 | 321 |
| LW 3 | 12.1–16.9 | 311 |
Analysis of the ISO data was performed at the ISO data centre in Vilspa, Spain. Each image had a number of corrections applied to it and these included: (a) dark correction, (b) de-glitching the data to remove transients, (c) stabilisation of pixels due to memory effects, (d) a flat-field correction, (e) jitter correction, (f) combination of images into a stare image or raster map, (g) field of view distortion and finally (h) conversion from engineering units of adu g-1 s-1 to Jy.
The corrections that were applied to the data either used standard library frames, or software routines developed by the ISOCAM Consortium. The processes which used library fields were the dark correction (van Buren & Kong 1996) and the flat-field correction of stare images. The other corrections used standard software routines and included a multi-resolution median transform for the de-glitching process; a 90 per cent stabilisation method to correct for memory effects; standard field of view distortion; and standard conversion of adu g-1 s-1 to Jy with code formulated on 1998 April 05. No jitter correction as the average jitter reported of 0.5 arcsec was much less than our pixel field of view of 6 arcsec. For a detailed discussion see Ogley (1998).

The reduction of mosaic images was essentially identical to stare images, but with the following exceptions. The flat-field correction did not use standard frames, but built up a flat-field using the background pixels in the mosaic. The flat-fielding using standard frames is the least robust of the data analysis stages, and can lead to significant increases or decreases in flux at the edges of an image. Memory effects due to pixel stabilisation can create a cross-shaped effect on mosaic images. This was reduced by sequentially masking the residual pixels as the mosaic is built up.
2.2 In outburst
Three epochs of ISO data were acquired to observe Cyg X-3 during a major flare on 1997 Jun 15, 18, 21; MJD 50613.7, 50615.4, 50619.9. Fig. 1 shows photometry at 8.3 GHz from the Green Bank Interferometer (GBI) with the times of our ISO observations in both quiescent and flaring states shown by bullet points, one epoch during quiescence, and three epochs during outburst. Each flaring epoch consisted of a stare observation with CAM using the LW1 filter (4.5 m), a mosaic observation with CAM using the LW10 filter (11.5 m) and a PHOT observation. Due to instrumental difficulties only the CAM data is presented. The procedure used in reducing the data was identical to the quiescent epoch.
3 Results
3.1 The Images
3.1.1 Digitized sky survey
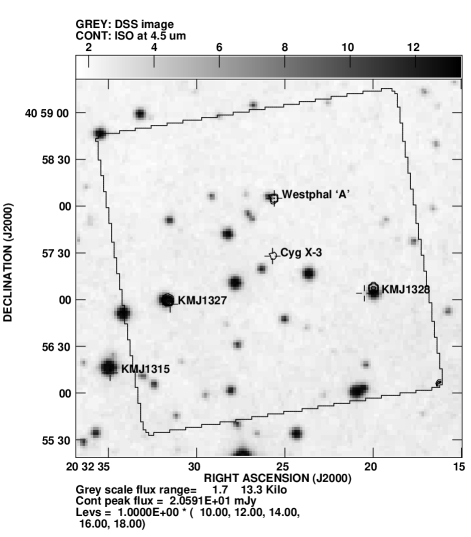
There is a striking difference between the ISO images and an optical digitized sky survey (DSS) image of the same region. The DSS image, Fig. 2, shows many more stars than are visible on the ISO images (Fig. 3). Cyg X-3 is undetected on the DSS plate as it has mag of extinction, and an estimated V band magnitude of (Wagner et al. 1990). The radio position of the source is represented by a cross, at the centre of the image. Stars marked KMJ 1315, 1327, 1328 (Kobulnicky, Molnar & Jones 1994) and star Westphal ‘A’ (Westphal et al. 1972) are all identified. KMJ 1328 is Westphal’s star ‘C’ with V = 15.03. One can see that, as is expected along the galactic plane, there is an abundance of sources at various magnitudes.
| Star | 4.5 m flux | 6.0 m flux | 6.75 m flux | 7.75 m flux | 11.5 m flux | 14.5 m flux |
|---|---|---|---|---|---|---|
| (mJy) | (mJy) | (mJy) | (mJy) | (mJy) | (mJy) | |
| KMJ 1327 | 35.4 2.2 | 50.2 3.6 | 30.9 5.1 | 30.6 4.9 | 8.9 3.0 | 6.5 2.7 |
| KMJ 1328 | 26.0 1.8 | 28.0 3.6 | 22.0 5.7 | 17.6 6.8 | 8.0 2.6 | 3.9 2.0 |
| Westphal et al. ‘A’ | 21.0 2.2 | 22.2 3.2 | 14.2 4.9 | 22.4 4.9 | 7.0 1.6 | 4.3 1.5 |
| Cyg X-3 | 18.2 2.5 | 31.1 4.1 | 20.6 4.9 | 24.3 3.9 | 15.2 1.6 | 18.7 1.8 |
3.1.2 ISOCAM–quiescence
In contrast to the DSS image, Fig. 3 shows contour images at the wavelengths 4.5–14.5 m. The images have been flat-fielded and dark-subtracted using the techniques described above. The data were exported and imaged using the NRAO Astronomical Image Processing System (AIPS), and a rotation of was applied to each image.
The absolute position of the ISOCAM images is unknown due to mis-alignment after a filter change. The co-ordinates of a source can be offset from the true position by as much as 2 pixels, or for our observations, 12 arcsec. Positions can be calculated from phase-referenced radio images, optical sources or catalogued sources. The positions were calculated from a radio observation of Cyg X-3 using MERLIN at 22 GHz with a 30 mas beam size (Ogley et al. 2000). The radio position has a Gaussian-fitted position of , , and the ISO positions of all sources are correlated to this.
In some images (6.0, 6.75 and 7.75 m in Fig. 3) there is a significant misalignment between the flat-field frame and the array which produces a gradient at the edge of the image. Other techniques to flat field the data produced larger errors. As none of the sources of interest are near to the affected region, the photometry presented below is still valid.
3.2 Photometry
3.2.1 Quiescence
Photometry on all four sources was performed using private code by Dr Siebenmorgen at Vilspa. An aperture of 12 arcsec was used on all sources and the flux densities are given in Table 3. Spectra of the four sources are shown in Fig. 4. No data have been de-reddened.


3.2.2 ISOCAM–outburst
Photometry of the sources in the three flaring epochs were obtained in the same way, as in the quiescent observations, with a 12 arcsec aperture. The results for the photometry is presented in Table 4, for all sources. Cygnus X-3 is clearly variable compared to the field stars.
| 4.5 m flux (mJy) | |||
| MJD | 50613 | 50616 | 50619 |
| Date 1997 Jun | 15 | 18 | 21 |
| Cyg X-3 phase | 0.85 | 0.64 | 0.54 |
| Cyg X-3 | 28.1 2.3 | 53.8 3.1 | 68.5 3.2 |
| KMJ 1327 | 27.7 1.9 | 32.9 2.4 | 32.6 2.5 |
| KMJ 1328 | 23.9 2.2 | 24.3 2.0 | 23.1 1.9 |
| Westphal et al. ‘A’ | 20.5 2.4 | 19.5 2.3 | 19.5 2.6 |
| 11.5 m flux (mJy) | |||
| Cyg X-3 | 10.6 0.6 | 78.2 0.8 | 40.4 0.8 |
3.3 Spectra
The Cyg X-3 data have been de-reddened using an extinction coefficient in the J band (1.25-m) of (Fender et al. 1996), and an extinction law of (Matthis 1990).
3.3.1 Quiescent spectrum
The de-reddened data for Cyg X-3 in quiescence are plotted in Fig. 5 along with UKIRT data from 1994 July 17 taken at orbital minimum (Fender et al. 1996; Fender, Bell Burnell & Pooley 2000). During the 1994 epoch observations a number of short-timescale flares occurred, but we have been careful only to use data at a time when the source was in quiescence. The spectrum shows a flattening at the longer wavelengths, with a spectral index of 3.0 between 1.25-2.2 m and 0.4 between 4.5-14.5 m.

3.3.2 Flaring spectra
Table 5 shows the de-reddened photometry and spectral indices for the three observations. These spectra are also plotted in Fig. 5. The UKIRT data from 1984 is from Fender et al. (1996) and is shown for two nights on 1984 Aug 07, 09. Figure 6 shows the flare spectrum with the quiescent spectrum subtracted.
| Epoch | 4.5 m flux (mJy) | 11.5 m flux (mJy) | |
|---|---|---|---|
| 50613 | 52.6 4.3 | 12.0 0.7 | 1.6 |
| 50616 | 101 6 | 87.8 0.9 | 0.1 |
| 50619 | 128 6 | 45.9 0.9 | 1.1 |

4 Discussion
4.1 The mass-loss rate
In the ISO regime the spectrum becomes like that predicted by Wright & Barlow (1975; hereafter WB75) for a non-accelerated, spherical wind. At long infrared wavelengths, WB75 showed that free-free emission in a wind would display an spectrum, while at longer radio wavelengths this is modified to produce a spectrum. Our de-reddened quiescent ISO fluxes can be fitted with a function with the parameters and to give a reduced value of 1.74. The parameter is the flux at 1 GHz and its value around 0 shows there is negligible expected free-free emission at radio frequencies.
There is no evidence for infrared emission from dust, consistent with the absence of dust in WNs demonstrated by Cohen (1995). This means that the dust responsible for the soft X-ray halo emission reported by Predehl & Schmitt (1995), at an angular separation of at least 100 arcsec, cannot lie close to Cyg X-3.
Using the WB75 model to obtain first-order wind parameters, the free-free emission flux is given by
| (1) |
where is the distance to the source in kpc, is the mass lost in the wind in yr-1, is the mean atomic weight per nucleon, is the velocity of the wind at infinity measured in km s-1, is the observing frequency in GHz, is the number of free electrons per nucleon, is the Gaunt factor and is the mean ionic charge. From our ISO data, the quiescent flux at a wavelength of 6.75m (44,400 GHz) is mJy. Substituting these values into equation (1) together with a distance of 10 kpc, and assuming a value for the Gaunt factor of unity, gives an expression for the mass-loss rate of
| (2) |
The velocity of the wind in Cyg X-3 has been investigated by a number of authors. van Kerkwijk et al. (1992; 1996) observed Cyg X-3 using a high resolution spectrograph on UKIRT. Their observations were scheduled over a range of orbital phases and from this they were able to obtain a wind velocity of km s-1. More recently, the flattened wind model of FHP99 gives an outflow velocity of km s-1. It is this latter value that we will adopt in this paper.
The other three variables which are unknown – and – are all related to the wind’s composition.
(a) A WN-type wind. Using a wind composition typical of late WR stars, , , (Waltman et al. 1996) and the flux at 6.75m (44,400 GHz) the mass-loss rate is yr-1.
(b) A partially ionised wind. The composition of this wind was used by Waltman et al. (1996) to explain the time difference between radio flares. This wind has the parameters of , , . The mass-loss rate using our infrared fluxes and these values is yr-1.
(c) A fully ionised wind. van Kerkwijk et al. (1996) used this type of wind when interpreting UKIRT data for the observations of the Wolf–Rayet-like lines. This wind has the parameters of , , and using our infrared fluxes a mass-loss rate of yr-1 is calculated.
We note that Crowther et al. (1995) have found averages of , , for Galactic WN(L) stars (WN7-8) which would infer a mass-loss rate of yr-1. For a WN(E) star (WN4-6) one might expect , , (e.g. Willis 1991) giving yr-1.
Thus we find that for a single temperature, non-accelerating, spherical wind and for a variety of ionisation states, the free-free emission causing the infrared fluxes in the ISO wavelengths is due to a wind with a mass loss rate of (0.4–2.9) yr-1.
This value for the mass loss rate is towards the upper end of the range observed for (single) WR stars, and is slightly higher than that predicted by Waltman et al. (1996) to be responsible for the delay between radio emission at a range of frequencies. However, it is slightly lower than is predicted by van Kerkwijk et al. (1996) for their interpretation of the short wavelength infrared fluxes. Results from both papers together with our fluxes are given in Table 6.
More significantly, there is a discrepancy in the value of derived from the orbital period change and the value from our ISO results. Using the relationship and a value for of s s-1, Kitamoto et al. (1995) calculated a value of where is the total system mass assumed to be of the order . This is an order of magnitude lower than that from our ISO results . This difference between derived from the orbital period change, and derived from thermal emission observations (with the latter being the larger) is not unique to Cyg X-3. The mass-loss rate for the binary V444 Cyg (WR139) has been calculated to be and M⊙ yr-1 by the method and thermal emission method respectively (Underhill et al. 1990; Prinja et al. 1990).
| Method | |||
| yr-1 | |||
| Radio photospheres100footnotetext: 1 Waltman et al. (1996) | |||
| This paper | |||
| Near-IR fluxes200footnotetext: 2 van Kerkwijk et al. (1996) | – | – | |
| Orbital period change300footnotetext: 3 Kitamoto et al. (1995) | 0.06 | – | – |
4.1.1 from - an examination of assumptions
In obtaining from the ISO data we have assumed that the wind is isothermal, at a constant velocity, shows spherical symmetry, stationarity and homogeneity. We have further assumed that the free-free flux is not seriously contaminated by stars Z and D identified on the Cyg X-3 finder chart and within the ISO pixel size (Fender & Bell Burnell 1996) nor by synchrotron emission from the tail of the radio-mm spectrum. The agreement with the Wright and Barlow model suggests that these assumptions (with the possible exception of spherical symmetry) are reasonable. We have assumed a distance of 10 kpc to the source; since scales as , to effect a 10-fold reduction in the mass-loss rate, the distance would have to reduced to 2 kpc. The extinction to Cyg X-3 is uncertain with . This corresponds to range of extinction at 6.75 m of 0.26-0.43, and an uncertainty of only 10 per cent in the value of the flux.
We have also assumed that the Gaunt factor, , is unity. In fact it depends on , and the observing frequency, and occurs in the expression for as . The equation for the Gaunt factor given by Spitzer (1962), and subsequently used by Leitherer & Robert (1991) is valid for , where is the plasma frequency. This condition is satisfied over the range of parameters we use here, and taking extreme values for the temperature of 10,000 to 350,000 K. Spitzer’s equation gives values of ranging from 3.4 to effectively zero (at the lowest temperature and highest ). Alternatively Sutherland (1998) determines the Gaunt factor for the spectral range submillimetre to hard X-ray and for temperatures from 10 to K. We believe that in his table 2 the labelling of the rows and columns has been interchanged, and that figures 2b and 2c have been switched. Sutherland’s work then gives Gaunt factors that range from 1.5 to 3.2. Sutherland considers photoionisation (which may be more appropriate to Cyg X-3) as well as collisional ionisation and shows that the photoionisation figures for the Gaunt factor are typically a factor of 2 lower. Our assumption that the Gaunt factor is unity well represents the middle of the range obtained, but it is uncertain by a factor of .
Nugis, Crowther & Willis (1998) model the mass-loss rate in a wind that is clumped, and in which both the ionisation structure and the clumping changes with radial distance. Selecting values for their free parameters that best fit for each star the flattening spectral slope from infrared to radio, they obtain mass-loss rates for clumped winds for 15 WN stars. There is considerable scatter in their results, but they obtain an average of . In other words, their clumpy wind model on average reduces the value of to of the value. Assuming Cygnus X-3 is close to average, then again this modification alone is insufficient to explain the discrepancy.
FHP99 show that the most likely interpretation of their infrared spectra and their observation of an orbital modulation of V/R involves a non-spherical wind, with a flattened, disc-like enhanced wind, probably in the plane of the binary. They note that this also reconciles the high infrared emissivity with an optical depth to the X-ray source that remains small (as long as the system is not viewed edge-on). Adopting their model of an inclined disc of enhanced wind, the Gorenstein (1975) approximation suggests the maximum X-ray column observed is consistent with a maximum value of yr-1 along the line of sight to the X-ray source. If the disc-wind has a solid angle of 10 per cent of then, to be consistent with the ISO data and maximum column, a mass-loss rate of yr-1 sterad-1 in the disc-wind is required; for 25 per cent of it is yr-1 sterad-1; and for 50 per cent of it is yr-1 sterad-1 with outside the disc; i.e. disc density enhancements of 100, 40 and 20 respectively.
We compare these results with previously reported theoretical and observational work on deviations from spherical symmetry and density enhancements. The pioneering work of Schmid-Burgk (1982) demonstrated that deviations from spherical symmetry did not change the spectral slope but led to over-estimates of the mass loss rate. However, the maximum correction factor found was only a factor of 2, for a pancake (disc) with a 10 to 1 aspect ratio. Ignace, Cassinelli & Bjorkman (1996) investigated density enhancements caused by rotation. For a WN5 wind their model found a density approximately 3 times greater than the global average in an equatorial cone of 10 degrees half-angle (or pole-to-equator density ratio of about 6). Rotation at only 10 per cent of critical was required.
Harries, Hillier & Howarth (1998) found that 15-20 per cent of WR stars have significant polarization, which they attribute to global wind asymmetries, found only in the fastest rotators. They also found that these stars have the highest values of . They postulate that these stars have equator to pole density ratios of 2 or 3 (with scaling linearly with density). St Louis et al. (1995) propose a sectored wind structure for the WN star WR6. They find the wind divides roughly 50:50 into fast and slow wind regions, with the higher continuum fluxes coming from the hotter, higher speed regions. Radio imaging of the WN8 star WR147 (Williams et al., 1997) report a wind ‘shape’ with a 3 to 2 aspect ratio. There have been suggestions of a disc in the WR6 star WR134 - see Vreux et al. (1992), and references therein. Nota et al. (1995) report a bipolar outflow in the nebula around the WN8 star WR124, with an opening angle between 30 and 45 degrees. The binary nature of Cyg X-3 is likely to create deviations from spherical symmetry, as proposed originally by van Kerkwijk (1993) and for WR140 by Williams et al. (1990). The disc configuration reported by White & Becker (1995) is disputed by Harries et al. (1998).
If the WR star’s rotation is tidally locked to the 4.8 h orbital period, then it will be rotating at close to its critical velocity and an equatorial enhancement of the mass loss rate is likely. We conclude that deviations of the wind from spherical symmetry need to be taken into consideration. Ignoring such asymmetry tends to overestimate the the mass-loss rate. However, to be consistent with the visibility of the X-ray source the density contrast required by our result appears to be large, and we are not aware of any work quantifying the overestimate for such large disc density enhancements.
4.1.2 from - an examination of assumptions
To obtain the total stellar mass-loss rate which drives the orbital changes any other mass-loss rates occurring need to be added to this value of wind mass-loss rate. The X-ray luminosity of Cyg X-3 implies an accretion rate on to the compact object of yr-1, which is small compared with the mass lost through the wind. Mass will also be lost into the radio jets, but this is an uncertain quantity, and the mass in the jets could be anything between 0.1 to 100 per cent of the in-flowing mass (Fender & Pooley 1998, 2000). These additional masses are in the sense to exacerbate the problem.
In obtaining from several other assumptions are made: that there is no loss of angular momentum other than the specific orbital angular momentum of the WR star carried away by the wind; that the rotating bodies are rigid; that the 4.8-h modulation, whatever it is, is rigidly locked to the orbital period; that the orbital period is 4.8-h, and not some multiple of that figure; that the eccentricity is zero; and that there are no other dynamical effects (e.g. gravitational radiation) or torques (e.g. magnetic) affecting the value of .
The assumption that the eccentricity is small seems justified - given the amount of circumstellar matter a circular orbit seems likely, and no change in the light curve which could be attributed to precession has been observed. For convenience we adopt . It seems likely that 4.8 h is the fundamental period, but until its nature is understood there remains the possibility that the 4.8 h modulation is not rigidly tied to the orbital period and that the observed is not accurately that of the binary system.
Additional angular momentum could be lost through the jets, or through magnetic torques, for example, and ignoring such losses would cause to be underestimated.
Gravitation radiation results in the orbital size shrinking, so neglect of this effect will cause the due to the mass loss to be underestimated. The effect is most extreme for the fastest orbital velocities which occur for the most massive components (assuming the eccentricity is zero). Taking a Wolf-Rayet mass of 10 and a black hole mass of 40 , , or about 10 per cent of the observed . If the orbital eccentricity were 0.5, the effect would be approximately 5 times larger, so although gravitational radiation produces an effect with the correct sign, it is not probably large enough to explain the discrepancy. Orbital motion in a viscous medium (the wind) will also cause the orbit to shrink.
It is known that tidal effects in early-type stars give rise to gravity waves which are radiatively damped, leading to circularisation of elliptical orbits and the synchronisation of orbital and stellar rotation rates (Kumar & Qutaert 1998). Kumar and Qutaert show that if the stellar rotation rate is less than the orbital rotation rate (strictly periastron rate), is negative. If we assume the Wolf–Rayet star rotates like its predecessor O star, then its rotational period would be a factor 10-20 times longer than the (current) orbital period. Tidal forces will presumably have spun it up; if it is now (close to) synchronised then for a star it will have a mean equatorial velocity of km s-1 and, assuming a mass of 10 , be rotating at 95 per cent of its critical velocity. It seems likely that there have been tidal forces which have tended to contract the orbit and diminish the observed , but in the absence of information about the current rotational period of the Wolf–Rayet we are unable to estimate the current magnitude of this effect.
In summary, there are several very probable effects which could cause to be underestimated - namely unrecognised sources of angular momentum loss, tidal effects, and to a lesser extent energy loss through viscous drag and gravitational radiation. Of the two methods of determining the mass loss rate, this seems to have the larger number of uncertainties.
4.2 Flare data
It is clear from the observations in 1997 June (Fig. 5 & 6) that the ISO data reveal bright flaring at 4.5 and 11.5 m at the same time as enhanced radio and X-ray activity (while not presented here, the X-ray monitoring data, which reveal an X-ray bright state at this time, are presented in FHP99). In addition, the spectrum appears to become flatter (although we caution that the lack of absolute simultaneity of the observations in the different filters adds additional uncertainties to the interpretation of spectral indices). This flattening is in qualitative agreement with the observations of Fender et al. (1996, 2000) who find that during both rapid (minutes timescales) and more gradual (days) variability, Cyg X-3 generally becomes redder in the infrared as it brightens.
While Fender et al. (1996) interpret the flaring component from Cyg X-3 in terms of thermal free-free emission from a hot ( K) gas, infrared oscillations from GRS 1915+105 (Fender & Pooley 1998 and references therein) have been interpreted as being synchrotron in origin. Either way, the rapid, large-amplitude, broad-band variability in the infrared fluxes during outburst periods implies the occurrence of extremely violent processes on relatively small physical scales. While the timescales do not preclude a simple change in the brightness of the thermal (wind) emission, the significant spectral flattening appears to rule this out. Instead, similarly to GRS 1915+105, Cyg X-3 appears to display an approximately flat-spectrum () component during outbursts. This may be related to the flat spectral component now also known to be present in Cyg X-1 (Fender et al. 2000). The nature of this component is uncertain, but it appears to be related to jet formation, and possibly to instabilities in the accretion flow/disc, at least in GRS 1915+105. In summary, while there may be variability in the strength of the underlying thermal (wind) component, we believe the additional flux observed in outburst to be dominated by a variable, flat-spectrum component which is probably associated with the jets.
5 Conclusions
We report the first quiescent and flaring 4-16 m observations of Cygnus X-3.
The quiescent spectrum is a continuation of the shorter wavelength IR spectrum, and fits well the WB75 model for thermal free-free emission from a wind. We obtain a mass loss rate, assuming spherical symmetry of yr-1, and note that while this is consistent with other determinations, it is an order of magnitude larger than both the mass loss rate required to derive the change in orbital period (assuming of the order ), and the mass loss rate expected from the hydrogen column density to the X-ray source. These measurements are based on assumptions, which have been scrutinised carefully; while we can identify a number of areas where factors of a few can be gained, we have been unable to identify a single area where a factor of ten can be found. We agree with the conclusion of FHP99 that the wind is most likely spherically asymmetric, but if this is the only effect operating, large disc density enhancement factors are required. There are several phenomena which could cause to be underestimated; we regard this determination of to be less reliable.
During radio and X-ray outburst, the broadband infrared spectrum shows rapid variability and a spectral flattening associated with increased flux densities. This is in agreement with what is seen in the near-IR during rapid (minutes) flaring events (Fender et al. 1996). Similar (but not identical) near-IR events observed from GRS 1915+105 appear to be associated with jet formation episodes. The emission mechanism responsible for this flat spectral component remains uncertain; both free-free and synchrotron emission have been proposed already in the literature, and await detailed studies to test their viability. Whatever the origin of this component, it seems likely that it is associated with hot gas in the jet from the system, which naturally explains its emergence during periods of enhanced radio (jet) activity.
6 Acknowledgments
The authors wish to thank staff at the ISO data centres at the Rutherford Appleton Laboratory in the UK, Saclay in France and Vilspa in Spain. The authors are especially grateful for the dedication of Joris Blommaert and Ralph Siebenmorgen at Vilspa for their help with reduction of the data. SJBB thanks Princeton University for hospitality while this paper was being written.
These data are based on observations with ISO, an ESA project with instruments funded by ESA Member States (especially the PI countries: France, Germany, the Netherlands and the United Kingdom) with the participation of ISAS and NASA. The ISOCAM data presented in this paper was analysed using ‘CIA’, a joint development by the ESA Astrophysics Division and the ISOCAM Consortium. The ISOCAM Consortium was led by the ISOCAM PI, C. Cesarsky, Direction des Sciences de la Matière, CEA, France. MERLIN is a national facility operated by the University of Manchester on behalf of PPARC. The Green Bank Interferometer is a facility of the National Science Foundation operated by the NRAO in support of NASA High Energy Astrophysics programs.
References
- [1] Bohannan B., Crowther P.A., 1999, ApJ, 511, 374
- [2] Cesarsky C.J. et al., 1996, A&A, 315, L32
- [3] Cherepashchuk A.M., Moffat A.F.J., 1994, ApJ, 424, L53
- [4] Cohen M., 1995, ApJ Suppl, 100, 413
- [5] Crowther P.A., Hillier D.J., Smith L.J., 1995, A&A, 293, 403
- [6] Ergma E., Yungelson L.R., 1998, A&A, 333, 151
- [7] Fender R.P., Bell Burnell S.J., 1996, A&A, 308, 497
- [8] Fender R.P., Pooley G.G., 1998, MNRAS, 300, 573
- [8a] Fender R.P., Pooley G.G., 2000, MNRAS, in press (astro-ph/0006278)
- [9] Fender R.P., Bell Burnell S.J., Williams P.A., Webster A.S., 1996, MNRAS, 283, 798
- [10] Fender R.P., Bell Burnell S.J., Pooley G.G., 2000, in prep
- [11] Fender R.P., Hanson M.M., Pooley G.G., 1999, MNRAS, 308, 473 (FHP99)
- [12] Fender R.P., Pooley G.G., Durouchoux P., Tilanus R.P.J., Brocksopp C., 2000, MNRAS, 312, 853
- [13] Giaconni R., Gorenstein P., Gursky H., Waters J., 1967, ApJ, 273, L119
- [14] Gorenstein P., 1975, ApJ, 185, 95
- [15] Harries T.J., Hillier D.J., Howarth I.D., 1998, MNRAS, 296, 1072
- [16] Ignace R., Cassinelli J.P., Bjorkman J.E., 1996, ApJ, 459, 671
- [17] Kessler M.F. et al., 1996, A&A, 315, L27
- [18] Kitamoto S., Kawashima K., Negoro H., Miyamoto S., White N.E., Nagase F., 1994, PASJ, 46, L105
- [19] Kitamoto S. et al., 1995, PASJ, 47, 233
- [20] Kobulnicky H.A., Molnar L.A., Jones T.J., 1994, AJ, 107, 1433
- [21] Kumar P., Qutaert E.J., 1998, ApJ, 493, 412
- [22] Leitherer C., Robert C., 1991, ApJ, 377, 629
- [23] Mason K.O., Córdova F.A., White N.E., 1986, ApJ, 309, 700
- [24] Mathis J.S., 1990, ARA&A, 28, 37
- [25] Matz S.M., 1997, Proc 4th Compton Symposium, AIP conf. ser. 410, 808
- [26] Mioduszewski A.J., Hjellming R.M., Rupen M.P., Waltman E.B., Pooley G.G., Ghigo F.D., Fender R.P., 1998, ASP Conf. Series, 144, 351
- [27] Newell S.J., 1996, PhD thesis, Univ. of Manchester
- [28] Newell S.J., Garrett M.A., Spencer R.E., 1998, MNRAS, 293, 17
- [29] Nota A., Clampin M., Sirianni M., Greenfield P., Golimowski D.A., 1995, in van der Hucht K.A., Williams P.M. eds ”Wolf-Rayet stars: binaries, colliding winds, evolution”, IAU Symp, 163, 78
- [30] Nugis T., Crowther P.A., Willis A.J., 1998, A&A, 339, 956
- [31] Ogley R.N., 1998, PhD thesis, The Open Univ.
- [32] Ogley R.N., Bell Burnell S.J., Newell S.J., 1997, MNRAS, 285, 187
- [33] Ogley R.N. et al. 2000, in prep
- [34] Predehl P., Schmitt J.H.M.M., 1995, A&A, 293, 889
- [35] Pringa R.K., Barlow M.J., Howarth I.D., 1990, ApJ, 361, 607
- [36] St-Louis N., Dalton M.J., Marchenko S.V., Moffat A.F.J., Willis A.J., 1995, ApJ, 452, L57
- [37] Schmid-Burgk J., 1982, A&A, 108, 169
- [38] Schmutz W., Geballe T.R., Schild H., 1996, A&A, 311, L25
- [39] Spencer R.E., Swinney R.W., Johnston K.J., Hjellming R.M., 1986, ApJ, 309, 394
- [40] Spitzer L., 1962, Physics of Fully Ionized Gases, 2nd ed, p148
- [41] Sutherland R.S., 1998, MNRAS, 300, 321
- [42] Underhill A.B., Grieve G.R., Louth H., 1990, PASP, 102, 749
- [43] van Buren D., Kong M., 1996, Technical report, IPAC, “ISOCAM-LW dark frames are simply related”
- [44] van Kerkwijk M.H., 1993, A&A, 276, L9
- [45] van Kerkwijk M.H. et al., 1992, Nat, 355, 703 authors
- [46] van Kerkwijk M.H., Geballe T., King D., van der Klis M., van Paradijs J., 1996, A&A, 314, 521
- [47] Vreux J.-M., Gosset E., Bohanann B., Conti P., 1992, A&A, 256, 148
- [48] Wagner R.M., Kreidl T.J., Martell P.J., Beaver J., 1990, in Jacoby G.H. ed, ASP Conf. Ser. Vol. 8, CCDs in Astronomy, Astron. Soc. Pac., San Francisco, p361
- [49] Waltman E.B., Fielder R.L., Johnston K.L., Ghigo F.D., 1994, AJ, 108, 179
- [50] Waltman E.B., Ghigo F.D., Johnston K.J., Foster R.S., Fielder R.L., Spencer J.H., 1995, AJ, 110, 290
- [51] Waltman E.B., Foster R.S., Pooley G.G., Fender R.P., Ghigo F.D., 1996, AJ, 112, 2690
- [52] Westphal J., Kristian J., Huchra J., Shectman S., Brucato R., 1972, Nat, 239, 134
- [53] White R.L., Becker R.H., 1995, ApJ, 451, 352
- [54] Williams P.M., Dougherty S.M., Davis R.J., van der Hucht K.A., Bode M.F., Setia Gunawan D.Y.A., 1997, MNRAS, 289, 19
- [55] Williams P.M., van der Hucht K.A., Pollock A.M.T., Florkowski D.R., van der Woerd H., Wamsteker W.M., 1990, MNRAS, 243, 662
- [56] Willis A.J., 1991, in van der Hucht K.A., Hidayat B. eds, “Wolf–Rayet stars and interrelations with other massive stars in galaxies.”, IAU Symp 143, 265
- [57] Wright A.E., Barlow M.J., 1975, MNRAS, 170, 41 (WB75)