00 \SetFirstPage00 \SetYear2000 \ReceivedDate1999 May 26 \AcceptedDate1999 May 26
The Red Stellar Contents of Three Selected Fields of The Local Group Dwarf Irregular Galaxy IC 1613.
Este es el resumen, lo cual debe de ser una traducción mas o menos fiel de lo que está escrito en el abstract.
Abstract
We present a moderately-deep photometry for three selected areas of the dwarf irregular galaxy IC 1613. The color-magnitude diagrams contain a mixture of red supergiants, asymptotic giant branch stars and the brightest red giant stars. The red supergiants are massive (20 - 25) and young — with ages between 8 and 25 Myr. The most important result is the evidence of the decreasing density of the intermediate age AGB population in the vicinity of the HII regions in the galaxy. We also find age differences between AGB stars in the main body of the galaxy and those near the HII regions in the North-East. The former span a range in ages between 1 and 10 Gyr, while the latter are younger than 1 Gyr. Using the period-luminosity relation derived by Madore & Freedman (1991) and magnitudes of the Cepheid variable V20, we calculated . The recently discovered Nova (King et al. 1999) was identified in Field III. Its presence of our images and its brightness questioned its classification as a nova.
keywords:
galaxies: Local Group – galaxies: individual: IC 1613 – galaxies: stellar content0.1 Introduction
Studies of bright stars in nearby galaxies provide a direct link to their history of star formation. Photometric investigations of red supergiants (RSG) and asymptotic giant branch (AGB) are of particular interest, as these stars probe the evolution during early and intermediate epochs.
Carrying out such studies at near-infrared (NIR) wavelengths have a number of advantages. NIR observations are less sensitive to both the reddening towards and within galaxies. They allow us to overcome the effects of line blanketing, which can affect the spectral energy distributions of moderately metal-rich giants at optical wavelengths. In addition, they are the best choice for determining bolometric corrections and for the analysis of the bolometric luminosity function of the luminous, cool evolved stars. Several recent studies of the red stellar content in nearby spiral and irregular galaxies exploiting these advantages include Davidge (1999: M 33), Davidge (1998: NGC 55, NGC 300, and NGC 7793), and Cioni et al. (1999: LMC).
Here, we present NIR observations of IC 1613. IC 1613 is a faint, irregular galaxy within the Local Group. Recently, Cole et al. (1999) studied the history of star formation in the central part of the galaxy using HST photometry. They found a dominant old stellar population — red giant branch and red clump stars, and a prominent sequence of intermediate age AGB stars. Cole et al. (1999) deliberately chose their region for study to avoid known HII regions. In this paper, we present photometry of the three selected areas of IC 1613. We chose our fields to extend the area covered by Cole et al. (1999) towards the active HII areas. The goal of this work is to analyze the bright, red stellar content and to determine the distance of IC 1613.
0.2 Observations and data reduction
We acquired our data with the “CAMILA” infrared camera attached to the 2.1-m telescope of the Observatorio Astronomíco National at ”San Pedro Martir”, México (Cruz-González et al. 1996). CAMILA is based upon a NICMOS3 ( pixels) detector. The scale was arcsec/pixel, which resulted in a field size of about . A set of frames was taken on October 13-15, 1998. The seeing during these observations was between with stable and very good photometric conditions. Ten UKIRT (Casali & Hawarden 1992) standard stars were observed during the observations. All three fields were obtained with equal exposure times of 960 sec.
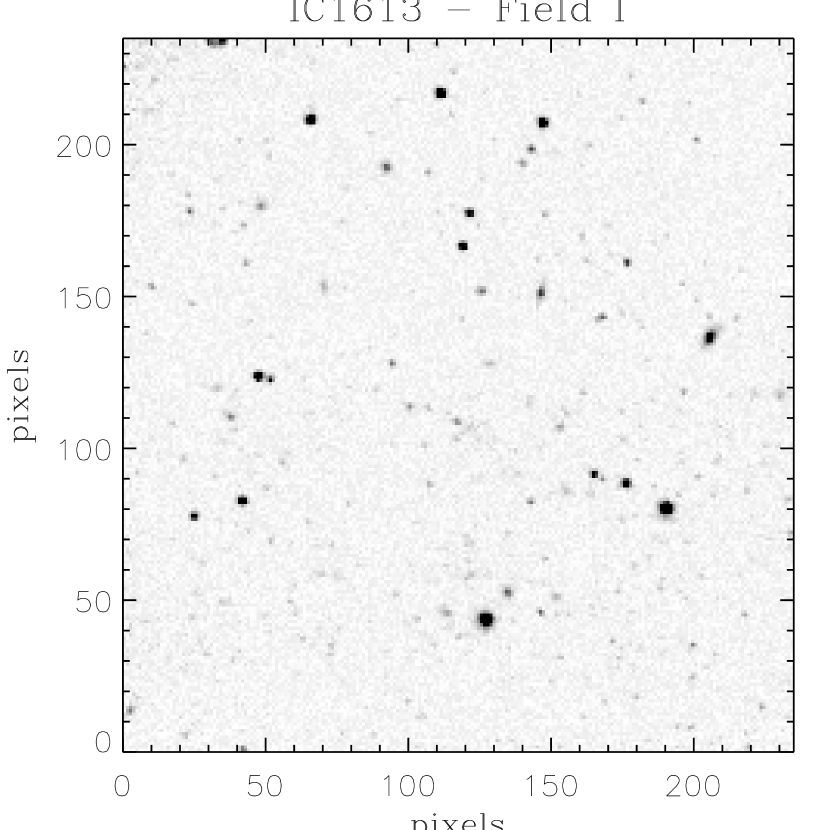
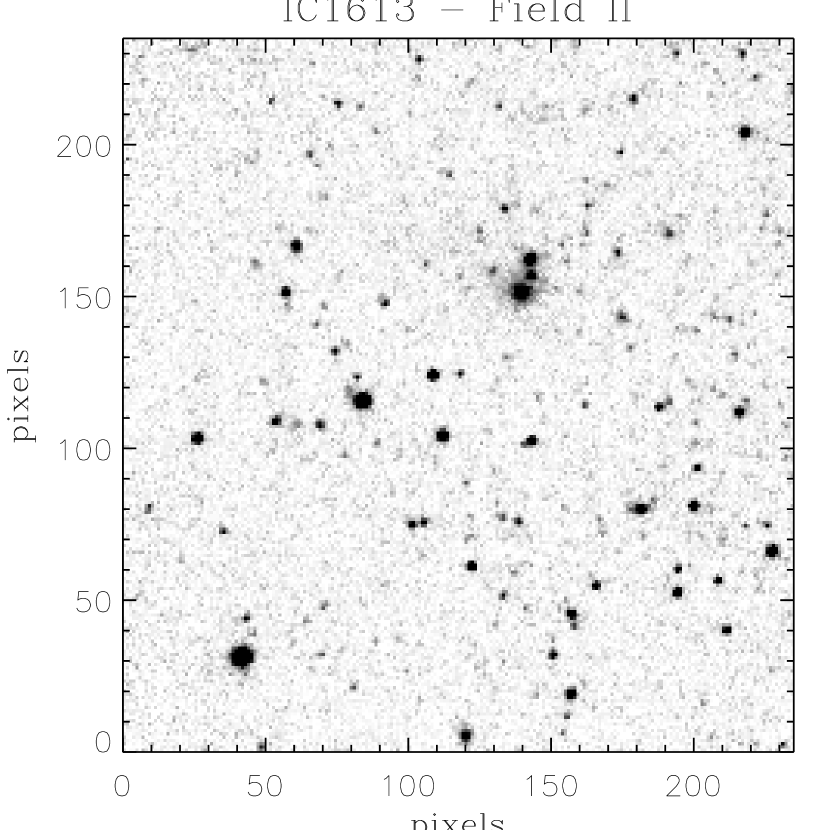
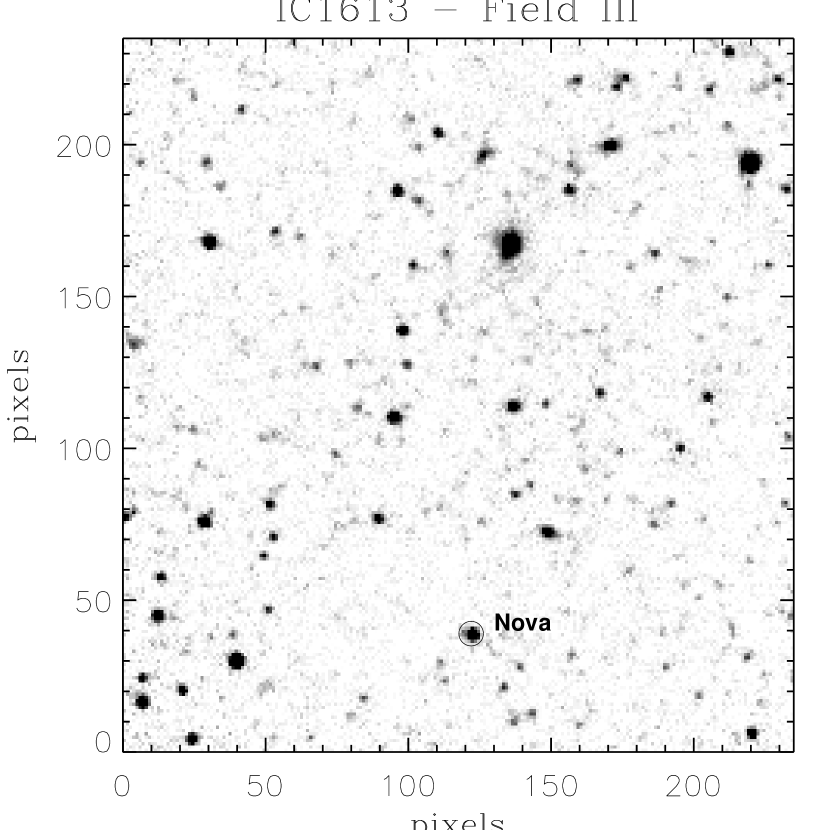
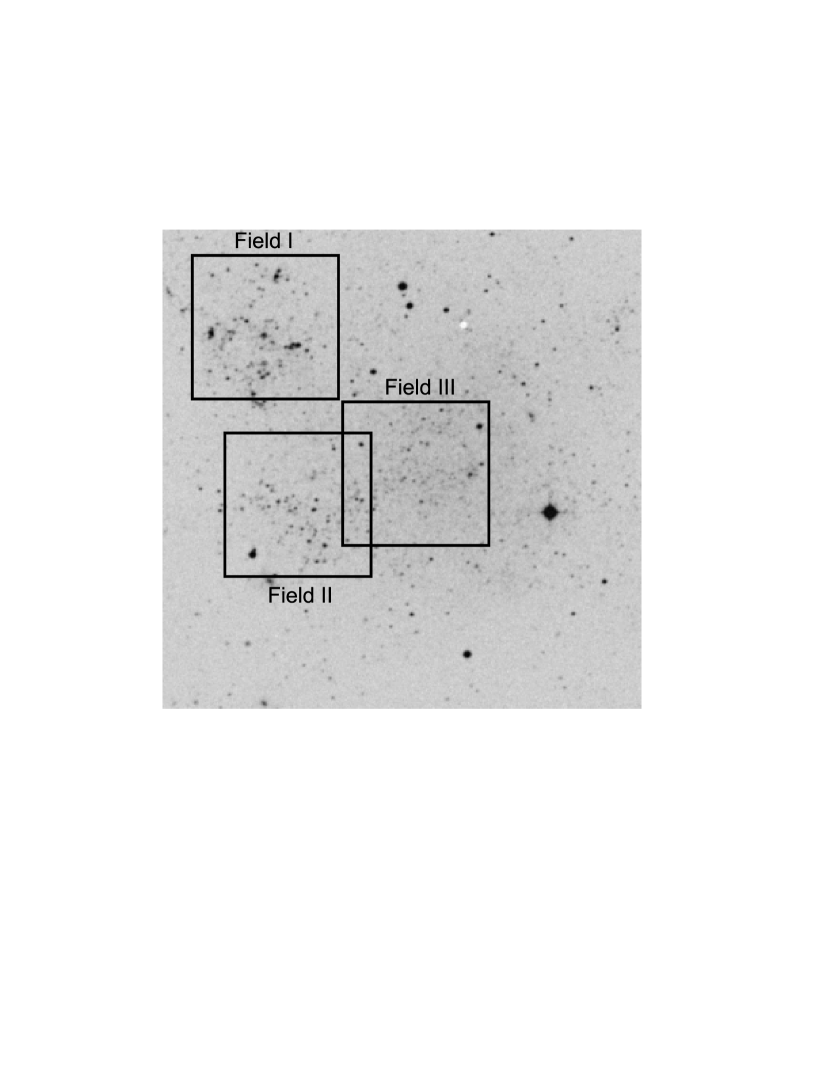
The IRAF data reduction package was used to carry out the basic image reduction. The final median-combined images of the fields are shown in Fig. 1, Fig. 2 and Fig. 3. The three fields are indicated on a print of a plate from STScl Digitized Sky Survey (Fig. 4). Field I is centered on the HII regions in the north-east quadrant of the galaxy where the most active ongoing star formation is occurring (Sandage 1971). Fields II and III were chosen to be within of the main body of IC 1613. There are six associations Hodge (1978) in Field I — A10, A11, A12 A13, A14 and A17, Field II include Hodge (1978) associations A8 and A9 and Field III include A5, A6 and A7.
The stellar photometry of the median-combined frames was performed with the pointspread function (PSF) fitting routine ALLSTAR available in DAOPHOT (Stetson 1993). The ALLSTAR magnitudes were calibrated against aperture photometry performed on selected stars which had neighbors subtracted. We then rejected all stars which had values of and the stars with formal errors from the PSF fitting greater than 0.25 in all frames. The instrumental values were transformed to the standard and system by means of the equations:
where and are the instrumental magnitudes, is the airmass and () is the color of the object. The errors are the statistical errors in the coefficients. The zero-point errors of the transformation are 0.02 in and 0.05 in .
The artificial star simulations necessary for the completeness correction are used to determine the measurement errors. The band ”input-output” mean differences between ”added” and ”recovered” artificial stars as a function of specified magnitude interval for Field I, Field II and Field III are given in Table 1. In column 5 and 6, 10 and 11, 15 and 16 are given mean differences between actual and measured magnitudes of synthetic stars recovered in specified interval of one magnitude and the error of the mean difference. The mean differences and errors in band are within the same intervals . In summary, the median scatter is smaller than 0.1 mag down to 17.5 mag and increases up to 0.2 in the faintest bins.
| Range | Field I | Field II | Field III | ||||||||||||
|---|---|---|---|---|---|---|---|---|---|---|---|---|---|---|---|
| 13-14 | 135 | 134 | 0.99 | 0.02 | 0.03 | 126 | 123 | 0.98 | -0.03 | 0.04 | 161 | 158 | 0.98 | 0.02 | 0.02 |
| 14-15 | 147 | 145 | 0.99 | 0.03 | 0.02 | 136 | 133 | 0.98 | -0.01 | 0.03 | 169 | 170 | 1.00 | -0.02 | 0.04 |
| 15-16 | 129 | 128 | 0.99 | 0.0 | 0.05 | 128 | 126 | 0.98 | 0.05 | 0.04 | 146 | 142 | 0.97 | 0.05 | 0.06 |
| 16-17 | 120 | 116 | 0.97 | 0.08 | 0.10 | 113 | 104 | 0.92 | 0.06 | 0.03 | 143 | 131 | 0.92 | 0.07 | 0.05 |
| 17-18 | 98 | 83 | 0.85 | 0.13 | 0.15 | 121 | 97 | 0.80 | 0.07 | 0.11 | 148 | 124 | 0.84 | 0.08 | 0.15 |
| 18-19 | 71 | 38 | 0.53 | 0.18 | 0.21 | 126 | 56 | 0.44 | 0.18 | 0.15 | 153 | 76 | 0.50 | 0.15 | 0.19 |
0.3 Completeness and field stars contamination
The artificial star technique (Aparicio & Gallart 1995) was used to investigate the crowding effects. Following step by step the procedure described in Aparicio & Gallart (1995) we generated the tables in and bands with artificial stars, which have realistic magnitudes and colors. Such prepared tables were used to generate the synthetic frames for the three investigated fields. They were processed in the same way as original frames. The process was repeated many times and in total 700 stars are analyzed for Filed I, 750 for Field II and 920 for Field III. In Columns 2, 3 and 4 (respectively 7,8 and 9 and 12,13 and 14 for Fields II and III) of the Table 1 are given total number of ”input” and ”output” stars and the ratio between them in band. In summary, the analysis of Table 1 show, that the degree of completeness is close to 100 per cent down to 16 mag in and can seriously affect our analysis for magnitudes fainted than 18 mag. As can be seen there is no significant differences in the completeness factors between the three investigated fields.

The luminosity functions (LF) for the three fields are shown in Fig. 5. The decrease in counts at the faint end also indicates that the incompleteness becomes significant when .
Field stars should not seriously affect the structure of the color-magnitude diagram because IC 1613 is situated far from the galactic plane (). The field star densities predicted by the Bahcall & Soneira (1980) model imply that the contamination from our Galaxy is negligible. We applied no correction for contamination by field star.
0.4 Color-magnitude diagrams
Fig. 6 shows the color-magnitude diagrams (CMD) of our three fields in IC 1613. Our final list contains 80 stars in Field I, 343 stars in Field II, and 505 stars in Field III.

The CMDs contain a mixture of red supergiants (RSGs), AGB stars, and the brightest red giant stars (RGB). Each field contains one or two stars with and , which are the very luminous RSGs, and delineate the peak of the RSG luminosity function. Close binaries whose components have similar magnitudes and colors will look like one star of the same color though brighter in magnitude. The brightest stars were inspected for blending effects on frames with much better scale - and seeing of . The frames were obtained on the 2-m Ritchey-Chretien telescope of the Bulgarian National Astronomical Observatory on September 15, 1999 with a Photometrics camera. No such occurrences were found. The presence of a population of bright RSGs is an indicator of recent star formation in all three fields in IC 1613.
In Field I we can see some deficit of stars redder than . The analysis of crowding effects (see Table 1) shows that there is no larger crowding in this field. Since Field I is centered on the HII regions of the galaxy the higher internal reddening can affect the stars. The ”mean” reddening of the area however determined by Georgiev et al. (1999) is . Assuming for Fields II and III (Cole et al. 1999) the resulting difference due to reddening is for color - the value much smaller than the observing effects. The photometry by Georgiev et al. (1999) centered on the same area as Field I can provide independent check of the observed number of the red stars in the infrared. The number of stars with and brighter than 21.5 is 92, which is in good agreement with the total number of corrected for completeness stars, obtained in Field I - 95.7. Of course, deeper photometry is necessary to confirm the observed in Field I deficit of stars redder than .
The stars between and and are also RSGs with lower brightness. When both RSGs and AGBs stars are present, although there is some color separation between them — AGB stars are generally redder than . At the faint limit of the CMDs, but still within the completeness limit of the photometry, the brighter red giants can be seen mixed among with the faintest AGB stars.
0.5 Age and Luminosity Function
To convert our observed color-magnitude diagrams to absolute magnitude and true color, we assumed a foreground reddening, a distance modulus and a metallicity of ( Georgiev et al. 1999), (Freedman 1988, Saha et al. 1992, Cole et al. 1999), and (Mateo 1998). The resulting color-magnitude diagrams are shown in Fig. 7. The isochrones for and yr, and for from Padua’s library (see Bertelli et al. 1994) are superimposed on the CMDs (Fig. 7).
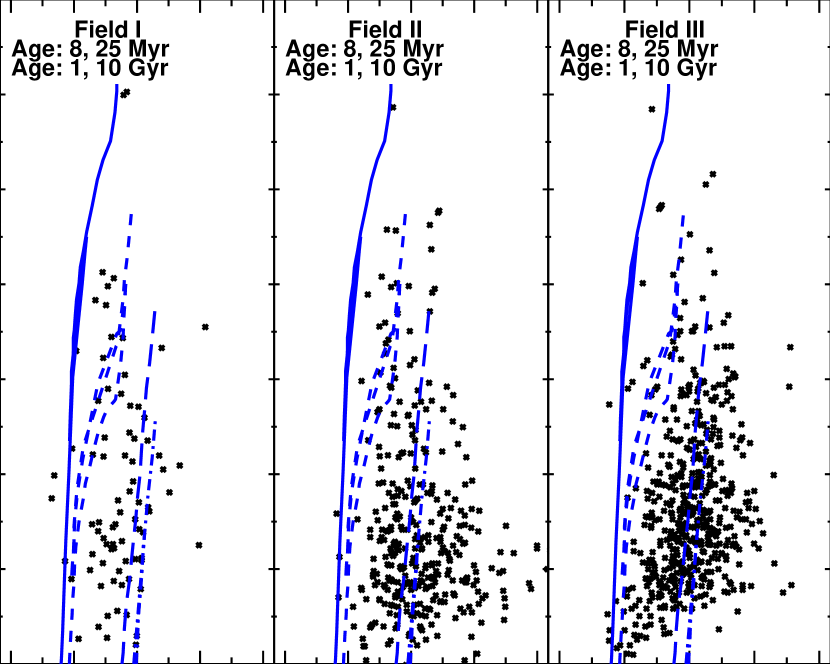
The isochrones superimposed upon Fig. 7 indicate that the brightest red supergiants in the three fields are very young — about 8 Myr. Georgiev et al. (1999) obtained 5 Myr for brightest red supergiants V32 and V38 in Field I, which is in good agreement. Cole at al. (1999) also found that in the center of IC 1613 the red supergiants are younger than a “few yr”. Fainter RSGs in IC 1613 have and are matched very well by a 25 Myr isochrone.

Most of the AGB stars in Fields II and III are several Gyr old. In Field I most of them are between the second and third isochrones, and thus are younger than 1 Gyr. As well known ( see for example Aparicio, 1999) the colors and life-times of AGB stars depend on the mass loss, bolometric correction and metallicity, which are difficult to parameterize. Without information of main sequence we will consider above determined range of AGB ages as a rough estimates.
To investigate the influence of the various metallicity on the AGB ages we overplot in Fig. 8 the isochrones for yr and for , and . Indeed, the metal poorer and metal richer AGB stars can present, but it is not possible to separate the metallicity from age effects using color-magnitude only.
To determine the tip of AGB stars we used the -band LFs. Looking at the differential LFs in Fig. 5 we can see the AGB tips at between 16.0 -16.5 in the three fields. To verify the reality of these edges we convolved the data with a Sobel edge-detection filter with width of the filter 0.2 (Lee et al. 1993, Sakai at al. 1996). The filter function outputs are shown as dashed lines in Fig. 5. The limited number of stars in Field I prevents us from drawing any conclusions. For Fields II and III however, there are peaks at and , respectively, which mark the tip of AGB. Given the reddening and distance modulus adopted above, this corresponds to approximately . This value is in agreement with the tip of the AGB found by interpolating between the isochrones in Fig. 7 for ages of 4-5 Gyr, confirming the reality of the AGB peaks in for Fields II and III.
The derived power-law exponent for the composite (Fields II and III) LF for magnitude interval is 0.51. Cole et al. (1999) found the slope of V-band luminosity function down to to be , which is in acceptable agreement.
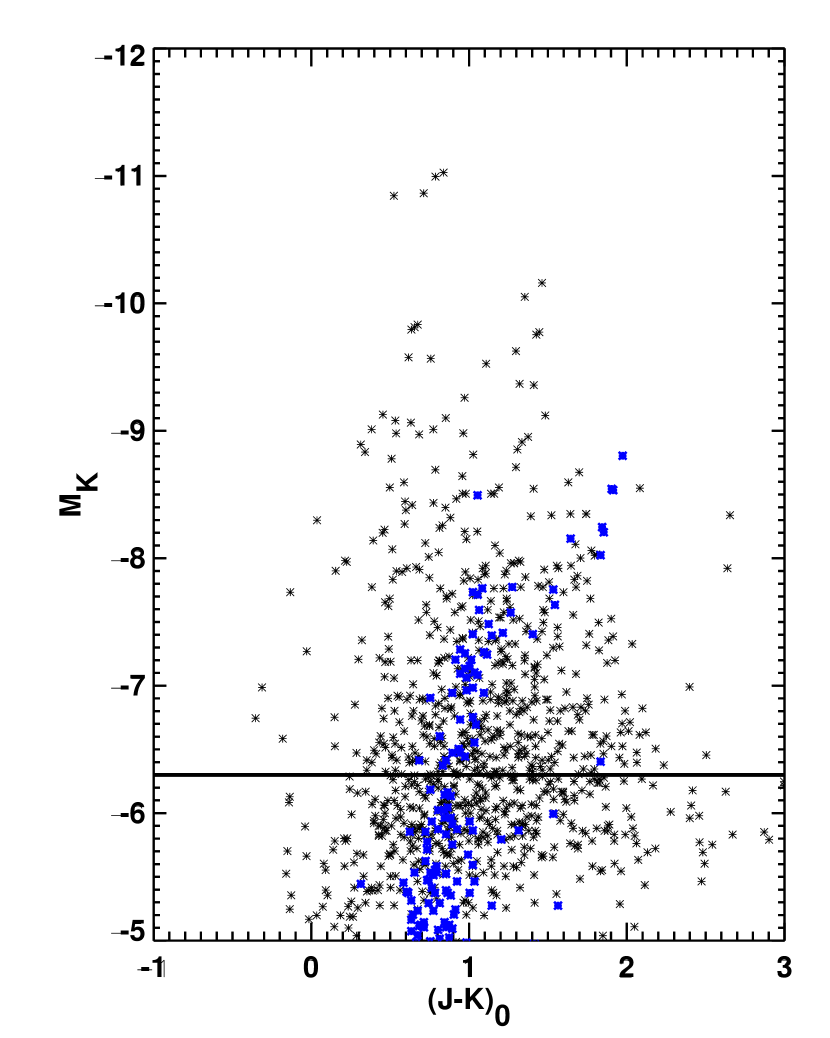
In Fig. 9, the stars from all three fields in IC 1613 are shown with overploted observations of 12 globular clusters in the Large Magellanic Clouds (Ferraro et al. 1995) (dark circles). The horizontal line is located at the separation threshold between AGB and RGB stars, as given by Ferraro et al. (1995). The globular clusters are a good match to our data, indicating that some long period variables should be located between . Taking into account Ferraro’s (1995) separation threshold between AGB and RGB stars, the tip of the RGB should be located around . The peaks at of Sobel edge-detection output in LFs of Fields II and III (Fig. 5) provide some support of this determination, but also can be due to incompleteness at fainter magnitudes. Unfortunately, the RGB stars are at the limit of our photometry and deeper photometry is necessary to investigate them in more detail.
0.6 Theoretical Hertzsprung–Russell diagrams and Variable stars
We needed to determine the effective temperatures () and bolometric corrections (BC) in order to locate the stars on the theoretical HRD. We used Costa & Frogel’s (1996) method to transform K magnitudes and colors into and . We first transformed our magnitudes and colors into the CIT system by means of the transformation equations for the set of filters in use at ”San Pedro Martir” observatory (eq. 1 and 2 from Ruelas-Mayorga 1997). Then, using the method outlined by Costa & Frogel (1996), we transformed our colors to the Johnson system and derived the bolometric correction for the magnitude, and . We used the distance modulus and reddening adopted above (Section 0.5). The resulting HRDs are shown in Fig. 10. The evolutionary tracks from Charbonnel et al. (1993) for were superimposed on the same plot.

The brightest stars in Field I, V32 and V38, have bolometric magnitudes of and masses of 20. These values are very different from those found using photometry (Georgiev et al. 1999), which are larger by mag in and 20. The largest sources of uncertainty in transformation to the theoretical plane are the uncertainties in colors. Adopting a maximum uncertainty in of mag, Costa & Frogel’s (1996) equations imply a maximum uncertainty of mag in and K in . Therefore, the differences in temperatures and bolometric magnitudes determined from optical and infrared photometry are much larger that the uncertainties due to the photometry or the transformation to the theoretical plane, and confirm the well-known fact that it is very unreliable to determine bolometric corrections for very red stars from data at optical wavelengths. The effective temperatures derived from our NIR data for V32 and V38 are approximately 4000 K, in good agreement with their M0Ia spectral class (Elias & Frogel 1985).
The brightest star in Field II also has a mass of 20, while the brightest star in Field III is more massive at 25. The fainter RSGs and brighter AGB stars in the magnitude range have masses of 12 to 15.
The only variable star in Field II is V20 — a Cepheid with and amplitude mag (Sandage 1971). The derived bolometric magnitude from our IR data is , the effective temperature 5000 K and 9. Two WR/O candidates were also identified in Field II (W2 and W3: Armandroff & Massey 1985, Azzopardi et al, 1988) but they are too faint for reliable measurements.
We have identified an object at the position of the recently discovered Nova (King et al. 1999) in Field III. On the our IR frames, taken on Oct. 15 1998, Nova 1999 has and . If this is the same object, its presence on our IR frames a year before its discovery bring its classification as a Nova into question. In the subsequent paper, we will discuss the light variations and spectrum of this peculiar object.
0.7 Distance to IC 1613
Using the apparent and magnitudes of the Cepheid variable V20 and period-luminosity (PL) relation, we can obtain the apparent distance moduli in J and K. Adopting Madore & Freedman’s (1991) and calibrations of the PL relation, based upon 25 Cepheids in the LMC, and the period found by Sandage (1971), we obtain distance moduli of and . These are in satisfactory agreement with Cole et al.’s (1999) determination of .
0.8 The Bolometric luminosity function
The bolometric LFs (not corrected for completeness) for our three fields in IC 1613 are compared in Fig. 11. All of the LFs have a discontinuity at , which characterizes the boundaries between RSG and AGB stars. In Fig. 11, a LF formed from the sum of the stars in the three fields is also shown. We would like to point out the lack of a discontinuity in the LF for the AGB stars in all three fields. The logarithmic LFs are linear for the AGB stars (), so they can be characterized by a power-law exponent. The derived by least squares fit exponent for the composite LF is 0.43.

0.9 Summary
In summary, we find substantial evolved stellar populations in our three fields in IC 1613, including the region of ongoing star formation. The brightest stars are massive (20 - 25) red supergiants with magnitudes between and . Based upon a comparison with the Padua isochrones (Bertelli et al. 1994), these brightest RSGs are very young, with ages between 8 and 25 Myr.
The main feature of the NIR CMDs is the rich intermediate age AGB population. In the central part of the galaxy (our Fields II and III), the tip of AGB stars can be located at . There is an indication of lack of ABG stars in Field I (centered on most active HII region of the galaxy) that are redder than . All of the AGB stars in Field I are younger than 1 Gyr, whereas those in the Fields II and III span ages from 1 to 10 Gyr. Using the PL relation derived by Madore & Freedman (1991) along with our and magnitudes for the Cepheid variable V20 we calculate a distance modulus . In Field III we identify an object at the position of the recently discovered Nova 1999 (King et al. 1999). Its presence in our IR frames one year before discovery indicate that this star is too bright to be a classical Nova.
Acknowledgements.
This work was performed while J.B. was a visiting astronomer in UNAM, Mexico under contacts CONACYT No. 27984E and DGAPA IN122298 and was supported in part by the Bulgarian National Science Foundation grant under contract No. F-812/1998 with the Bulgarian Ministry of Education and Sciences.References
- [1] Aparicio, A., Gallart, C. 1995, AJ, 110, 2105
- [2] Aparicio, A. 1999, Proceeding of IAU Symp.193 ”Stellar content of Local Group galaxies, ed. by P.Whitelok and R. Cannon, p. 304.
- [3] Bahcall, J., Soneira, R. 1980, ApJS, 44,173
- [4] Armandroff, T., Massey, P. 1985, ApJ, 291, 685
- [5] Azzopardi,M., Lequeux,J., Maeder,A. 1988, AA, 189, 34.
- [6] Bertelli, G., Bressan, A., Fagotto, F., Choisi, C., Nasi, E. 1994, AAS, 106, 275
- [7] Casali, M. , Hawarden, T. 1992, JCMT-UKIRT Newsletter, No. 3, p. 33 \adjustfinalcols
- [8] Cioni, M., Habing, H., Loup, C. et al. 1999, Proceeding of IAU Symp.193 ”Stellar content of Local Group galaxies, ed. by P.Whitelok and R. Cannon, p. 244.
- [9] Charbonnel, C., Maynet, G., Maeder, A., Schaller, G., Schaerer, D. 1993, AAS, 101, 415
- [10] Cole, A., Tolstoy, E., Gallagher, J., Hoessel, J., Mould, J et al., 1999, AJ, 118, 1657
- [11] Costa, D., Frogel, G. 1996, AJ, 112, 2607
- [12] Cruz-González, I.,Salas, L., & Ruiz, E. 1996 , Manual de Usuario 96-02, Instituto de Astronomía, UNAM
- [13] Davidge, T. 1998, astro-ph/9803274
- [14] Davidge, T. 1999, astro-ph/9910333
- [15] Elias, J., Frogel, J. 1985, AJ, 289, 141
- [16] Ferraro, F., Fusi Pecci, F., Testa, F., Greggio, L., Corsi, C. et al. 1995, MNRAS, 272, 391
- [17] Freedman,W.1988, AJ, 96, 1248
- [18] Georgiev, L., Borissova, J., Rosado, M., Kurtev, R., et al. 1999, AAS, 134, 21
- [19] Hodge, P. 1978, ApJS, 37, 145
- [20] King J. Y. ,Modjaz, M. & W. D. Li 1999, IAUC, No. 7287
- [21] Lee, M., Freedman, W., Madore, B. 1993, ApJ, 417, 553
- [22] Madore, B., Freedman, W. 1991, PASP, 103, 667
- [23] Mateo, M. 1998, ARA&A, 36, 435
- [24] Ruelas-Mayorga, A. 1997, RevMexxAA, 33, 9
- [25] Saha, A., Freedman, W., Hoessel, J., Mossman, A. 1992, AJ, 104, 1072
- [26] Saha, A., Hoessel, J., Krist, J., Danielson, E. 1996, AJ, 111, 197
- [27] Sakai, S., Madore, B., Freedman, W. 1996, ApJ, 461, 713
- [28] Sandage, A. 1971, ApJ, 166, 13
- [29] Santangelo, M.,M. 1999, IAUC No. 7289
- [30] Stetson, P. 1993, User’s Manual for DAOPHOT II.