An XMM-Newton detection of the z = 5.80 X-ray weak quasar SDSSp J104433.04–012502.2
Abstract
We report on an XMM-Newton observation of the most distant known quasar, SDSSp J104433.04–012502.2, at . We have detected this quasar with high significance in the rest-frame 3.4–13.6 keV band, making it the most distant cosmic object detected in X-rays; counts were collected. SDSSp J104433.04–012502.2 is notably X-ray weak relative to other luminous, optically selected quasars, with and a 3.4–13.6 keV luminosity of erg s-1. The most likely reason for its X-ray weakness is heavy absorption with cm-2, as is seen in some Broad Absorption Line quasars and related objects; we discuss this and other possibilities. High-quality spectroscopy from 0.95–1.10 m to search for blueshifted C iv absorption may elucidate the origin of the X-ray weakness.
1 Introduction
X-ray observations of quasars at the highest redshifts should reveal the physical conditions in the immediate vicinities of their central black holes. Measurement of the intrinsic X-ray continuum’s shape, normalization relative to the rest of the spectral energy distribution, and variability can provide information on the inner accretion disk and its corona, and thus ultimately about how the black hole is being fed. There are already some reports that the X-ray continuum shapes of quasars may evolve with redshift at (e.g., Blair et al. 2000; Vignali et al. 1999); these intriguing results require further study and extension to the highest redshifts. In addition, X-ray absorption measurements can probe material in the environments of high redshift quasars. For example, the fraction of radio-loud quasars (RLQs) with heavy intrinsic and/or associated X-ray absorption (i.e., cm-2) appears to rise with redshift (e.g., Fiore et al. 1998; Elvis et al. 1998; Reeves & Turner 2000). The absorbing gas in RLQs may be circumnuclear, located in the host galaxy, or entrained by the radio jets.
At our knowledge about the X-ray properties of quasars is unfortunately quite limited (e.g., Kaspi, Brandt & Schneider 2000 and references therein). To date it has only been possible to obtain X-ray spectra for four quasars. All four are radio-loud blazars in which the X-ray emission is probably dominated by jets; three of these appear to have X-ray absorption, as would be expected from the trend mentioned above (Moran & Helfand 1997; Boller et al. 2000; Fabian et al. 2000; Yuan et al. 2000). The more representative radio-quiet quasars (RQQs) have been too X-ray faint to allow spectroscopy to date; indeed, only 7 optically selected quasars have even been detected in X-rays at . At present, measurements of the X-ray spectral shapes of RQQs are scarce and of limited statistical quality above (e.g., Bechtold et al. 1994; Vignali et al. 1999).
We have started a project to determine the X-ray properties of the highest redshift quasars using the new generation of X-ray observatories. Our main focus is on quasars with discovered by the Sloan Digital Sky Survey (SDSS; see York et al. 2000). The SDSS multicolor selection method provides a uniform sample of quasars that have been consistently selected in a well-defined manner, and more than 100 SDSS quasars at are expected over the next five years (Fan 1999; Schneider 1999). After the recent discovery of SDSSp J104433.04–012502.2 (hereafter SDSS 1044–0125; Fan et al. 2000), an optically bright RQQ (AB; ) at , we proposed an XMM-Newton Target of Opportunity observation of this object. From the Eddington limit, SDSS 1044–0125 appears to contain a black hole formed within a billion years of the Big Bang (we adopt km s-1 Mpc-1 and throughout; note this cosmology differs from those of Fan et al. 2000). The quasar’s luminosity density at 2500 Å is erg s-1 Hz-1, about twice that of 3C 273 (we adopt an optical continuum slope of for SDSS 1044–0125 throughout; see Schneider, Schmidt & Gunn 1991 and Fan et al. 2001). Typical X-ray to optical flux ratios for optically selected quasars of similar luminosity (Kaspi et al. 2000) suggested that XMM-Newton might be able to obtain a spectrum of this object in a reasonable integration time. This paper describes the analysis and interpretation of the XMM-Newton data.
2 Observations and data analysis
2.1 Basic analysis
SDSS 1044–0125 was observed by XMM-Newton111See the XMM-Newton Users’ Handbook at http://xmm.vilspa.esa.es/user/uhb/xmm_uhb.html. Also see Jansen (1999). starting on 2000 May 28; the observation was continuous, and the quasar was placed at the aim point. Here we will focus on the results from the European Photon Imaging Camera (EPIC) positive-negative junction (p-n; 40.0 ks exposure) and Metal Oxide Semiconductor (MOS; 32.5 ks exposures each) detectors; the thin optical blocking filters were used with these detectors. The data were processed with the XMM-Newton Science Analysis System (SAS) Version 4.1 pipeline.222See the XMM-Newton SAS documentation at http://xmm.vilspa.esa.es/sas/. Also see Page (1998). We have screened the resulting events using only event patterns 0–3/0–12 for the p-n/MOS (see §21 of Gondoin 2000), and we have removed 7.4/9.7 ks of p-n/MOS data where the particle background showed flares.
The screened events from the above reduction were analyzed using the SAS and the Chandra Interactive Analysis of Observations (CIAO) software package.333See the CIAO documentation at http://asc.harvard.edu/ciao/. Also see McDowell, Noble & Elvis (1998) and Elvis et al., in preparation. We made images for each of the detectors in the 0.5–2.0 and 2–7 keV bands; these bands provide optimal signal-to-noise ratio for the study of faint sources and cover the 3.4–48 keV rest-frame continuum. We improved the astrometry of these images using the MOS-detected H ii/Seyfert galaxy Mrk 1261 (e.g., Osterbrock & Phillips 1977) as well as 13 sources from the Palomar Optical Sky Survey; both a rotation and a shift were required. We consider our absolute astrometry to be accurate to within .
2.2 Source detection
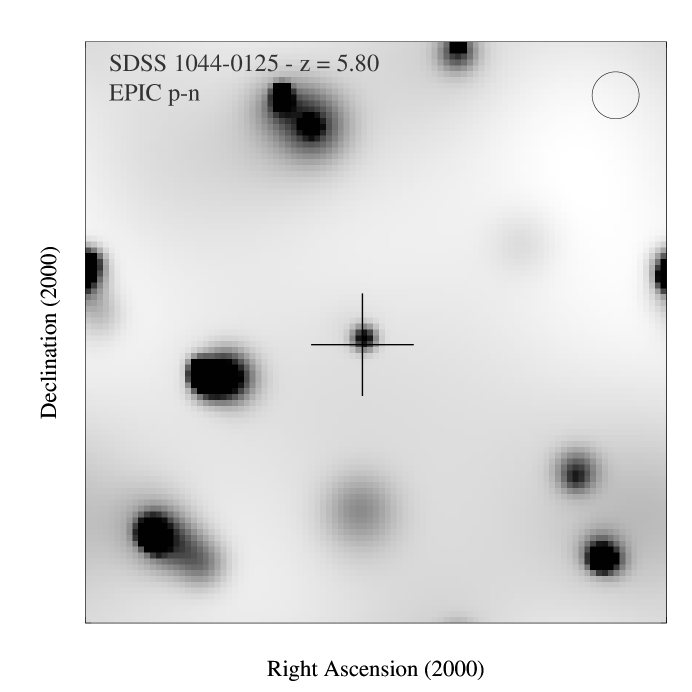
We have searched the images for sources using several algorithms, and we detect a 0.5–2.0 keV p-n source coincident with the optical position of SDSS 1044–0125 with high statistical significance (see Figure 1). For example, wavdetect (Freeman et al. 2000) finds this source when run with a significance threshold of ; given the number of X-ray positions searched that are consistent with the optical position, the probability that the X-ray source is only a statistical fluctuation is . Similarly, a detection algorithm created from the SAS tools finds this source when run with a minimum detection likelihood of 10 (see Cruddace et al. 1988), corresponding to a false detection probability of . For background estimation, the SAS algorithm used a two-dimensional spline fit to the image with the sources removed. Our best position for the X-ray source is 10h 44m 33.0s, 24′58.0′′ with a error circle radius of (the positional error here is larger than the absolute astrometry error quoted above due to the small number of photons associated with the X-ray source; this limits the precision of determination of the source’s centroid). The X-ray source is from SDSS 1044–0125. The quasar is not detected with high significance in the 2–7 keV p-n image (although manual inspection shows a hint of a photon excess at the quasar’s position) or in any of the MOS images. The 0.5–2.0 keV MOS nondetections are not surprising, given their lower sensitivity and the measured p-n flux (see below).
We consider source confusion problems to be unlikely (compare with §4.1 of Schmidt et al. 1998). For example, the 0.5–2.0 keV – relation of Hasinger et al. (1998) indicates that the probability of having a confusing erg cm-2 s-1 (see §2.3) X-ray source within of SDSS 1044–0125 is . In addition, there are no optical or near-infrared sources other than SDSS 1044–0125 inside the -radius X-ray error circle down to , and (see §2 of Fan et al. 2000). For that matter, there are no such sources within of SDSS 1044–0125.
2.3 Source parameterization
We have performed aperture photometry to determine the number of 0.5–2.0 keV counts detected from SDSS 1044–0125. We have used a circular source cell of radius ; this encircles % of the 0.5–2.0 keV energy. We detect net counts (corrected for the encircled energy fraction). The resulting 0.5–2.0 keV net count rate is count s-1. We have also performed photometry with a point-spread-function fitting technique, and the results are statistically consistent with our aperture photometry. We have checked the distribution of photon arrival times, and they appear to be spread fairly uniformly throughout the observation; this argues against some brief, transient event (e.g., a cosmic ray strike or transient hot pixel) having produced a spurious source. We do not detect enough counts from SDSS 1044–0125 to allow spectral fitting, so we have calculated its flux and luminosity adopting a power-law model with a photon index of and a Galactic neutral hydrogen column density of cm-2 (Stark et al. 1992). We have chosen based upon the photon indices measured for other luminous RQQs above 2 keV in the rest frame (e.g., Reeves & Turner 2000 find a typical range of 1.7–2.3), and our spectral model is consistent with our 0.5–2.0 keV detection and 2–7 keV upper limit (see below). Using the Portable, Interactive, Multi-Mission Simulator (pimms) Version 3.0 software (Mukai 2000), we find a 0.5–2.0 keV absorbed flux of erg cm-2 s-1; the 0.5–2.0 keV flux corrected for Galactic absorption is erg cm-2 s-1 (we have verified that the use of pimms is appropriate given our event pattern screening in §2.1). With a luminosity distance of 35900 Mpc, the 3.4–13.6 keV rest-frame luminosity is erg s-1. We have confirmed that our detected flux is reasonable by calculating the 0.5–2.0 keV – relation for our field and comparing it with the – of Hasinger et al. (1998); such ‘– fitting’ allows an independent calibration of the flux scale.
Figure 2 compares the observed X-ray flux of SDSS 1044–0125 (corrected for Galactic absorption) to that of other quasars with similar AB1450 magnitudes and optical luminosities. SDSS 1044–0125 is X-ray fainter by a factor of relative to its peers; we shall discuss this further below.
We have set an upper limit on the number of counts from SDSS 1044–0125 in the 2–7 keV band again using a -radius aperture; our aperture encircles % of the 2–7 keV energy. Following Kraft, Burrows & Nousek (1991), we derive a 95% confidence upper limit of 12.3 counts (again corrected for the encircled energy fraction). Using the same spectral model as was used two paragraphs above, we find a 2–7 keV absorbed flux of erg cm-2 s-1 and a 13.6–48 keV rest-frame luminosity of erg s-1. Given the 3.4–13.6 keV luminosity and spectral model from two paragraphs above, we would expect a 13.6–48 keV luminosity of erg s-1, below our upper limit; hence the lack of a rest-frame 13.6–48 keV detection is not surprising.
We have calculated , the slope of a nominal power law between 2500 Å and 2 keV in the rest frame. We again adopt for the X-ray continuum, and we use an optical power-law slope of (see §1) to calculate the 2500 Å flux density from the AB1280 magnitude of 19.28 (corresponding to AB). We find . The derived value of is not highly sensitive to the X-ray and optical continuum shapes adopted, as expected. For example, if we instead use () and recalculate in a consistent manner, we obtain ().
3 Discussion
3.1 The X-ray weakness of SDSS 1044–0125
With this XMM-Newton observation, SDSS 1044–0125 surpasses GB 1428+4217 (; Fabian et al. 1997) as the highest redshift cosmic object detected in X-rays. The most notable X-ray characteristic of SDSS 1044–0125 is its faintness in this band (see Figure 2); we had expected to obtain an X-ray spectrum for SDSS 1044–0125 but were foiled by the surprisingly low X-ray flux. X-ray weak quasars are known to exist at low redshift where they comprise % of the optically selected quasar population (e.g., Brandt, Laor & Wills 2000, hereafter BLW). There is increasing evidence that the majority of such objects are X-ray weak because they suffer from intrinsic absorption: % of optically selected, X-ray weak quasars show strong (4–80 Å equivalent width), blueshifted C iv absorption in the ultraviolet (BLW), and direct X-ray spectral fitting has revealed absorbed (but otherwise normal) X-ray continua in several X-ray weak quasars (e.g., Gallagher et al. 2000 and references therein). Broad Absorption Line quasars (hereafter BAL QSOs), for example, are notoriously X-ray weak (e.g., Green & Mathur 1996; Gallagher et al. 1999). The absorbing column densities associated with X-ray weak quasars are often cm-2 and in some cases appear to be ‘Compton thick’ (i.e., cm-2).
3.1.1 Comparison with the Bright Quasar Survey
Sharper insight into the X-ray weakness of SDSS 1044–0125 can be gained by comparing it with the Bright Quasar Survey (BQS; Schmidt & Green 1983). This sample is fairly large and has been extensively studied at many wavelengths; the high-quality constraints on X-ray and ultraviolet absorption are particularly relevant here.
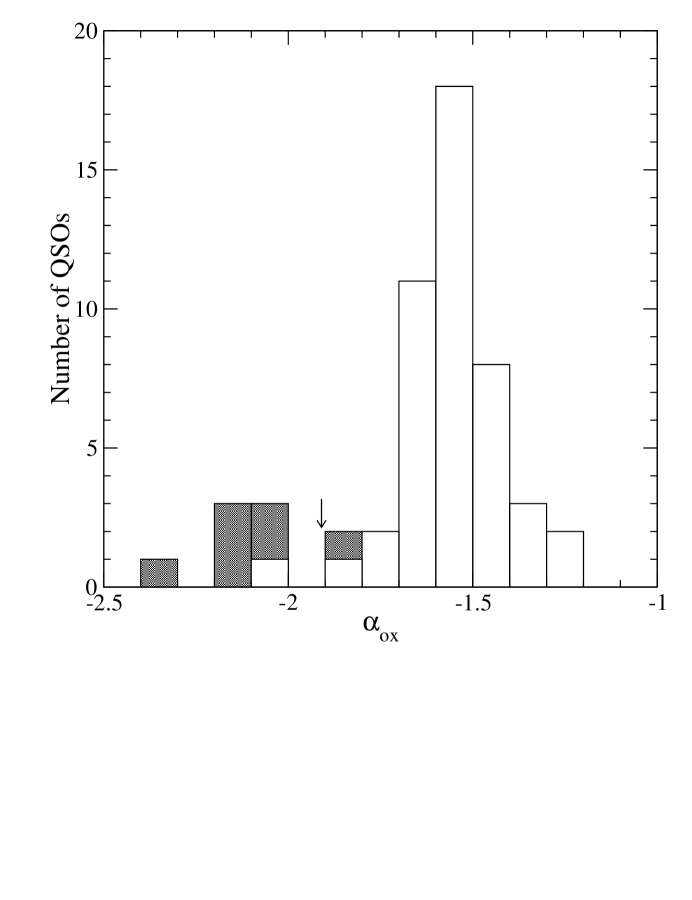
If SDSS 1044–0125 is not absorbed in the X-ray band, its X-ray weakness is extreme compared to other unabsorbed RQQs. In Figure 3, we show a histogram of for the 53 luminous (; we use the absolute magnitudes of Boroson & Green 1992 converted to our cosmology) BQS RQQs. The values used are from BLW (calculated following Footnote 1 of that paper). We have shaded the histogram for 7 of these RQQs, since there is strong evidence that their values have been depressed by intrinsic X-ray absorption. The shaded RQQs are the BAL QSOs 0043+039, 1001+054, 1700+518 and 2112+059 and the absorbed RQQs 1126–041, 1351+640 and 1411+442 (see Brinkmann et al. 1999; Gallagher et al. 1999; Wang et al. 1999; BLW; Gallagher et al. 2000). The mean and standard deviation for the unshaded BQS RQQs in Figure 3 are and 0.14, respectively. SDSS 1044–0125, with , has a larger negative value of than all but one of the unshaded BQS RQQs in Figure 3.
The three unshaded BQS RQQs in Figure 3 with the lowest values are 1259+593, 1552+085 and 2214+139. As we shall now describe, there is some evidence that at least two of these have had their values depressed by absorption (we have not shaded them in Figure 3 since the data are limited, and we wanted to be appropriately conservative). 2214+139 () has been observed by ROSAT, but unfortunately the exposure time was fairly short. While detailed spectral fitting is not possible due to the small number of counts collected, its flat X-ray continuum shape ( when only Galactic absorption is assumed) strongly suggests intrinsic absorption (Rachen, Mannheim & Biermann 1996). 1552+085 () is one of the most highly polarized BQS quasars in the optical (1.9%; Berriman et al. 1990); a significant fractional contribution from scattered, polarized light most readily occurs when the direct continuum is absorbed, and most optically selected RQQs with polarization percentages % show X-ray absorption (e.g., BLW and references therein). Furthermore, based on International Ultraviolet Explorer (IUE) data, Turnshek et al. (1997) argue that 1552+085 is a BAL QSO, and the notably weak [O iii] emission of 1552+085 is also often found in absorbed RQQs (e.g., Turnshek et al. 1997; BLW). 1259+593 () has the poorest X-ray coverage of any of the BQS RQQs; the only limit available is a fairly loose one from the ROSAT All-Sky Survey. We are not aware of any multiwavelength observations which either strongly suggest or argue against intrinsic absorption in 1259+593.
3.1.2 Comparison with Other Quasar Samples
The X-ray weakness of SDSS 1044–0125 is also apparent when it is compared with other quasar samples having higher median luminosities than the BQS. Such comparisons are germane since appears to generally decrease (i.e., move towards larger negative values) with increasing luminosity (e.g., Avni, Worrall & Morgan 1995 and references therein); for our cosmology, SDSS 1044–0125 is times more luminous than the typical BQS RQQ shown in Figure 3. Unfortunately, these higher luminosity samples do not have as complete multiwavelength coverage as the BQS, so it is more difficult to account for the significant effects of absorption that plague many studies (see BLW and §3.1.1 for discussion). In addition, precision comparisons with a sample matched in luminosity are hindered because, for a reasonable range of 0.1–0.5, the luminosity of SDSS 1044–0125 at varies by a factor of ; all well-studied comparison samples have substantially lower median redshifts, and thus their luminosities depend much less on .
In Figure 4, we compare the value of SDSS 1044–0125 with values derived for other RQQs found in optically selected surveys. In particular, the Large Bright Quasar Survey (LBQS; Hewett, Foltz & Chaffee 1995) RQQs provide a well-defined, optically selected comparison sample with a significantly higher median luminosity than the BQS; the X-ray properties of these RQQs were studied by Green et al. (1995) using an X-ray counts stacking technique. Comparison of SDSS 1044–0125 with the highest luminosity LBQS data point in Figure 4 affirms its X-ray weakness. Furthermore, it is important to note that the LBQS data points include some absorbed RQQs (e.g., BAL QSOs; see §6 of Green et al. 1995). Removal of the absorbed RQQs would shift the LBQS data points towards less negative values of , increasing their separation from SDSS 1044–0125. The magnitude of this shift is expected to be (P.J. Green 2000, private communication), largely due to the limited sensitivity ROSAT All-Sky Survey observations used by Green et al. (1995).
We have used the weighted orthogonal regression for the RQQs in Table 2 of Green et al. (1995) to predict the expected value for SDSS 1044–0125 given its luminosity density at 2500 Å (see §1).444Revised values for the slope and intercept in Table 2 of Green et al. (1995) are and , respectively (P.J. Green 2000, private communication). We predict , in good agreement with expectations from Figure 4.
Figure 4 also includes the optically selected RQQs studied by Kaspi et al. (2000). We have re-calculated the 2500 Å luminosity densities and values from this paper using the optical continuum slope measurements from Schneider et al. (1991) or the mean value of from Fan et al. (2001). The value for SDSS 1044–0125 is substantially below the range found for these quasars. Finally, we note that SDSS 1044–0125 has a larger negative value than all but one of the RQQs studied by Bechtold et al. (1994) even though these RQQs are significantly more luminous in the rest-frame optical band than SDSS 1044–0125.
In conclusion, if SDSS 1044–0125 does not suffer from intrinsic and/or associated X-ray absorption, then its anomalously weak X-ray continuum marks it as an unusual quasar.
3.2 Intrinsic and/or associated X-ray absorption?
The results of the above discussion suggest that heavy absorption may be affecting the X-ray spectrum of SDSS 1044–0125, and heavy absorption (specifically, a low-energy cutoff) is indeed commonly found in the X-ray spectra of RLQs (see the references in §1). Is it possible that X-ray absorption generally increases with redshift in RQQs at ? In this case, the large negative value for SDSS 1044–0125 might be the result of this trend in extremis, and a few RQQs at do appear to show significant X-ray absorption (see Figure 9 of Reeves & Turner 2000). While we consider this to be an enticing possibility requiring further investigation, we note that the values for the RQQs in Kaspi et al. (2000) do not appear to support it. Thus, the most likely interpretation at present appears to be that SDSS 1044–0125 is just one of the minority of optically selected RQQs that have intrinsic and/or associated absorption depressing their X-ray continua (rather than a representative example of a widespread, general RQQ trend). For example, SDSS 1044–0125 may be a BAL QSO or mini-BAL QSO. Finally, we note that because the high redshift of SDSS 1044–0125 has provided us with access to penetrating, high-energy X-rays, any absorber must be very thick with cm-2 (perhaps with partial covering of the X-ray continuum source to explain the photons detected at keV).
The integrated column density of the intergalactic medium out to is almost certainly too small to produce the required X-ray absorption, especially given the intergalactic medium’s low metallicity (e.g., Miralda-Escudé 2000).
3.3 An intrinsically weak X-ray continuum?
We must also admit the possibility that SDSS 1044–0125 has an intrinsically weak X-ray continuum; such objects are rare at low redshift, but some may exist (e.g., BLW; Gallagher et al. 2000). Speculating for a moment, SDSS 1044–0125 could be a ‘precursor quasar’ where the relativistically deep potential well needed for efficient X-ray production is still in the process of formation (see §3.3 of Haehnelt & Rees 1993); at ultraviolet and longer wavelengths, such contracting precursors may be able to sustain quasar-level luminosities for years. Alternatively, the black hole in SDSS 1044–0125 could be accreting at a highly super-Eddington rate where ‘trapping radius’ effects cause the X-rays created in the inner region of the accretion flow to be dragged back into the hole (e.g., Begelman 1978; Rees 1978); such an accretion flow has a luminosity of about the Eddington limit even though the mass accretion rate is super-Eddington. To first order, radiation trapping would truncate the spectrum above a critical frequency depending on the trapping radius; it could therefore lead to weak X-ray emission. Super-Eddington accretion would help to explain the formation of such a massive black hole in less than a billion years (see §1).
Even if SDSS 1044–0125 is intrinsically X-ray weak, this should not dramatically change the bolometric luminosity estimated in §4.2 of Fan et al. (2000). In luminous RQQs, X-rays typically contribute % of the bolometric luminosity (e.g., §6.1 of Elvis et al. 1994).
3.4 Future studies
Searches for intrinsic and/or associated absorption lines in the rest-frame ultraviolet spectrum of SDSS 1044–0125 are now of key importance for further understanding the origin of its X-ray weakness. Specifically, most of the X-ray weak quasars at low redshift that suffer from X-ray absorption also show significant blueshifted ultraviolet absorption; BQS RQQs with comparable values to SDSS 1044–0125 typically have C iv absorption equivalent widths of 4–80 Å (BLW). Due to the high redshift of SDSS 1044–0125, it does not yet have spectral coverage of C iv (this line has an observed-frame wavelength of 1.05 m). Absorption lines from N v and Si iv are frequently seen in objects with strong C iv absorption, and these lines are covered by the spectrum shown in Figure 2 of Fan et al. (2000). One can make a case for a moderate strength Si iv absorption line blueshifted by km s-1 from the emission line (with a maximum rest-frame equivalent width of Å), but this could simply be a dip in the continuum. Any N v absorption at this velocity would be difficult to disentangle from the Ly forest; there is none apparent at lower velocities. High-quality spectroscopy of the C iv line is required to settle this issue. Rest-frame ultraviolet absorption studies may well be the only way to better understand the X-ray weakness of SDSS 1044–0125 in the short term. Since the low X-ray flux of SDSS 1044–0125 puts it below the practical spectroscopy limit for even Constellation-X (see Figure 2), directly addressing the origin of its X-ray weakness with X-ray spectroscopy will almost certainly be impossible until XEUS or a comparable mission begins operation.
More generally, further X-ray observations of the highest redshift quasars are now needed to determine the distribution of for these objects. Chandra and XMM-Newton studies of additional quasars found by the SDSS will soon address this issue.
References
- (1) Avni, Y., Worrall, D. M. & Morgan, W. A. 1995, ApJ, 454, 673
- (2) Bechtold, J., et al. 1994, AJ, 108, 374
- (3) Begelman, M. C. 1978, MNRAS, 184, 53
- (4) Berriman, G., Schmidt, G. D., West, S. C. & Stockman, H. S. 1990, ApJS, 74, 869
- (5) Blair, A. J., Stewart, G. C., Georgantopoulos, I., Boyle, B. J., Griffiths, R. E., Shanks, T. & Almaini, O. 2000, MNRAS, 314, 138
- (6) Boller, Th., Fabian, A. C., Brandt, W. N. & Freyburg, M. J. 2000, MNRAS, 315, L23
- (7) Boroson, T. A. & Green, R. F. 1992, ApJS, 80, 109
- (8) Brandt, W. N., Laor, A. & Wills, B. J. 2000, ApJ, 528, 637 (BLW)
- (9) Brinkmann, W., Wang, T., Matsuoka, M. & Yuan, W. 1999, A&A, 345, 43
- (10) Cruddace, R. G., Hasinger, G. R. & Schmitt, J. H. M. M. 1988, in Astronomy from Large Databases: Scientific Objectives and Methodological Approaches, ed. F. Murtagh & A. Heck (Garching: ESO Press), p. 177
- (11) Ebeling, H., White, D. A. & Rangarajan, F. V. N. 2000, MNRAS, submitted
- (12) Elvis, M., et al. 1994, ApJS, 95, 1
- (13) Elvis, M., Fiore, F., Giommi, P. & Padovani, P. 1998, ApJ, 492, 91
- (14) Fabian, A. C., Brandt, W. N., McMahon, R. G. & Hook, I. M. 1997, MNRAS, 291, L5
- (15) Fabian, A. C., Celotti, A., Iwasawa, K., McMahon, R. G., Carilli, C. L., Brandt, W. N., Ghisellini, G. & Hook, I. M. 2000, MNRAS, submitted
- (16) Fan, X. 1999, AJ, 117, 2528
- (17) Fan, X., et al. 2000, AJ, 120, 1167
- (18) Fan, X., et al. 2001, AJ, in press (astro-ph/0008122)
- (19) Fiore, F., Elvis, M., Giommi, P. & Padovani, P. 1998, ApJ, 492, 79
- (20) Freeman, P. E., Kashyap, V., Rosner, R. & Lamb, D. Q. 2000, ApJ, submitted
- (21) Gallagher, S. C., Brandt, W. N., Sambruna, R. M., Mathur, S. & Yamasaki, N. 1999, ApJ, 519, 549
- (22) Gallagher, S. C., Brandt, W. N., Laor, A., Elvis, M., Mathur, S., Wills, B. J. & Iyomoto, N. 2000, ApJ, in press (astro-ph/0007384)
- (23) Gondoin, P. 2000, The XMM-Newton Science Analysis System User’s Guide. VILSPA-ESA Press, Madrid (available at http://xmm.vilspa.esa.es/sas/)
- (24) Green, P.J., et al. 1995, ApJ, 450, 51
- (25) Green, P. J. & Mathur, S. 1996, ApJ, 462, 637
- (26) Haehnelt, M. G. & Rees, M. J. 1993, MNRAS, 263, 168
- (27) Hasinger, G., Burg, R., Giacconi, R., Schmidt, M., Trümper, J. & Zamorani, G. 1998, A&A, 329, 482
- (28) Hewett, P. C., Foltz, C. B. & Chaffee, F. H. 1995, AJ, 109, 1498
- (29) Jansen, F. A. 1999, ESA Bulletin, 100, 9
- (30) Kaspi, S., Brandt, W. N. & Schneider, D. P. 2000, AJ, 119, 2031
- (31) Kraft, R. P., Burrows, D. N. & Nousek, J. A. 1991, ApJ, 374, 344
- (32) McDowell, J.C., Noble, M. & Elvis, M. 1998, Legacy, 7, 64
- (33) Miralda-Escudé, J. 2000, ApJ, 528, L1
- (34) Moran, E. C. & Helfand, D. J. 1997, ApJ, 484, L95
- (35) Mukai, K. 2000, pimms Version 3.0 Users’ Guide. NASA/GSFC, Greenbelt
- (36) Osterbrock, D. E. & Phillips, M. M. 1977, PASP, 89, 251
- (37) Page, C. 1998, Legacy, 7, 78
- (38) Rachen, J. P., Mannheim, K. & Biermann, P. L. 1996, A&A, 310, 371
- (39) Rees, M. J. 1978, Physica Scripta, 17, 193
- (40) Reeves, J. N. & Turner, M. J. L. 2000, MNRAS, 316, 234
- (41) Schmidt, M. & Green, R. F. 1983, ApJ, 269, 352
- (42) Schmidt, M., et al. 1998, A&A, 329, 495
- (43) Schneider, D. P. 1999, in After the Dark Ages: When Galaxies Were Young (The Universe at ), ed. S. S. Holt & E. P. Smith (Woodbury: AIP Press), p. 233
- (44) Schneider, D. P., Schmidt, M. & Gunn, J. E. 1991, AJ, 101, 2004
- (45) Stark, A. A., Gammie, C. F., Wilson, R. W., Bally, J., Linke, R., Heiles, C. & Hurwitz, M. 1992, ApJS, 79, 77
- (46) Turnshek, D. A., Monier, E. M., Sirola, C. J. & Espey, B. R. 1997, ApJ, 476, 40
- (47) Vignali, C., Comastri, A., Cappi, M., Palumbo, G.G.C., Matsuoka, M. & Kubo, H. 1999, ApJ, 516, 582
- (48) Wang, T. G., Brinkmann, W., Wamsteker, W., Yuan, W. & Wang, J. X. 1999, MNRAS, 307, 821
- (49) York, D. G., et al. 2000, AJ, 120, 1579
- (50) Yuan, W., Matsuoka, M., Wang, T., Ueno, S., Kubo, H. & Mihara, T. 2000, ApJ, in press (astro-ph/0006148)