LMC and SMC Cepheids: combining ogle with denis and 2mass infrared data
Abstract
I cross-correlate the ogle database of Cepheids in the Large and Small Magellanic Clouds (MCs) with the second incremental release of the 2mass survey, and the denis point source catalog towards the MCs.
Of the 3384 Cepheids in ogle in both Clouds, 1745 have a counterpart in the 2mass survey within an 1″ radius and good-photometry in all three bands. Only 173 have a counterpart in the denis survey within an 1″ radius and good-photometry in all three bands. The reason for this difference is that the limiting magnitudes of the 2mass survey are considerably fainter than for the denis survey.
The standard stars of the Carter IR photometric system are also correlated with the 2mass survey to derive transformation equations from the natural 2mass system to the Carter-system.
In order to describe to first order the geometrical configuration of the MCs a plane is fitted to the reddening-free Wesenheit index () and the inclination and position angle of the line-of-nodes are determined. For the LMC an inclination angle of 18 3° is derived, somewhat smaller that previous determinations. For the SMC a value of ° is derived in good agreement with previous determinations. These results are being used to take out the effect that some Cepheids are closer to the observer than others. For the LMC this effect is small over the area covered by the ogle survey, but for the SMC -relations with a reduced scatter are derived in this way. Nevertheless, the dispersion in the -relation in for the SMC is larger than that for the LMC, indicating a significant intrinsic depth of the SMC of about 14 kpc (front-to-back). The depth of the LMC is found to be small compared to the intrinsic scatter in the -relation.
Using single-epoch 2mass data for the ogle Cepheids -relations are fitted in (on the Carter system) for both Fundamental mode (FU) and First-overtone (FO) pulsators, taking out the effect of the inclined disk. Because of the large number of stars available, this results in the most accurately determined slopes in the infrared up to now, and slopes for FO pulsators derived for the first time. This provides additional constraints for theoretical models.
The 16 derived -relations (in for FU and FO pulsators for LMC and SMC) are used to derive a relative distance modulus assuming no metallicity correction. Two recent theoretical models predict different metallicity corrections, indicating a systematic uncertainty of up to 0.1 mag.
Using the database of Galactic Cepheids observed with hipparcos and the method outlined in Groenewegen & Oudmaijer (2000), the zero points of Galactic -relations for FU pulsators in and are derived, using the newly derived slopes for LMC and SMC pulsators.
Combining the zero points of the Galactic and MCs -relations distance moduli of 18.60 0.11 (based on ) and 18.55 0.17 (based on ) to the LMC, and of 19.11 0.11 () and 19.04 0.17 () to the SMC are derived (without taking into account possible metallicity corrections).
Key Words.:
Stars: distances - Cepheids - Magellanic Clouds - distance scale1 Introduction
Cepheids are important standard candles in determining the extra-galactic distance scale. The results of the hipparcos mission allowed a calibration of the Galactic Period-Luminosity () relation in the -band (Feast & Catchpole 1997), and -bands (Lanoix et al. 1999a) and , , and the reddening-free Wesenheit index (Groenewegen & Oudmaijer 2000, hereafter GO00). Feast & Catchpole (1997) and GO00 combined these data with available data on LMC Cepheids to determine the distance to the LMC. It is well know that the infrared has some considerable advantages over the optical region for deriving distances. First of all the problem of reddening is less important, and second, as summarised in GO00, the effect of metallicity on the -relation seems to be less. Of the 236 Cepheids in the sample considered in GO00, only 63 have sufficiently well determined infrared light curves to determine accurate intensity-mean magnitudes (also see Groenewegen 1999). In addition, the number of Magellanic Clouds (MCs) Cepheids with well determined infrared lightcurves is also rather small, of order 20 in each Cloud (Laney & Stobie, 1994, 1986a).
The micro lensing surveys have increased the number of known Cepheids in the MCs tremendously and they provide optical photometry for many of them. In particularly, Udalski et al. (1999b,c; hereafter U99b,c111In April 2000 the ogle team released a re-reduced dataset changing the photometry slightly, and hence the -relations with respect to those in the papers published in 1999. The new data and corresponding -relations can be found on the ogle Homepage. When appropriate I will refer to these new values.) recently published the results on Cepheids in the Small and Large Magellanic Cloud from the ogle survey. Complementary, in the infrared, the 2mass survey is an ongoing all-sky survey in the near-infrared bands, that, when completed, will contain of order 300 million stars (Beichman et al. 1998). The 2mass team released their second incremental data set in March 2000, that includes the MC area. In parallel, the denis survey is a survey of the southern hemisphere in (Epchtein et al. 1999), that recently released a Point Source Catalog (PSC) of sources in the direction of the MCs (Cioni et al. 2000a).
In this paper the ogle database is correlated with the 2mass second incremental database and the denis PSC of MC stars (Sect. 2), transformation formulae from the natural 2mass system to the Carter (1990) system are derived (Sect. 3), the spatial structure of the MCs is investigated (Sect. 4), and -relations in for fundamental mode and first overtone pulsators derived (Sect. 5). The results are discussed in Sect. 6.
2 ogle, 2mass and denis Sample selection
U99b,c describe the dataset regarding Cepheids in the direction of the LMC and SMC, obtained in course of the ogle-ii micro lensing survey. Twenty-one fields in the central parts of the LMC, and 11 fields in the central parts of the SMC of size 14.2′57′ each were observed in , with an absolute photometric accuracy of 0.01-0.02 mag. U99b,c present tables per field, with (amongst other items) identification number, pulsation period, photometry, and pulsation mode. The value was derived by them using red clump stars, and the pulsation mode was derived by them from two Fourier parameters derived from the -band lightcurve (see U99b,c for details). These data were obtained from the ogle homepage (http://sirius.astrouw.edu.pl/∼ogle/) in April 2000.
As noted in U99b,c there are about a 100 objects in each cloud that appear in 2 or more fields. They provide a list with the relevant field and identification number, but I did this positional correlation independently. Values for the photometry, period and were averaged where appropriate. The final number of Cepheids detected by ogle in the LMC is 1335, and in the SMC 2048.
The 2mass survey is an ongoing single-epoch all-sky survey in the near-infrared bands. On March 2, 2000 the 2mass team released the second incremental data set, that includes the MC area. The easiest way to check if a star is included in this release is by uplinking a source table with coordinates to the 2mass homepage. Such a table was prepared including the 1335 LMC and 2048 SMC Cepheids in ogle and 236 Cepheids in the hipparcos catalog considered in GO00.
The correlation between the source list and the 2mass database was at first instance done using a search radius of 5″. Inspection of the match between the ogle and hipparcos Cepheids and 2mass indicated a much better positional coincidence. This is to be expected as the 2mass positional accuracy is 0.2″ (Cutri et al. 2000) and the internal accuracy of the ogle database is about 0.15″ with possible systematic errors of 0.7 ″ (U99b,c). In quite a few cases there was a second 2mass source (not the counterpart) within the search radius of 5″. The match between 2mass and hipparcos was excellent with the largest positional difference being 0.56″. In view of this, a second and final correlation was made for the hipparcos and ogle Cepheids using a search radius of 1″. Seventy-two correlations were found with the hipparcos Cepheids, 1511 with the ogle SMC, and 894 with the ogle LMC Cepheids. The small number of correlations with hipparcos is due to the fact that the 2mass survey is not yet complete in sky coverage.
On this 2mass dataset a further selection was performed to retain only those sources with reliable photometry in all three bands. It is worthwhile to recall here that the “rd-flg” in the 2mass database gives essential information on the quality of the magnitudes (Cutri et al. 2000). In particular, objects where the rd-flg is 0 (indicating an upper limit) or 3 or 8 (indicating saturation) in any of the three bands are eliminated. The final 2mass database of Cepheids consists of 52 hipparcos Cepheids (not discussed further), 825 ogle LMC and 920 ogle SMC Cepheids. The 2mass and ogle coverage of the LMC are not identical, and no 2mass sources are found in ogle fields LMC-SC6, 7 and 21.
The denis survey is a survey of the southern sky in (Epchtein et al. 1999). In April 2000, a point source catalog was released containing sources and single-epoch photometry in the direction of the MCs (Cioni et al. 2000a). A subset of 264347 LMC and 69829 SMC sources detected in all three band was obtained using ftp from www.strw.leidenuniv.nl (cd /pub/ldac/dcmc). These were correlated against the ogle survey on position. As both ogle and denis contain -band data it was possible to verify how the average difference between the ogle and denis -data depends on the search radius. Since the ogle data contain intensity-mean magnitudes, but the denis data are single-epoch data, one has to allow for variability. For the SMC, and a search radius of 2″, 93 cross-correlations were found. The average difference in position is 0.68″ and the mean absolute difference in is 0.18 mag. However, for the 21 stars with a positional difference larger than 1″, 9 (or 43%) have a difference in of larger than 0.8 mag, which is a typical value for the amplitude for a Cepheid in the -band. For the stars with a positional differences less than 1″, this is only 5 out of 67 or 7%. Given the internal accuracy of the positions in the denis survey of 0.5″ (Epchtein et al. 1999), a search radius of 1″ seems appropriate to reduce the number of spurious associations, which is supported by the large fraction of highly deviant -band data when a larger search radius is used. As discussed below some true identifications are missed in this way however. Also some false coincidences are undoubtedly included (as for the correlation of ogle with 2mass) but these will be removed using sigma-clipping when deriving relations. Using a search radius of 1″ the number of correlations between denis and ogle is 71 in the SMC, and 102 in the LMC, for stars with good photometry in all three bands
It was verified whether all correlations between denis and ogle were also found in the match between 2mass and ogle. Of the 71 SMC ogle + denis stars, 61 are also found in 2mass. In three of the 10 cases where there is no match this was due to the positional difference which was ″ between ogle and 2mass. In the other 7 cases it is less clear, possibly related to the variable nature of the objects. Of the 102 LMC ogle + denis stars, 80 were also found in 2mass. In one of the 22 other cases this was due to a positional difference of ″ between ogle and 2mass, and ″ between ogle and denis. One case is puzzling, and the other 20 cases are all in ogle fields LMC-SC6, 7, 21, which apparently have not been covered by 2mass.
The number of correlations beween denis and ogle is much less than the number of correlations between ogle and 2mass. Some tests using denis data of sources detected in and only, showed that this is mainly due to the lack of detections in . Some tests in a few ogle fields showed that there may be an equal number of Cepheids in ogle with denis and photometry. In any case it is clear however, that for the purpose of determining -relations in the infrared using the largest possible samples, the 2mass survey is of more interest, because it reaches fainter magnitudes.
In Appendix A a comparison is presented between the denis and ogle and denis and 2mass photometry. This has its limitations since the comparison is done using variable stars. Yet it may still be of some interest to other workers, as such a comparison has not been done yet.

3 Transformation of the photometric system
The photometry presented by the 2mass-team is on the natural system. However, many of the extisting infrared photometry on both Galactic (Laney & Stobie 1992, Groenewegen 1999) and MC Cepheids (Laney & Stobie 1994) is on the Carter (1990) system or has been transformed to that system. It is therefere imperative to estimate any systematic differences between the Carter and the natural 2mass system.
From Carter (1990) and Carter & Meadows (1995) 116 stars with were taken, and a table with coordinates was uplinked to the 2mass homepage to perform a search on position using a search radius of 2″. Thirty-four matches were found; the largest positional difference was 1.2″. However, not all entries are useful as some of the brighter stars still saturate the 2mass detectors in one or more bands, despite the a-priori exclusion of stars with . The vast majority of stars in 2mass have “default magnitudes obtained using profile-fit photometry performed simultaneously on the combination of all six individual 1.3-seconds “Read 2-Read 1” (R2-R1) exposures” (Cutri et al. 2000). These sources have rd-flg = 2 in the appropriate band. Sources brighter than 7-8 magnitudes will saturate in the 1.3-s R2-R1 exposures. These objects have default magnitudes from aperture photometry performed on the 51-millisec R1 frames. Such sources have rd-flg = 1 in the appropriate band. Stars brighter than approximately fifth magnitude will saturate in even the 51-millisec exposures. The rd-flg value for the appropriate band is 3.
Among the 34 sources, there are 15 sources with rd-flg = 111, 10 with rd-flg = 112, 1 with rd-flg = 122, 4 with rd-flg = 222 and 4 sources with rd-flg = 3 in atleast one of the bands. The latter were not considered.
Figure 1 plots the differences “Carter - 2Mass” versus (2Mass), and “2Mass - Carter” versus (Carter) in . For these nearby stars reddening is neglected. The errors in the individual magnitudes are taken from the 2mass database (typically between 0.01 and 0.03 mag), or are 0.025 mag in the case of the Carter system following the estimate in Carter & Meadows (1995). Linear least-square fits show that the significance of the derived slopes is less than 1 in and about 1.5 in , indicating that there is at present no indication of a colour term in the transformation from the 2mass to the Carter system. The average off-sets are (Carter) (2Mass) = +0.017 0.008, (Carter) (2Mass) = 0.009 and (Carter) (2Mass) = +0.048 0.007 (internal errors). The dispersion in all three plots is about 0.03 mag. This analysis indicates (A) that there might be small off-sets between the two infrared systems, and (B) that the absolute photometric calibration of both is uncertain at the 0.01-0.02 mag level. This issue may addressed in more detail when the 2mass survey has been completed and this analysis may be repeated using a larger number of stars.
Regarding the same issue, Nikolaev & Weinberg (2000) note that the 2mass system is similar to the CIT/CTIO system (Elias et al. 1982, Persson et al. 1998) except for the band. They note that the difference of the absolute value of is less than 0.05 mag.
4 The spatial structure of the LMC and SMC
In this section the spatial structure of the MCs is being investigated in terms of the usual approximation of a flat disk, using the largest possible dataset, that is the ogle sample (without the correlation with 2mass). The secondary aim is to correct for any depth effects in order to obtain tighter -relations.
Cepheids have previously been used to determine the spatial structure of the MCs, for example Caldwell & Coulson (1986) whose model for the LMC is a plane of insignificant thickness inclined by 29 6° with the closest part at position angle (P.A.) 52 8°. For the SMC they find that a planar model is barely sufficient to describe this galaxy, and derive an inclination of 70 3° with the closest part at P.A. 58 10°. Laney & Stobie (1986a) reach similar conclusions and derive for the LMC with the nearest part at P.A. 55 17°. Values for inclination and position angle derived from other methods and a more general discussion can be found in the monograph by Westerlund (1997). Most recently, Weinberg & Nikolaev (2000) used star counts from the 2mass survey of the LMC, and a model for the number density of stars, to derive inclinations between 24 and 28 degrees, and position angles of the line-of-nodes between 169 and 173 degrees depending on the population, and an inclination of 42.3 7.2° from carbon-rich Long Period Variables (LPVs).
The coordinate transformations that are necessary have conveniently been written down in Appendix A.1 in Weinberg & Nikolaev (2000). To summarise, for every Cepheid under consideration one knows its right ascension and declination, and one can derive its distance (see below). This coordinate system (, , ) is transformed into a rectangular coordinate system (, , ), which has its origin at the center (, , ) of the LMC or SMC, the -axis towards the observer, the -axis anti-parallel to the right ascension axis, and parallel to the declination axis. Another rectangular coordinate system is introduced (, , ), which is rotated about the -axis by an angle counterclockwise (counting East of North), and about the new -axis (the line-of-nodes) by the inclination angle clockwise (that is rotation from the new -axis towards the -axis). Note that there seem to exist slightly different definitions in the literature regarding this issue, related to, for example, the definition of negative/positive inclination222In particular, using the present notation, the result of Caldwell & Coulson (1986) implies , the result of Laney & Stobie (1986a) implies , and that of Weinberg & Nikolaev (2000) implies a P.A. of the line-of-nodes between 259 and 263 degrees for the LMC..
The above procedure assumes one knows the distance to the center of the galaxy, and the distance to the individual Cepheids. To this end an observed -relation is used, together with a typical distance (the assumed value for is arbitrary because one basically look at residuals in magnitude space relative to the observed mean -relation. However, for convenience, it is preferred here to work in physical, rather than magnitude, space, and therefore an arbitrary mean distance to the center of the galaxy has to be adopted).
In particular, the -relation using the reddening-free Wesenheit-index using the and colours is being used as the reference -relation. This is done as the observed scatter in this relation is less than in the -relations in or , and because the Wesenheit-index, by construction, does not depend on the assumed value for . It depends only on the reddening law. Its definition is = for the ogle filter system and the extinction law by Cardelli et al. (1989) (Udalski et al. 1999a; hereafter U99a)
4.1 The LMC
U99a derived the zero point and slope of the -relation in , for periods longer than about 2.5 days and fundamental pulsators (FU), and applying clipping at the 2.5 level (see Table 1, entry 1). They used this cut-off in period as in the SMC there is a change of slope at shorter periods (Bauer et al. 1999). Using the same criteria I derive almost identical results (solution 2), altough I would prefer to use a less stringent clipping to have a larger sample. A solution with clipping at the level is also included (solution 3).
The change of slope observed in the eros data for the SMC was not observed in the LMC (Bauer et al. 1999), and also theoretically, one would expect this change of slope to occur at shorter periods for higher metallicity (Alibert et al. 1999). Table 1 also includes a fit using no constraint on the period (solution 4). The results are nearly identical, but obtained for a larger sample.
U99a only briefly mention the result for the slope derived for First Overtone (FO) pulsators, and, in fact, more details are given on the ogle Homepage (entry 5 in Table 1), which has been derived for stars with (Udalsky, private communication). I find essentially the same result (solution 6), also using a less stringent 4 clipping (solution 7). However, for consistency, a cut-off at for FU pulsators should correspond to a cut-off at about for FO pulsators, according the usual ratio of (for example Feast & Catchpole 1997). Table 1 gives the solutions for stars above and below this cut-off in period (solutions 8, 9). The slopes are nearly identical, but there is a significant off-set in zero point. Bauer et al. (1999) for a smaller sample of 113 FO LMC Cepheids detected by eros found that both zero point and slope did not depend on a cut-off in period. However their error bars are roughly 4 times larger than here, and so their sample may not have been large enough to detect this effect.
| solution | N | Remarks | ||||
|---|---|---|---|---|---|---|
| 1 | 15.868 0.008 | 0.058 | 668 | U99a; FU; ; 2.5 clipping | ||
| 2 | 15.869 0.008 | 0.059 | 639 | This paper; FU; ; 2.5 clipping | ||
| 3 | 15.871 0.009 | 0.073 | 673 | This paper; FU; ; 4 clipping | ||
| 4 | 15.880 0.009 | 0.074 | 713 | This paper; FU; all ; 4 clipping | ||
| 5 | 15.380 0.006 | 0.060 | 457 | U99a; FO; ; 2.5 clipping | ||
| 6 | 15.383 0.006 | 0.060 | 424 | This paper; FO; ; 2.5 clipping | ||
| 7 | 15.369 0.007 | 0.072 | 450 | This paper; FO; all ; 4 clipping | ||
| 8 | 15.323 0.013 | 0.068 | 344 | This paper; FO; ; 4 clipping | ||
| 9 | 15.385 0.009 | 0.084 | 108 | This paper; FO; ; 4 clipping | ||
| 10 | 15.890 0.008 | 0.072 | 713 | FU; all ; 4 clipping; planar effect taken out | ||
| 11 | 15.370 0.007 | 0.072 | 450 | FO; all ; 4 clipping; planar effect taken out |
For the investigation of the effect of an inclined disk the FU pulsators are being considered first, using the relevant observed -relation (solution 4). An arbitrary distance to the center of the LMC of kpc is assumed, and the center of the disk is assumed to be given by the mean of the 713 Cepheids in the sample: , degrees (J2000). The observed -relation is then transformed into an absolute relation = , and with this the distance to every Cepheid can be calculated, and the coordinates (, , ) and (, , ) determined for an assumed position angle and inclination.
There may be one caveat of working in real space rather than magnitude space that should be pointed out here. The dispersion around the observed -relation is due to three effects. The depth effect along the line-of-sight, or, equivalently, the distance to the plane of the sky, photometric errors, and “cosmic” scatter. The latter term arises because a linear -relation is an approximation, metallicity effects, or other effects. The photometric errors are small (of order 0.01 mag) and the other two effects are difficult to distinguish, and when considering correlations of the residual magnitudes with respect to the mean -relation with position need not to be distinguished. When working in physical space, the values derived are NOT the actual distances below or above the mid-plane. In fact the values for the distance to the mid-plane are upper limits as the “cosmic” dispersion is non-zero.
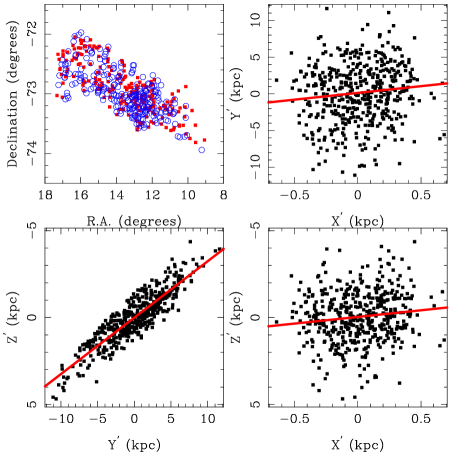
Figure 2 shows the distributions for . The upper-left panel shows in filled squares stars that are closer to the observer (that is brighter than the -relation) and in open circles Cepheids that are further away (fainter than the -relation)333In the electronic version, this is highlighted by using different colour schemes as well.. The other 3 panels show the projection on to different planes. From the top right panel a rotation angle of approximately 26 (c.q. 206) or 116 (c.q. 296) degrees is derived. The question of the inclination is not immediately clear. Figure 3 shows the distribution and projections for and . The -axis now runs along the major axis from bottom left to top right and -axis runs along the minor axis from bottom right to top left. The and coordinates are now uncorrelated, by construction. Their is no correlation between and , indicating no rotation over the -axis. The correlation between and indicates a rotation along the -axis by 18 degrees with the south-east part tilted towards us. Given the definition of the coordinate system, and considering the errors in the slopes, this implies a position angle of the line-of-nodes of , °.
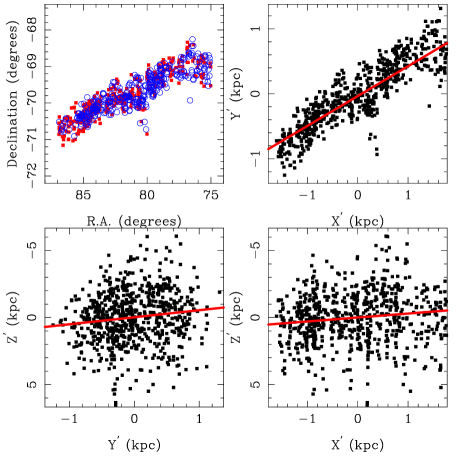
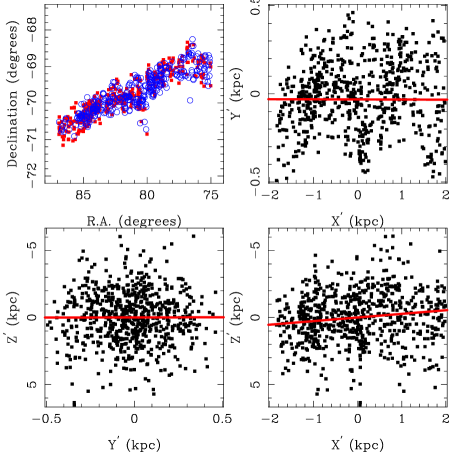
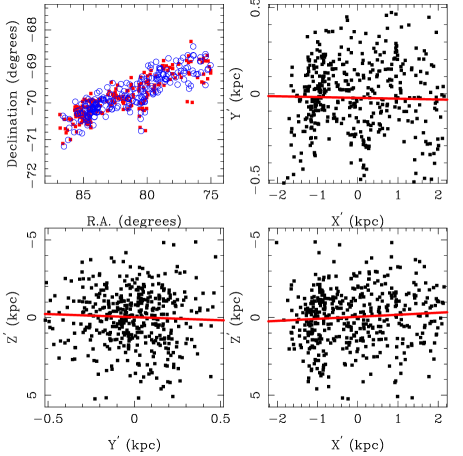
This analysis was repeated using all FO pulsators (solution 7), and Fig. 4 shows the result for and . The inclination implied by the slope in the and plane is not significant being 16 17°, and the slope in the other plane of 10 5° is consistent with that derived from the FU pulsators.
These results are in fair agreement with previous results in the literature, where larger inclinations are usually quoted (see the beginning of Sect. 4.0). Probably the main reason is that those studies covered a much larger area, and not only the bar region. In particular it would be extremely useful to have ogle fields at some distance from the bar, along P.A. of about 30, 120, 210 and 300 degrees. One other possibility is that the structure of the LMC is truly different in the central region from the more global structure. A very recent preprint (Zhao & Evans 2000) eluded to the possibility of an off-setted and misaligned LMC bar with respect to the LMC disk.
As a further illustration Fig. 5 depicts the distance from the mid-plane assuming no intrinsic scatter of the -relation. In fact, this plot illustrates the upper limit to this distribution, and the true distribution (-scale) should be compressed by a factor of about 9 (see below).
From McCall (1993) it is estimated that the layer containing 99% of young stars has a thickness of 1.0 0.3 kpc, for a distance to SN 1987A of 51.2 1.2 kpc (Panagia 2000). The half-thickness of the layer containing 50% of the young stars can then be calculated to be 0.1 0.03 kpc. McCall also derives , where is the vertical scale height and the radial scale length of the LMC disk. For between 1.4 and 1.8 kpc derived from 2mass data (Weinberg & Nikolaev 2000), this results in kpc. Taking this latter value, it is concluded that at the distance of the LMC the thickness of the LMC disk gives rise to a 1 dispersion in -relations of approximately 0.008 mag only. The total front-to-back depth corresponds only to 0.043 mag.
A final remark regarding this topic is that the theoretically predicted dispersion in the Wesenheit-index is 0.10 mag (Bono & Marconi, 2000, private communication). This is in fact slightly larger than the observed one. However, this is again consistent with the notion that the intrinsic depth of the LMC plays no role in the observed scatter in the -relations towards the LMC.
Weinberg & Nikolaev (2000) recently claimed the LMC to be
geometrically thick along the line of sight with a thickness of
14 kpc. They used stars in a color selected region based on 2mass data and assumed these to be carbon-rich LPVs. They derive widths of
the magnitude distribution functions of 2 = 0.7 mag, while
they claim their standard candles to have an intrinsic spread of 0.2
mag, from which they derive a front-to-back thickness of 14 kpc,
after they rejected other possible explanations. For a similar
population, Bessell et al. (1986), from the intrinsic
line-of-sight velocity dispersion of old LPVs, derived a vertical scale
height 0.3 kpc, consistent with the notion of a thin disk.

Although it will turn out academic for the LMC, it will be discussed now, how an improved -relation can be derived once position angle and inclination have been determined. If the approximation of a thin disk is correct, one can calculate those distances, , respectively, , that make and (for fixed and and given and ). That is, for every star one can subtract the correction in magnitude, 5 , to put all stars in the plane of the sky, and then fit the -relation again. Planar effects are in this way taken out. The result is listed in Table 1 as solutions 9 and 10, and are essentially the same as solutions 4 and 7 with only marginally lower errors and the fit coefficients. This indicates that over the region covered by ogle, depth effects are not important, and that the width of the -relation is intrinsic. The resulting final -relations are shown in Figs. 6 and 7.


4.2 SMC
This section is largely a repeat of the previous subsection but for the SMC. U99a derived the zero point and slope of the -relation in , for periods longer than about 2.5 days and fundamental pulsators, and applying clipping at the 2.5 level (see Table 2, solution 1). They used this cut-off in period as there is a change of slope observed at shorter periods (Bauer et al. 1999). Using the same criteria I derive almost identical results (solution 2). A solution with clipping at the level is also included (solution 3). As mentioned by U99a, and explicitly confirmed here (solution 4), the slope for the sample with is significantly steeper, confirming the result of Bauer et al. (1999).
Table 2 gives the results for FO pulsators as well, including no cut-off in period (entry 5 as obtained by U99a, and solution 6 obtained in this paper), and using a cut-off at , for reasons explained before (solutions 7 and 8). The slope for the shorter periods is significantly steeper, as for the FU pulsators. The slopes for the FO pulsators are nearly identical to the ones for the FU pulsators both above and below the cut-off. The dispersion in all relations is larger than the corresponding relations for the LMC, and this is very likely due to the known depth effect of the SMC.
| solution | N | Remarks | ||||
|---|---|---|---|---|---|---|
| 1 | 16.387 0.016 | 0.125 | 463 | U99a; FU; ; 2.5 clipping | ||
| 2 | 16.381 0.016 | 0.126 | 446 | This paper; FU; ; 2.5 clipping | ||
| 3 | 16.366 0.018 | 0.145 | 464 | This paper; FU; ; 4 clipping | ||
| 4 | 16.520 0.014 | 0.142 | 743 | This paper; FU; ; 4 clipping | ||
| 5 | 15.981 0.006 | 0.121 | 714 | U99a; FO; ; 2.5 clipping | ||
| 6 | 15.978 0.006 | 0.126 | 688 | This paper; FO; ; 2.5 clipping | ||
| 7 | 15.854 0.037 | 0.138 | 211 | This paper; FO; ; 3 clipping | ||
| 8 | 15.982 0.067 | 0.145 | 518 | This paper; FO; ; 3 clipping | ||
| 9 | 16.395 0.017 | 0.132 | 464 | FU; ; 4 clipping; planar effect taken out | ||
| 10 | 15.881 0.033 | 0.123 | 211 | FO; ; 3 clipping; planar effect taken out |
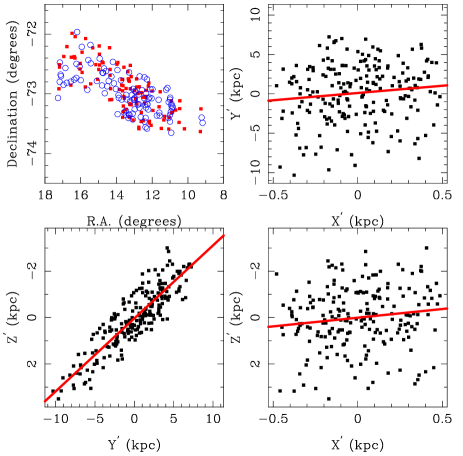
To discuss the spatial structure of the SMC the FU pulsators are considered first in determining and (solution 3). An arbitrary distance to the center of the SMC of kpc is assumed, and the center is assumed to be given by the mean of the 464 Cepheids in the sample: , degrees (J2000). Figure 8 gives the relevant projection for and degrees.
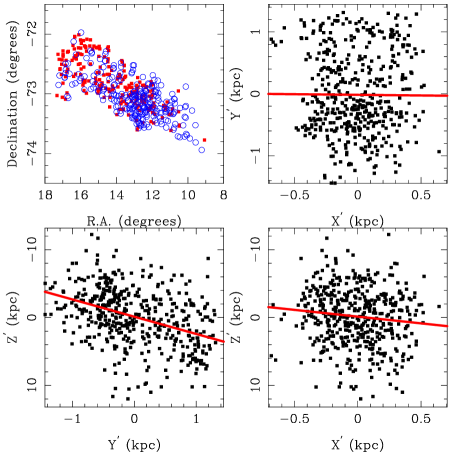
It is clear that the SMC is inclined with the NE part closer to us. A fit with a position angle of the line-of-nodes of ( 7), and ( 2) degrees is shown in Fig. 9. The strong correlation in the bottom left panel is an artefact. In the transformation to and , the dominant term is respectively and (see the Appendix in Weinberg & Nikolaev, 2000). Because, as mentioned before, does not correspond to the physical distance from the plane, but is dominated by the intrinsic scatter in the -relation, and will be strongly correlated.
The analysis is repeated for the FO pulsators and 0.25 (solution 7), and the result is a P.A. of the line-of-nodes 245 10°, and °, consistent with the results for the FU mode pulsators. Figure 10 shows the result. The values for the inclination angle and the position angle of the line-of-nodes are in good agreement with the previous results for Cepheids quoted at the beginnning of this section, that were obtained using far fewer Cepheids but covering a larger area.
The -relations are fitted taking away the depth effect, and the results are listed in Table 2 (solutions 9&10), and plotted in Figs. 11-12 for FU and FO pulsators. The dispersion is lowered significantly but is still larger than that in the -relation for the LMC Cepheids, indicating a substantial intrinsic depth of the SMC.


The total depth effect, if the intrinsic scatter in the -relation were zero, over all stars in the direction of the SMC bar is about 20 kpc (Fig. 13), with the depth along any given line-of-sight towards the bar being about 16 kpc (see Fig. 8 lower left panel). These values are in fact upper limits because of the intrinsic scatter in the -relation. Previously it was shown that the intrinsic depth of the LMC is negligible and that the scatter in the LMC -relation is intrinsic. If it is assumed that the intrinsic scatter in the SMC -relation is the same, this would imply that the intrinsic depth of the SMC translates into a dispersion of about mag meaning that the above numbers should be multiplied by 0.7 to get the true depth effect. The estimates for the depth of the SMC are consistent with those based on independent analysis, as quoted in Westerlund (1997, his Sect. 12.2.1).

| Galaxy | ||
|---|---|---|
| LMC | ° | ° |
| SMC | ° | ° |
5 Infrared -relations
In this section infrared -relations in the SMC and LMC will be determined, based on the ogle Cepheids that have a counterpart in the 2mass survey.
The observed magnitudes are first corrected for reddening. The of the respective ogle field is used (U99b,c), a selective reddening of 3.1 is used, and the extinction curve of Cardelli et al. (1989). In particular, , and are used. Second, the 2mass magnitudes are transformed to the Carter system using the average formulae derived in Sect. 3 (that is, (Carter) (2Mass) = +0.02, (Carter) (2Mass) = , (Carter) (2Mass) = +0.05). Third, the planar effect is taken out using the adopted values in Table 3 based on the results obtained from the FU pulsators.
One issue that is important here is Malmquist bias. For short periods only the on average brighter Cepheids have been detected by 2mass because the magnitudes are near the detection limit of 2mass. Not taking this effect into account would lead to a derived slope of the -relation which is too shallow (see Lanoix et al. 1999b). The nominal completeness limits are = 15.8, = 15.1 and = 14.3 mag but at higher galactic latitude the 2mass catalog contains accurate detections 0.5-1.0 mag fainter than this (Cutri et al. 2000).
Table 4 contains the derived -relations in the different bands, on the Carter system, and with the planar effect taken out. Different cut-offs in were tested to ensure that the slopes are unbiased. The -relations are displayed in Figs. 14-25. The dispersions are generally slightly larger than quoted in the literature (for example, 0.16, 0.12, 0.12 mag in the -relation for FU pulsators in respectively [Gieren et al. 1998, using 59 Cepheids in the LMC]), but this is due to the fact that single-epoch infrared photometry is used here, while the data that Gieren et al. use is based on intensity-mean magnitudes. Peak-to-peak amplitudes depend on period and wavelength but can be 0.2-0.6 mag in the infrared (Laney & Stobie 1986b). The fact that the sample studied here is an order of magnitude larger than previously studied still allows for very accurate determinations of the slope and zero point of the infrared -relations.
Some tests were made to check the influence of the adopted reddening. Decreasing in steps of 0.01 mag will make the respective zero points in fainter in steps of respectively 0.009, 0.006 and 0.004 mag. For reference, based on the solutions in the -band, the average is 0.148 for the FU pulsators, and 0.156 for the FO pulsators in the LMC (averaged over all periods), and respectively 0.091 and 0.092 for the FU (for ) and FO (for ) pulsators in the SMC.
There is some evidence that the selective reddening towards the LMC is lower than the adopted value of 3.1 (Misselt et al. (1999) derive values for towards LMC stars that range between 2.16 0.30 and 3.31 0.20, with un unweighted mean of 2.55). Chosing would make the respective zero points in fainter by respectively 0.037, 0.021 and 0.005 mag in the LMC, and fainter by respectively 0.008, 0.008 and 0.006 mag in the SMC.
| solution | N | Remarks | ||||
|---|---|---|---|---|---|---|
| 1 | 16.032 0.025 | 0.168 | 472 | LMC; FU; ; 3 clipping | ||
| 2 | 16.048 0.023 | 0.161 | 493 | LMC; FU; all ; 3 clipping | ||
| 3 | 16.356 0.025 | 0.173 | 490 | LMC; FU; all ; 3 clipping | ||
| 4 | 15.533 0.032 | 0.137 | 238 | LMC; FO; ; 3 clipping | ||
| 5 | 15.550 0.024 | 0.126 | 263 | LMC; FO; all ; 3 clipping | ||
| 6 | 15.817 0.027 | 0.140 | 267 | LMC; FO; all ; 3 clipping | ||
| 7 | 16.494 0.026 | 0.194 | 418 | SMC; FU; ; 3 clipping | ||
| 8 | 16.475 0.025 | 0.182 | 414 | SMC; FU; ; 3 clipping | ||
| 9 | 16.771 0.027 | 0.199 | 418 | SMC; FU; ; 3 clipping | ||
| 10 | 15.937 0.068 | 0.178 | 156 | SMC; FO; ; 3 clipping | ||
| 11 | 15.990 0.062 | 0.162 | 162 | SMC; FO; ; 3 clipping | ||
| 12 | 16.292 0.070 | 0.183 | 158 | SMC; FO; ; 3 clipping |


6 Discussion
6.1 The slopes of the relations
One of the main results of this paper is the derivation of the slopes of -relation in the Wesenheit-index (), and in , for both FU and FO pulsators. In this section the slopes are intercompared, compared to previous determinations, and to predictions of theoretical models.
The first thing to remark is that in the LMC the slope of the -relation of the FU and FO pulsators disagree at the 1.6-2.9 level. For all 4 bands the slope of the -relation of the FO pulsators is steeper than that of the FU pulsators. In the SMC, the slope of the -relation of the FO pulsators is steeper than that of the FU pulsators in , but in all 4 bands the difference is less than 1, largely influenced by the fact that the error in the slope of the -relation for the SMC FO pulsators is relatively large.
The second thing to remark is that for the FU pulsators the slope for the -relation of the LMC and SMC Cepheids agree within in . In the slope of the -relation for the LMC pulsators is steeper than that for the SMC pulsators at about the 1.7-2.2 level. For the FO pulsators the slope of the -relation for the LMC Cepheids is steeper than that of the SMC Cepheids in all 4 bands but the difference is 1.5 in and less in .
Table 5 collects slopes quoted in the literature both from observations and theoretical models, and the final values derived in the present paper. Regarding the Wesenheit-index, the only previous determination was by Tanvir (1999), who used a different definition for this index and so can not be compared directly to the present result. The results by U99a are essentially based on the same sample considered here and hence are very close to the present results.
Regarding the IR relations, the slopes derived in the present work are the most accurate available for the moment. The slopes agree with in the errors with all previous determinations. The previously most accurate slopes were by Gieren et al. (1998)444I have calculated the error in the slope using the data they kindly provided (their Table 9), and made a division on period as the sample they consider almost exclusively contains Cepheids with long periods, unlike the ogle sample.. Also here the agreement is excellent. The reliability of the result is enhanced if one considers that the Gieren et al. sample contains mainly long-period Cepheids while the ogle sample is dominated by short-period Cepheids.
The agreement with theoretically predicted slopes is less satisfactory. For the Wesenheit-index the predicted slopes by Bono & Marconi (2000, private communicataion) are too shallow compared to the observations at the 2-4 level. In the models by Alibert et al. (1999) are clearly too steep. In the agreement with the Bono et al. (1999) models is within the errors, but the Alibert et al. (1999) models predict slopes that are too steep.
Bono et al. (1999) are the only ones to predict the slopes for FO-pulsators (averaged over = 0.02, 0.008 and 0.004). Their prediction is in good agreement with the observed slope in the LMC and within 2 of the observed slope in the SMC.
Clearly, the present results can be used as tight constraint for theoretical modelling as for the first time accurate slopes in the infrared for both FU and FO pulsators are presented.
| Slope | Colour | System | Reference |
|---|---|---|---|
| Emperical results, FU pulsators | |||
| Wesenheit | LMC | this work | |
| Wesenheit | LMC | Tanvir (1999); for | |
| Wesenheit | LMC | Udalski et al. (1999a) | |
| Wesenheit | SMC | this work | |
| Wesenheit | SMC | Udalski et al. (1999a) | |
| J | LMC | this work | |
| J | LMC | Gieren et al. (1998) | |
| J | LMC | this work; 54 stars with from Gieren et al. (1998) | |
| J | LMC | this work; 5 stars with from Gieren et al. (1998) | |
| J | LMC | Madore & Freedman (1991) | |
| J | LMC | Laney & Stobie (1986a; their solution 1b) | |
| J | SMC | this work | |
| J | SMC | Laney & Stobie (1986a; their solution 10b) | |
| H | LMC | this work | |
| H | LMC | Gieren et al. (1998) | |
| H | LMC | this work; 54 stars with from Gieren et al. (1998) | |
| H | LMC | this work; 5 stars with from Gieren et al. (1998) | |
| H | LMC | Caldwell & Laney (1991) | |
| H | LMC | Laney & Stobie (1986a; their solution 2b) | |
| H | LMC | Madore & Freedman (1991) | |
| H | SMC | this work | |
| H | SMC | Caldwell & Laney (1991) | |
| H | SMC | Laney & Stobie (1986a; their solution 11b) | |
| K | LMC | this work | |
| K | LMC | Gieren et al. (1998) | |
| K | LMC | GO00 [54 stars with from Gieren et al. (1998)] | |
| K | LMC | GO00 [ 5 stars with from Gieren et al. (1998)] | |
| K | LMC | Madore & Freedman (1991) | |
| K | LMC | Laney & Stobie (1986a; their solution 3b) | |
| K | SMC | this work | |
| K | SMC | Laney & Stobie (1986a; their solution 12b) | |
| Theoretical results, FU pulsators | |||
| Wesenheit | 0.02 | Bono & Marconi (2000, private communication) | |
| Wesenheit | 0.008 | Bono & Marconi (2000, private communication) | |
| Wesenheit | 0.004 | Bono & Marconi (2000, private communication) | |
| J | 0.01 | Alibert et al. (1999) | |
| J | 0.004 | Alibert et al. (1999) | |
| K | 0.008 | Bono et al. (1999) | |
| K | 0.01 | Alibert et al. (1999) | |
| K | 0.004 | Bono et al. (1999) | |
| K | 0.004 | Alibert et al. (1999) | |
| Emperical and theoretical results, FO pulsators | |||
| K | LMC | this work, FO-pulsators | |
| K | SMC | this work, FO-pulsators | |
| K | all | Bono et al. (1999), FO-pulsators | |
6.2 The relative distance SMC-LMC
These results allow a determination of the relative distance SMC to LMC, based on the various -relations. Since the slopes of the -relations in SMC and LMC are not exactly the same, the absolute magnitudes are calculated for when using FU pulsators, and for FO pulsators for each Cloud and then subtracted, using the -relations where the distance effect has been taken out. The results are listed in Table 6. The errors are based on the errors in the slope and zero point. It seems that the difference in distance modulus is somewhat less using the IR -relations than from the Wesenheit-index. A mean using all available 8 determinations yields mag. This is in good agreement with the original determination in U99c based primarily on the Wesenheit index for the FU pulsators, and the 0.50 0.03 determined by Cioni et al. (2000b) as the average of the difference in and of the TRGB (Tip of the Red Giant Branch) magnitudes based on denis data for the two Clouds.
All this assumes no explicit metallicity correction. As recapitulated in GO00 there is no agreement between theory and empirical evidence, and amongst different theoretical models, about the extent of a metallicity dependence of the -relation, if any. In the infrared and Wesenheit-index there are no empirical estimates for the metallicity dependence. Table 7 summarises the predictions of (LMC) (SMC) in for 2 sets of recent models at . Again the disagreement is obvious and at a level of upto 0.1 mag which is not negligible.
| Remarks | |
|---|---|
| 0.51 0.03 | U99c; W; FU |
| 0.510 0.023 | present work; W; FU |
| 0.522 0.042 | present work; W; FO |
| 0.479 0.044 | present work; K; FU |
| 0.488 0.091 | present work; K; FO |
| 0.465 0.041 | present work; H; FU |
| 0.511 0.081 | present work; H; FO |
| 0.469 0.044 | present work; J; FU |
| 0.534 0.092 | present work; J; FO |
| 0.475 0.022 | mean of the 6 IR determinations |
| 0.504 0.015 | mean of all 8 determinations |
| Reference | |||
|---|---|---|---|
| Bono et al. (1999) | |||
| Alibert et al. (1999) |
7 The zero point of the Galactic -relation
GO00 discuss in detail the sample of Galactic Cepheids with hipparcos parallaxes and the methods and relations used to compute the zero point of the Galactic -relation. Since the slopes in and differ from those used in GO00, new zero points calculations are necessary. They are summarised in Table 8, and have the same format as in GO00. It was remarked in GO00, and repeated here, that the zero point of both the and -relations for the sample of the 63 stars with infrared data differs by 0.10 mag from those using the full samples. Until infrared date for more Cepheids in hipparcos becomes available to better constrain this zero point, it seems prudent to add 0.10 mag to the zero points in as listed in Table 8.
As discussed in GO00, when taking into account the errors in reddening, period-colour relations, etc., an error term of 0.028 for and 0.011 in should be added in quadrature to the quoted errors, and the zero points should also be corrected for Malmquist-bias (+0.01 mag) as derived in GO00 from theoretical calculations and numerical simulations. The final zero points for the 4 values listed in Table 8 become respectively , , and .
These zero points can now be combined with the zero points of the LMC and SMC -relations to yields distances of 18.60 0.11 () and 18.55 0.17 () for the LMC, and 19.11 0.11 () and 19.04 0.17 () for the SMC. The distance to the LMC based on the Wesenheit index is identical to the value derived in GO00, which was based on the results of Tanvir (1999) for the Wesenheit index for a much smaller sample of LMC Cepheids. To these distances, systematic uncertainties must be considered due to the fact that the slope of the galactic -relation may not be the same as in the MCs and the uncertain metallicity effect. In GO00 these unceratinties were estimated to be in , and in .
I do not want to enter here into a discussion about the “long” and “short” distance scale to the LMC (see Gibson 1999 for an overview). The latest “short” distance modulus to the LMC based on the Red Clump method stands at 18.27 0.07 (Popowski 2000) or 18.24 0.08 (Udalski 2000). That to the SMC at 18.77 0.08 (Popowski 2000). The distance to the LMC and SMC derived here are “long” and in excellent agreement with those derived recently by Cioni et al. (2000b) using the TRGB-method from denis data of respectively 18.55 0.04 (formal) 0.08 (systematic) and 18.99 0.03 (formal) 0.08 (systematic), and with the distance to the SMC of 19.05 0.017 (standard error) 0.043 (systematic error) using FU/FO and FO/SO (Second Overtone) double-mode Cepheids (Kovács 2000) and 19.11 0.08 using pure SO and FO/SO double-mode Cepheids (Bono et al. 2000).
| Colour | N | Zero point | Assumed | Total | Remarks |
|---|---|---|---|---|---|
| Slope | Weight | ||||
| W | 191 | 0.104 | 5295.5 | All stars | |
| W | 191 | 0.104 | 5331.0 | All stars | |
| K | 63 | 0.169 | 1855.5 | All stars | |
| K | 63 | 0.169 | 1905.7 | All stars |
Acknowledgements
This publication makes use of data products from the Two Micron All Sky Survey, which is a joint project of the University of Massachusetts and the Infrared Processing and Analysis Center/California Institute of Technology, funded by the National Aeronautics and Space Administration and the National Science Foundation.
It is a pleasure to thanks René Oudmaijer and Maurizio Salaris for comments on earlier versions of this paper, and Giuseppe Bono and Marcella Marconi for calculating the -relation in the Wesenheit-index. Pascal Fouqué is thanked for providing tabular material in Gieren et al. (1998) in electronic format.
This research has made use of the SIMBAD database, operated at CDS, Strasbourg, France.
Appendix A
In this Appendix a comparison is presented between the denis and ogle and denis and 2mass for the respectively 173 and 141 LMC and SMC Cepheids in common. This has its limitations since the comparison is done using variable stars. Yet it may still be of interest to other workers, as such a comparison has not been done yet. The variability would increase the spread in any correlation but should not wash out any colour terms, if they exist.
The observed magnitudes are first corrected for reddening. The of the respective ogle field is used (U99b,c), a selective reddening of 3.1 is used, and the extinction curve of Cardelli et al. (1989). In particular, , and are used. Since the effective wavelengths of the denis and ogle and the denis and 2mass are very similar, no distinction between the respective filtersets is made. At the present level of accuracy this effect of differential reddening between the slightly different filters should be entirely negligible.
Figure A1 shows the differences between 2mass and denis and plotted versus 2mass , and ogle and denis and plotted versus denis . In the left panel, all stars are plotted, in the right panel a sub-sample is plotted using a criterium on the total error. Linear least-square fits were made and the results are listed in Table A1.
From this data, there is no evidence for a colour-term in and and the difference between ogle and denis , and 2mass and denis is less than 0.10 magnitude. In there seems to be a color term at the 3 level when all stars are used, which still is present at the 2 level when a subsample of stars with the smaller photometric errors is being used. The average difference (2Mass) (Denis) is +0.20 magnitudes, which is comparable to the observed scatter, which is an upper limit to the intrinsic scatter as two single-epoch data are being compared.
The conclusion is drawn from the present dataset that there is no evidence for colour terms when comparing ogle and denis , and 2mass and denis , and that any difference between the systems is less than 0.10 magnitude. Regarding 2mass and denis , there is evidence for a colour term, which amounts to a difference (2Mass) (Denis) = +0.20 magnitudes for a typical colour of .
| N | |||||
|---|---|---|---|---|---|
| (2Mass)-(Denis) | (2Mass) | 0.24 | 141 | ||
| (2Mass)-(Denis) | (2Mass) | 0.20 | 97 | ||
| (2Mass)-(Denis) | (2Mass) | 0.17 | 141 | ||
| (2Mass)-(Denis) | (2Mass) | 0.18 | 110 | ||
| (OGLE)-(Denis) | (DENIS) | 0.33 | 173 | ||
| (OGLE)-(Denis) | (DENIS) | 0.32 | 119 |

References
- (1) Alibert Y., Baraffe I., Hauschildt P., Allard F., 1999, A&A 344, 551
- (2) Bauer F., Afonso C., Albert J.N., et al., 1999, A&A 348, 175
- (3) Beichman C.A., Chester T.J., Cutri R., et al., 1998, PASP 110, 367
- (4) Bessell M.S., Freeman K.C., Wood P.R., 1986, ApJ 310, 710
- (5) Bono G., Caputo F., Castellani V., Marconi M., 1999, ApJ 512, 711
- (6) Bono G., Caputo F., Marconi M., 2000, preprint
- (7) Caldwell J.A.R., Coulson I.M., 1986, MNRAS 218, 223
- (8) Caldwell J.A.R., Laney C.D., 1991, in: “IAU symposium 148: The Magellanic Clouds”, Eds. Haynes R., Milne D., Kluwer, p. 249
- (9) Cardelli J.A., Clayton G.C., Mathis J.S., 1989, ApJ 345, 245
- (10) Carter B.S., 1990, MNRAS 242, 1
- (11) Carter B.S., Meadows V.S., 1995, MNRAS 276, 734
- (12) Cioni M.-R., van der Marel R.P., Loup C., Habing H.J., 2000a, A&A 359, 601
- (13) Cioni M.-R., Loup C., Habing H.J., et al., 2000b, A&AS 144, 235
- (14) Cutri R.M., Skrutskie M.F., Van Dyk S., et al., 2000, Explanatory Supplement to the 2MASS Second Incremental Data Release
- (15) Elias J.H., Frogel J.A., Matthews K., Neugebauer G., 1982, AJ 87, 1029
- (16) Epchtein N., Deul E., Derriere S., et al., 1999, A&A 349, 236
- (17) Feast M.W., Catchpole R.M., 1997, MNRAS 286, L1
- (18) Gieren W.P., Fouqué P., Gómez M., 1998, ApJ 496, 17
- (19) Gibson B., 1999, astro-ph/9910574v2
- (20) Groenewegen M.A.T, 1999, A&AS 139, 245
- (21) Groenewegen M.A.T, Oudmaijer R.D., 2000, A&A 356, 849 (GO00)
- (22) Kovács G., 2000, A&A 360, L1
- (23) Laney C.D., Stobie R.S., 1986a, MNRAS 222, 449
- (24) Laney C.D., Stobie R.S., 1986b, SAAOC 10, 51
- (25) Laney C.D., Stobie R.S., 1992, A&AS 93, 93
- (26) Laney C.D., Stobie R.S., 1994, MNRAS 266, 441
- (27) Lanoix P., Paturel G., Garnier R., 1999a, MNRAS 308, 969
- (28) Lanoix P., Paturel G., Garnier R., 1999b, ApJ 517, 188
- (29) Madore B., Freedman W.L., 1991, PASP 103, 933
- (30) McCall M.L., 1993, ApJ 417, L75
- (31) Misselt K.A., Clayton G.C., Gordon K.D., 1999, ApJ 515, 128
- (32) Nikolaev S., Weinberg M.D., 2000, astro-ph/0003012
- (33) Panagia N., 2000, in: “IAU Symposium 190: New vieuws of the Magellanic Clouds”, Eds. Chu Y.-H., Suntzeff N.B., Hesser J.E., Bohlender D.A., ASP, p. 549
- (34) Popowski P., 2000, ApJ 528, L9
- (35) Persson S.E., Murphy D.C., Krzeminski W., Roth M., Rieke M.J., 1998, AJ 116, 2475
- (36) Tanvir N.R., 1999, in: “Harmonizing Distance scales in a post-Hipparcos Era”, eds. D. Egret, A. Heck, ASP Conf. Ser. 167, p. 84
- (37) Udalski A., 2000, ApJ 531, L25
- (38) Udalski A., Szymański M., Kubiak M., et al., 1999a, AcA 49, 201 (U99a)
- (39) Udalski A., Soszyński I., Szymański M., et al., 1999b, AcA 49, 223 (U99b)
- (40) Udalski A., Soszyński I., Szymański M., et al., 1999c, AcA 49, 437 (U99c)
- (41) Weinberg M.D., Nikolaev S., 2000, astro-ph/0003204
- (42) Westerlund B., 1997, “The Magellanic Clouds”, Cambridge Astrophysics Series 29, CUP, p. 27-34
- (43) Zhao H., Evans N.W., 2000, astro-ph/0009155