Jet Energy and Other Parameters for the Afterglows of Gamma-Ray Bursts 980703, 990123, 990510, and 991216 Determined from Modeling of Multi-Frequency Data
Abstract
We model the radio, optical, and -ray emission for the afterglows of GRB 980703, 990123, 990510, and 991216, within the framework of relativistic jets, to determine their physical parameters. The models that yield acceptable fits to the data have jet energies mostly between to erg and initial opening angles between and . The external medium density is uncertain by at least one order of magnitude in each case, being around for GRB 980703 and 990123, for GRB 990510, and for GRB 991216. If the jets are uniform (i.e. there are no angular gradients of the energy per solid angle) then the 20 keV – 1 MeV radiative efficiency during the GRB phase must have been at least 2-3% for GRB 990510, 20% for GRB 990123, and 30% for GRB 991216.
Dept. of Astrophysical Sciences, Princeton University, Princeton, NJ 08544
and Institute for Advanced Study, Olden Lane, Princeton, NJ 08540
Subject headings: gamma-rays: bursts - ISM: jets and outflows - methods: numerical - radiation mechanisms: non-thermal - shock waves
1 Introduction
There are two basic quantities one needs to try understanding the nature of any astronomical source – the distance and the energy of the source. For the long duration GRBs, lasting more than 10 seconds, the former is well established to be cosmological. However, the energy associated with the GRBs remains uncertain.
The efficiency of producing -ray emission in the generally accepted internal shock model (Mészáros & Rees 1994), which can explain the observed temporal variability, is less than a few percent (Kumar 1999, Lazzati, Ghisellini & Celotti 1999, Panaitescu, Spada & Mészáros 1999, see also Beloborodov 2000). This suggests that the total energy in the explosion is larger than the energy observed in -rays by a factor of 20–50.
The goal of this work is to infer the physical parameters of the ejecta, including their energy and the external medium density, from modeling of radio, optical and -ray data for GRB afterglows with known redshifts. The modeling is carried out in the framework of collimated ejecta interacting with an isotropic external medium. The model is described in §2 and the results of the numerical calculations for individual afterglows are given in §4.
2 Description of the Model
In calculating the jet dynamics, we assume that the energy and baryon density within the ejecta do not have an angular dependence, and that the external medium is isotropic. We also assume that, at any time, the physical parameters and bulk Lorentz factor are the same in the entire swept up external gas. We include the effect of radiative energy losses on the jet dynamics.
For the calculation of synchrotron emission, we assume a tangled magnetic field and that the electrons accelerated at shock have a power-law distribution. The electron distribution resulting from the continuous injection at shock and adiabatic+radiative cooling is approximated by broken power-law, with a break at the minimum random Lorentz factor of the freshly injected electrons and another one at the cooling electron Lorentz factor. In calculating the received flux, the swept up gas is approximated as a surface, i.e. the thickness of the emitting shell is ignored. The effect of this surface curvature on the photon arrival time and energy is taken into account.
2.1 Dynamics
The interaction between the relativistic ejecta that generated the GRB with the external gas continuously decelerates the jet and heats the newly swept up gas. Assuming that the heated gas has a uniform temperature, equal to that of the freshly shocked fluid, the total energy of the GRB remnant is:
| (1) |
where is the mass of the ejecta, whose Lorentz factor and energy at the end of the GRB phase are and , respectively.
In the above equation, is the mass of the swept up external gas, given by
| (2) |
where is the external medium density ( for homogeneous gas, for a wind ejected at constant speed before the release of the ultra-relativistic ejecta), and is solid angle of the jet.
The jet half opening angle increases due to the lateral spreading of the jet at the local sound speed :
| (3) |
and being the time measured in the ejecta comoving and laboratory frames, respectively. The speed of sound is (see Huang et al. 2000)
| (4) |
where and are the comoving internal energy and rest mass densities, respectively, and is the adiabatic index. In the relativistic limit and , while for non-relativistic speeds and , where is the radial expansion speed. We relate the adiabatic index with through a simple formula, which has the above asymptotic limits.
The energy losses through synchrotron and inverse Compton emissions is given by
| (5) |
where is the magnetic field intensity, the Compton parameter, is the normalized electron distribution (§2.2), and is the electron random Lorentz factor.
2.2 Electron Distribution and Spectral Breaks
The magnetic field intensity is parameterized relative to its equipartition value
| (6) |
where is the comoving frame rest-mass density.
The distribution of the electrons accelerated by the forward shock and injected in down-stream is assumed to be a power-law of index
| (7) |
where is the minimum, injected electron Lorentz factor, parameterized relative to its value at equipartition,
| (8) |
and is an upper limit, determined by the conditions that the acceleration timescale of such electrons does not exceed the radiative losses timescale, and that the total energy in the injected electrons does not exceed a certain fraction of the available internal energy. The former condition leads to
| (9) |
where is the ratio of the acceleration timescale to the gyration time. The latter condition can be written as
| (10) |
where is normalized (to unity), and and are the electron and proton mass, respectively. Equation (10) leads to an algebraic equation which can be solved numerically. The upper limit is the minimum between and above. Unless is larger than about , the upper limit given in equation (9) is sufficiently high that the synchrotron emission from -electrons is above the soft -ray domain. However if and is not much larger than , the upper limit given by equation (10) may be sufficiently low to yield a break of the afterglow emission at the frequencies of interest (-rays and even optical). For numerics we shall use and , the latter corresponding to equipartition between electron and protons.
The distribution of cooled electrons is a power-law of index 2 if the electrons are cooling faster than the dynamical timescale, and a power-law steeper by unity than the injected distribution in the opposite case (Sari, Piran & Narayan 1998). Therefore the electron distribution resulting from injection at shock and radiative cooling is
| (11) |
for fast cooling electrons (), and
| (12) |
for slow cooling electrons (). In equations (11) and (12), is the cooling electron Lorentz factor, defined by the equality of its radiative cooling timescale with the dynamical timescale:
| (13) |
The Compton parameter is given by
| (14) |
where and is the optical thickness to electron scattering:
| (15) |
The Klein-Nishina effect reduces the inverse Compton losses above an electron Lorentz factor approximated as the geometric mean of the electron Lorentz factor for which scattering of the synchrotron photons emitted by such an electron occurs at the Klein-Nishina limit and of the electron Lorentz factor for which scattering of the synchrotron photons emitted by -electrons is at the same limit. The comoving frame synchrotron characteristic frequency for an electron of Lorentz factor is
| (16) |
We take into account the Klein-Nishina reduction by calculating the integral in equation (14) up to if , and by switching off the inverse Compton losses above in the integral given in equation (5).
The synchrotron self-absorption frequency in the fluid rest frame is at with given by (see Panaitescu & Kumar 2000)
| (17) |
This equation is valid only if .
2.3 Received Flux
The synchrotron spectrum is approximated as piece-wise power-law (see Sari et al. 1998) with breaks at the injection, cooling, and absorption breaks given by equations (16), (8), (13), and (17).
To calculate the afterglow flux seen by the observer, we consider that the emitting shell is infinitely thin and that the observer is located on the jet axis. Consider an annular region of area , with , where is the polar angle, measured relative to the jet axis. The energy emitted in the comoving frame per unit time and frequency is , where is the radiative comoving power per electron and is the electron surface density. The infinitesimal comoving energy emitted per solid angle is relativistically beamed toward the observer by a factor and boosted in frequency by a factor , where , with . Therefore the infinitesimal flux received by the observer at frequency , during satisfies
| (18) |
where is the sum of synchrotron and inverse Compton emissions, is the afterglow redshift, and is the luminosity distance. We assume a Universe with , , and .
The flux received by the observer at time is that given by equation (18), integrated over the entire evolution of the source. Using and relating the electron surface density to the jet mass and area, , equation (18) leads to
| (19) |
with given by the condition that light emitted from location arrives at observer at time . Thus equation (19) takes into account the spread in the photon arrival time due to the spherical curvature of the jet surface. In all our calculations it is assumed that the observer is on the jet axis.
3 Analytical Considerations
So far there are five afterglows (990123, 990510, 991216, 000301c, 000926) for which a break in the optical emission has been identified. In all these cases the break is seen at or after day. Within the framework of uniform ejecta interacting with isotropic media, there are two possible causes for such a break: the passage of a break frequency (injection, , cooling, , or that due the upper cut-off of the electron distribution, ), or the edge of the jet becoming visible to the observer (plus the changing dynamics due to the lateral spreading of the jet).
One can show that, within a factor of order unity, the break frequency is the same for both types of external medium:
| (20) |
where is the jet isotropic equivalent energy, is observer time in days, and the usual notation was used. Equation (20) shows that, unless the isotropic equivalent energy exceeds erg and the magnetic field is close to equipartition ( cannot be much higher than 0.1, as the fractional energy in electrons must be below unity), is below the optical range at day. Therefore it is very unlikely that the optical light-curve breaks are due to the passage of through the observational band. Moreover, if this were the case, then, at times before the light-curve break, the temporal index of the light-curve decay, , would be at most , which is much smaller than the observed ’s.
3.1 Passage of the Cooling Break
We consider here the afterglow emission at early times, when the effects due to collimation of ejecta are negligible, but sufficiently large that . In this case, the afterglow light-curves for slow cooling electrons () are given by (see Panaitescu & Kumar 2000)
| (21) |
for a homogeneous external medium (), where the last two rows represent the case when the electron cooling is dominated by inverse Compton scatterings. For a wind-like medium () and slow cooling electrons
| (22) |
The second row of equations (21) and (22) also gives the light-curve for and fast cooling electrons.
The temporal evolution of the cooling break frequency for and slow cooling electrons is given by
| (23) |
For and slow cooling electrons
| (24) |
The first row also gives the evolution of for fast cooling electrons, in which case is time-independent.
For a homogeneous medium, equation (23) shows that increases in time if the electron cooling is dominated by inverse Compton and if . From equation (21), the passage of through the observational band changes the light-curve decay index by
| (25) |
Note , i.e. the passage of always steepens the light-curve decay, even if increases in time, and that . In the case where is above optical and below -ray, the temporal indices of the -ray and optical light-curves differ by if decreases in time, and by if increases in time. Thus, for , the -ray emission decays faster than the optical one if or and .
3.2 Collimation of Ejecta
If the ejecta is collimated, the decay of the afterglow emission steepens around the time when , due to the altered jet dynamics and that the observer sees the edge of the jet. For
| (27) |
The coefficient above was determined numerically from the arrival time of the photons moving toward the observer along the jet axis. Photons emitted from other regions on the jet surface arrive later by a factor up to .
Around the jet dynamics changes from a quasi-spherical expansion with for ( for ) to a sideways expansion characterized by (Rhoads 1999). During the lateral spreading phase () the cooling frequency evolution is
| (28) |
assuming slow cooling electrons (). Then it can be shown that, at , the light-curve is given by
| (29) |
Evidently, as the source slows down, the parameter eventually falls below unity and the last two cases given in equation (29) approach asymptotically . The results given in equations (28) and (29) ignore multiplying terms that are powers of the jet radius , which increases logarithmically with the observer time. With the same approximation, they also hold for a jet interacting with a pre-ejected wind. Furthermore, these results are accurate only at times when the afterglow is very relativistic. From numerical calculations we found that, for the first case given in equation (29), the decay index is approximated by with an error less than 10% if .
Using equations (21), (22), and (29) it can be shown that, for , the magnitude of the break due to collimation of ejecta is
| (30) |
for and
| (31) |
for . The finite opening of the ejecta yields for and for (Panaitescu, Mészáros & Rees 1998) when the jet edge becomes visible, the remainder of the steepening being due to the sideways expansion of the jet (Kumar & Panaitescu 2000). Equations (30) and (31) show that, if , for and for .
3.3 What Can We Infer from the -ray
and Optical Decay Indices ?
The most important difference between a break due to passage of and one due to collimation of ejecta is the chromaticity of the former and the achromaticity of the latter. This would be the best criterion to distinguish between them if optical and -ray observations spanning the same 1–2 decades in time, around the time when the break is seen, are available.
The analytical results presented in §3.1 and §3.2 allow us to draw some conclusions even when the existence of simultaneous -ray and optical light-curve breaks cannot be clearly established. Equations (25), (26), (30), and (31) show that optical break magnitudes can be produced only by the passage of the cooling break, while can be due only to collimation of ejecta. The caveat of this criterion is that, as shown by Kumar & Panaitescu (2000), for collimated ejecta, the completion of most of is spread over at least one decade in observer time for and over at least two decades for . Therefore observations spanning a shorter time range will underestimate the true magnitude of the jet edge break, particularly in the case when the observer is not located close to the jet axis.
The results presented in §3.1 and §3.2 also lead to the following criteria for determining the location of relative to the optical and -ray domains, and for identifying the type of external medium, from the optical and -ray decay at the same time:
-
1.
if , then either is not between the optical and -ray domains, or it is in this range but is quasi-constant in time. The latter may occur either in collimated ejecta during the sideways expansion phase, or before jet edge effects are important, in models, if the inverse Compton cooling is the dominant process and if (see eq. [23]).
-
2.
if (i.e. the -ray decay is faster than in the optical), then and the external medium is homogeneous. Furthermore either the electron cooling is synchrotron dominated or, if Compton-dominated, .
-
3.
if , then and either the external medium is a wind-like or it is homogeneous and the electron cooling is inverse Compton–dominated (), with .
Using the observed spectral slope in the optical range and the relative intensity of the -ray and optical emission, one can eliminate some of the above cases, and further reduce the number of potentially good models for a given afterglow.
4 Individual Afterglows
The modeling of GRB afterglow light-curves is carried out by solving numerically equations (1), (2), (3), and (5), to determine the dynamics of the afterglow, and equation (19) to calculate the observed flux. The six unknown parameters , , , , , and are determined by minimizing the between observed and model fluxes at the frequencies where most of the data is available. The jet initial Lorentz factor does not affect the afterglow emission if its evolution is quasi-adiabatic, because it drops out from the calculation of the jet Lorentz factor as a function of observer time. When radiative losses are taken into account, may have an effect on the afterglow emission, as the magnitude of these losses depends on . However, the effect is weak and cannot be used to set significant constraints on . For simplicity, we keep a fixed in all numerical calculations.
In this work we restrict our attention to four afterglows for which radio, optical, -ray light-curves and redshifts are available: GRB 980703, GRB 990123, GRB 990510, and GRB 991216, leaving out GRB 970508, whose optical light-curve cannot be entirely explained within the framework of our model, as it exhibited a brightening after 1 day, indicating a possible delayed energy injection, or fluctuations of the energy release parameters , or of the external density .
The near-infrared (NIR) and optical magnitudes are converted to fluxes using the characteristics of photometric bands published by Campins, Rieke, & Lebofsky (1985), and Fukugita, Shimasaku & Ichikawa (1995). We assumed a 5% uncertainty in the magnitude–flux conversion. The NIR and optical fluxes are corrected for dust extinction using the interstellar reddening curves of Schild (1977), Cardelli, Clayton, & Mathis (1989), and Mathis (1990). A 10% uncertainty is assumed for the Galactic extinction.
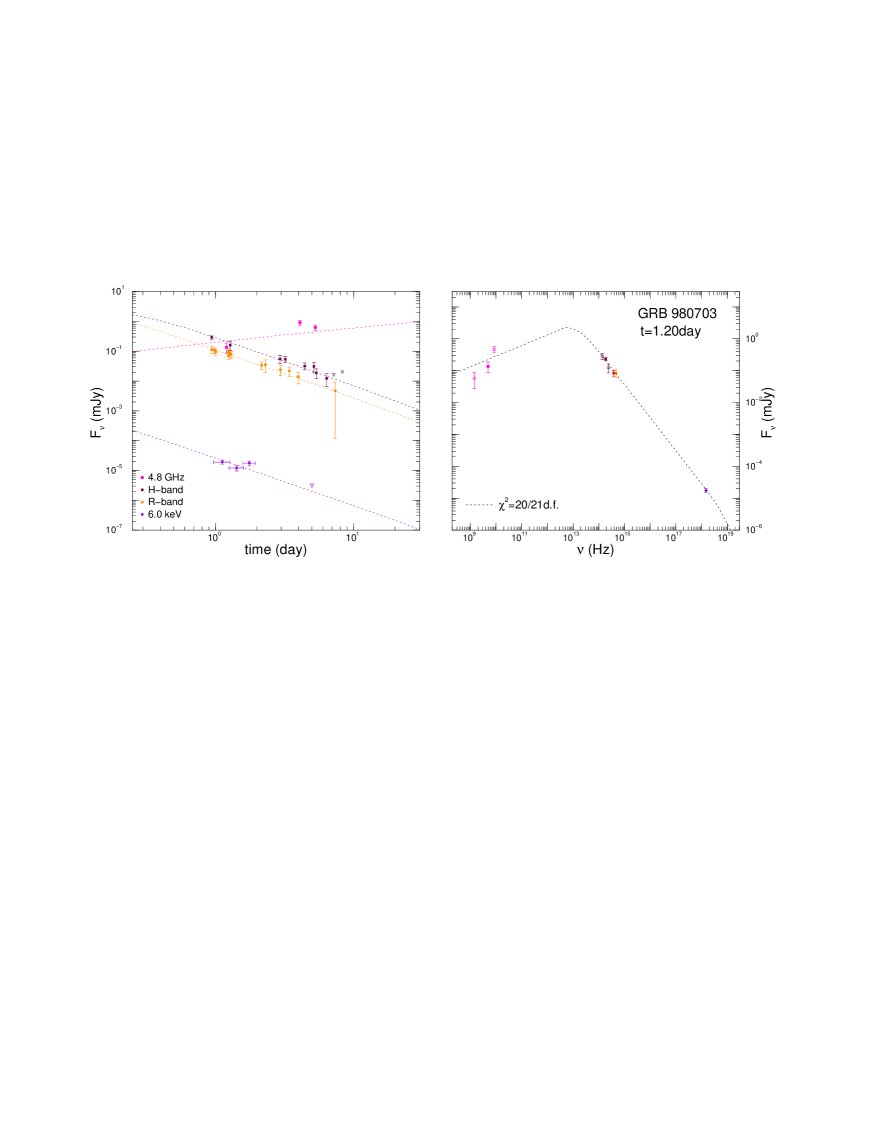
4.1 GRB 980703
The emission of the afterglow of GRB 980703 is dominated by the host galaxy at only few days after the main event. No break has been detected in the optical within this time interval, which means that we can set only a lower limit on the jet opening angle, by requiring to be sufficiently large.
The decay of the optical emission is characterized by a power-law index (Bloom et al. 1998), or (Castro-Tirado et al. 1999a), or (Vreeswijk et al. 1999), thus the average index is . The slope of the optical spectrum is (Vreeswijk et al. 1999) at day, and an -ray decay index was found by Galama et al. (1998). Thus the observations give . In view of the analytical considerations given in §3.1, the above marginally rules out only a model with and .
For and , the optical decay index is , thus observations require that , which implies . Such a spectrum is much harder than observed, therefore consistency between observations and the fireball model can be achieved only if there is a substantial extinction. Given that the Galactic extinction toward this afterglow is (Bloom et al. 1998), it follows that most this extinction is due to the host galaxy. Vreeswijk et al. (1999) have shown that the synchrotron power-law spectrum becomes consistent with the observed one for an intrinsic extinction of . At the same time the dereddened optical fluxes lead to , which is consistent with the dereddened , implying that the cooling break is above -rays.
For and assuming , leads to , therefore the observed requires and , which is again much harder than observed. Using the approximations found by Cardelli, Clayton, & Mathis (1989) for the UV interstellar reddening, one can show that dust extinction in the host galaxy steepens the synchrotron spectrum by at the frequency which is red-shifted in the observer -band. Therefore the synchrotron and observed spectra are consistent if , which is larger than for the model because a wind-like medium yields softer spectra for the same decay index . The corresponding dereddened optical emission has , which falls between the limiting values, and , allowed by the synchrotron model.
Thus the afterglow of GRB 980703 may be explained by models with homogeneous external media, , , and an intrinsic extinction , or by wind models with , , and . Figure 1 shows an model yielding an acceptable fit to the data.
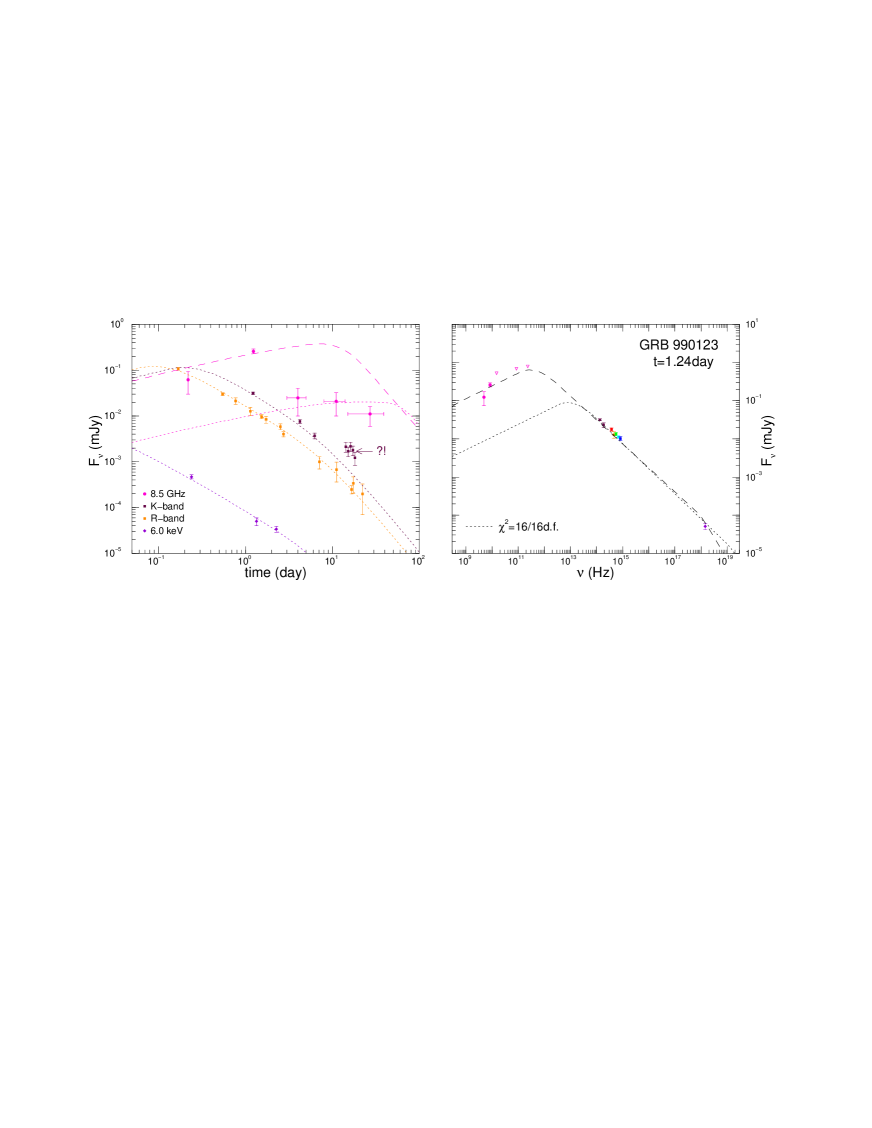
4.2 GRB 990123
After the subtraction of the host galaxy, the -band light-curve of the afterglow of GRB 990123 had a break around day (Kulkarni et al. 1999a), with the asymptotic logarithmic slope changing by from that at early times, , to after . The same break magnitude is implied by the power-law indices found by Castro-Tirado et al. (1999b). The reported slopes of the optical spectrum are at day (Galama et al. 1999), and at day (Kulkarni et al. 1999a). The optical-to--ray spectral slope reported by Galama et al. (1999) is at day. Therefore , indicating that the cooling break is not between optical and -ray frequencies at . The first BeppoSAX measurement (Heise et al. 1999) and the ASCA data (Murakami et al. 1999) give an -ray decay index for , therefore , consistent with both and .
If the break in the optical emission were due to the passage of the , then requires and an increasing (see §3.1). Equation (26) and the observed give . Then at , when , the optical-to--ray slope should be , clearly inconsistent with the observations. This shows that the optical break seen in this afterglow is not caused by the passage of .
A cooling frequency below optical cannot be accommodated by a jet model either, as the observed would imply , leading to a decay index (irrespective of the type of external medium) inconsistent with the observed value. Therefore the cooling frequency must be above -ray, implying . Then leads to , while yields . The latter case is clearly inconsistent with the observations.
From this analysis one can conclude that a successful model for the afterglow of GRB 990123 is that of a jet interacting with a homogeneous external medium, with parameters such that at , and . This value of implies an optical decay index substantially larger than found by Kulkarni et al. (1999a). However, the observations made after day do not span a sufficiently long time and may underestimate the asymptotic .
The radio and optical data at day give a radio-to-optical slope . If the injection break were below radio frequencies () at this time, then , inconsistent with the value derived above from the optical and -ray data. Therefore at . But in this case, as pointed out by Kulkarni et al. (1999a), the radio emission should rise until falls below . For a jet, this rise stops around and is followed by a constant emission until , after which the radio flux should decrease. However, the radio emission of 990123 exhibits a strong dimming around 2 days (see Figure 2) which, as suggested by the argument above, cannot be explained by the forward shock emission in a jet model (see the radio light-curve shown in Figure 2 with dashed line). We shall assume that the two earliest radio fluxes are produced by another radiation mechanism, for instance emission by cooled electrons that were accelerated by the reverse shock (Sari & Piran 1999) or emission from less relativistic ejecta surrounding the jet, and use these fluxes only as upper limits for the forward shock emission.
Figure 2 shows a jet model for the emission of 990123. The -band fluxes observed after 10 days lie above the model prediction, being inconsistent with an achromatic break resulting from collimation of ejecta. If the optical flash of GRB 990123 was due to a reverse shock propagating in the ejecta (Sari & Piran 1999), and if the peak of this flash, seen at seconds, corresponds to the fireball deceleration timescale, then the isotropic equivalent energy and external density of the model in Figure 2 imply that the fireball initial Lorentz factor was . Alternatively, the optical flash may have been caused by internal shocks in an unstable wind (Mészáros & Rees 1999, Kumar & Piran 2000), in which case is more uncertain.
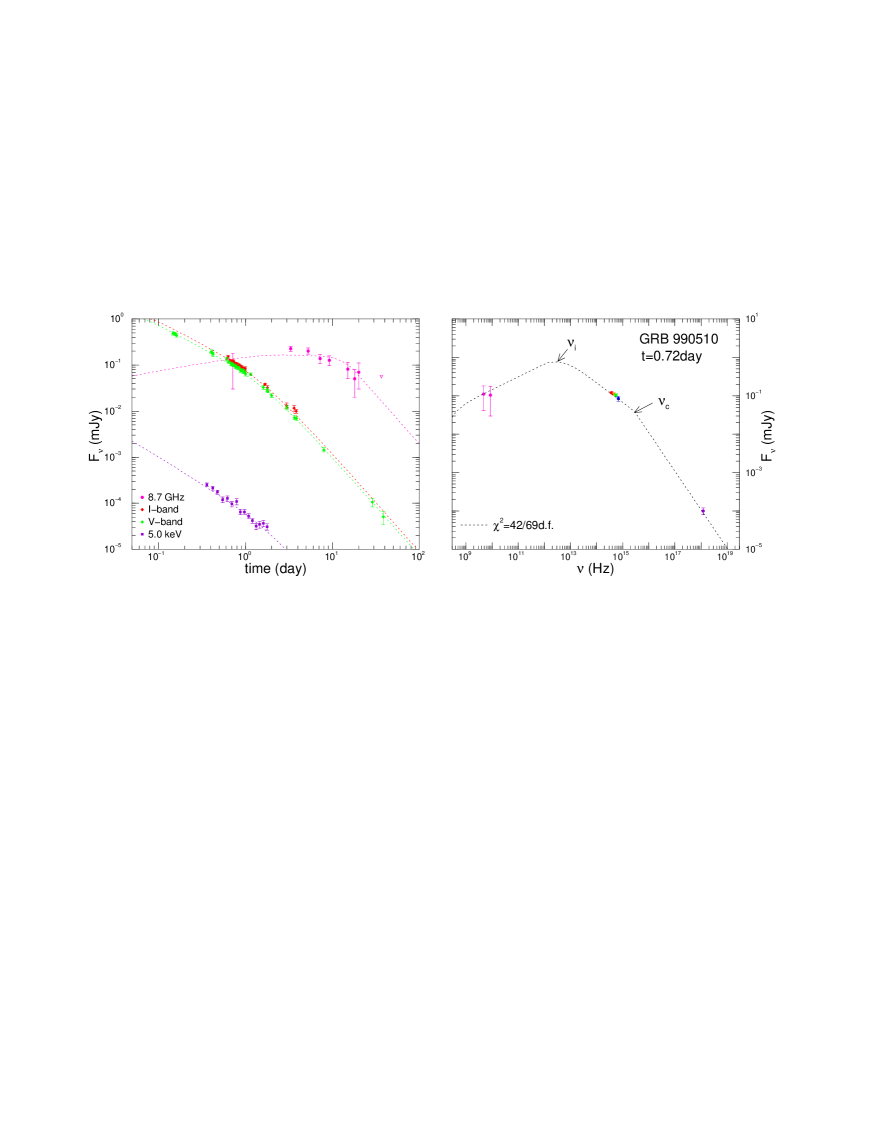
4.3 GRB 990510
The optical afterglow of GRB 990510 exhibited a break around day, whose reported magnitude is (Israel et al. 1999) in the -band, (Stanek et al. 1999), to (Harrison et al. 1999). The optical asymptotic decay indices found by Harrison et al. (1999) are and . The -ray decay index was (Kuulkers et al. 1999) at , while the optical spectral slope was (Stanek et al. 1999) at day. The available data imply an optical-to--ray slope at day.
Even the smallest reported is above , therefore the break seen in the optical emission cannot be due to the passage of (see §3.3) and must have been caused by jet effects. From one can infer that is between optical and -rays. The same conclusion is suggested by , however the -ray observations were made at times close to , thus the observed -ray decay index may overestimate the asymptotic at earlier times.
For a homogeneous medium , therefore observations require that , thus the analytically expected values of and are consistent with those observed. For a wind-like medium , requiring that , which leads to an optical slope inconsistent even with the softest optical spectrum reported by Stanek et al. (1999): . Such a small value of also implies , again inconsistent with the observations. Thus a wind-like medium is ruled out.
Therefore the afterglow of GRB 990510 can be accommodated by a model with , and . Note that the model shown in Figure 3 fits well the -ray data, the light-curve steepening being very slow.
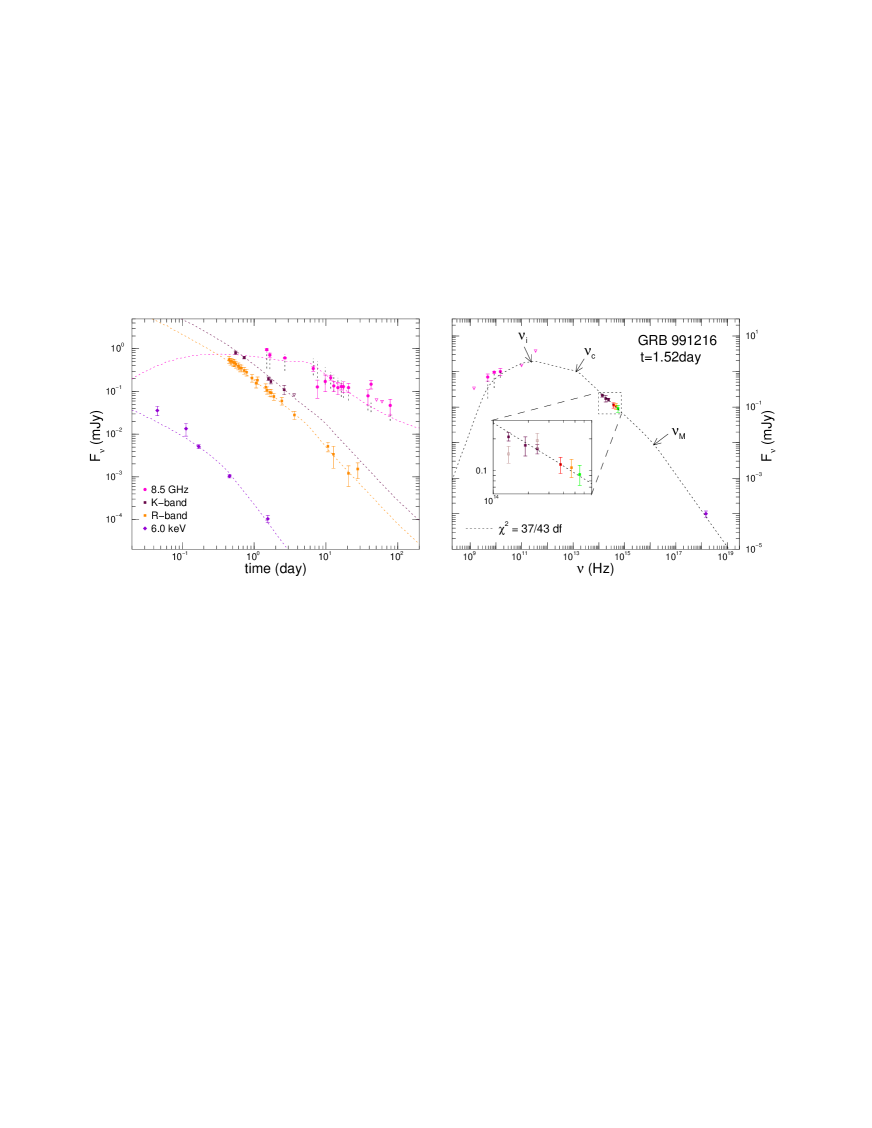
4.4 GRB 991216
The optical decay index of the afterglow of GRB 991216 was (Halpern et al. 2000, Sagar et al. 2000) at day. Halpern et al. have shown that a broken power-law optical light-curve with at plus the contribution from a galaxy located at arcsecond from the optical transient explains well the observations. Sagar et al. (2000) find that two measurements made after are dimmer by than the power-law extrapolation from earlier fluxes. Therefore there is evidence that the decay of the optical emission of the 991216 afterglow steepened by
The -ray data span 1.3 decades in time before and have (Frail et al. 2000, Halpern et al. 2000), leading to . The optical spectrum is puzzling, exhibiting a turn-over at the -band at day (Frail et al. 2000, Halpern et al. 2000), although the and -band measurements reported by Garnavich et al. (2000) restore a power-law spectrum of slope at day. Garnavich et al. (2000) have pointed out that, if extinction is overestimated by a factor 1.3–1.5 close to the Galactic plane (Stanek et al. 1999), the dereddened optical spectrum could be softer: . The optical-to--ray spectral slope is (Garnavich et al. 2000, Halpern et al. 2000) at day.
The faster decay seen in the -rays than in the optical before requires and a homogeneous external medium (see §3.3), in which case it is expected that . This difference is below the observed value. For , the analytical optical decay index is , thus observations imply . This leads to , which is consistent with the softer dereddened suggested by Garnavich et al. (2000). However, for such a spectrum, does not support a cooling frequency between optical and -rays.
If the optical light-curve break were due to the passage of then , consistent with the observations. Then at , when , the optical-to--ray slope should be , clearly inconsistent with the observations. Therefore the break in the optical emission of 991216 was not caused by the passage of . Instead, the small magnitude optical break could be explained by jet effects if the short time baseline of the observations after capture only a part of the full steepening.
However there are some major difficulties that a jet model with encounters. The decay index of the radio emission (Frail et al. 2000) at day requires the injection break to be below 10 GHz, which leads to a radio-to-optical spectral slope , while observations give at 2 days. Furthermore, the decay indices at radio and optical frequencies should be the same, yet observations show that . The discrepancy is large enough to suggest that a model with the above features cannot accommodate the optical and all the radio data. A possible solution is to “decouple” and by assuming that the radio emission until several days has a different origin, as we assumed for the early radio emission of 990123. Then the quasi-flat behavior of the radio data at 8–50 days (Figure 4) is suggestive of a jet undergoing lateral spreading and with above radio until 50 days, as this is the only way of obtaining a constant flux if the external medium is homogeneous (the analytical prediction for and after the jet edge is seen, , is based on some approximations that are not sufficiently accurate; numerically we obtain a slightly different behavior ).
There is, however, a model which does not require another emission mechanism besides the forward shock or a two-component structure of the jet (Frail et al. 2000), and which can accommodate the entire radio data. The almost constant flux exhibited by the radio emission at 1–3 days (Figure 4) can be explained by jet expanding laterally before 1 day, with the steepening of the radio emission at several days being due to the -passage. Then the steepening of the optical decay at few days is not due to jet effects, as suggested by Halpern et al. (2000), but to the passage of a spectral break. The cooling frequency does not offer a self-consistent picture: it should be above optical shortly before 2 days, as required by and, according to equation (28), it should increase in time because during the jet sideways expansion phase, thus it cannot cross the optical domain.
Within our afterglow modeling there is only one remaining possibility: the steepening of the optical emission is due to the passage of the frequency associated with the high energy break of the electron distribution (eq. [10]). As the jet model yields at all frequencies above (eq. [29]), the observed implies a very hard electron distribution with . Then the observed requires at 2 days, to obtain consistency with the analytical expectation .
Such a jet model with a hard electron distribution and cooling frequency below optical is shown in Figure 4. The observed optical emission steepens only mildly after 2 days, therefore the high energy break at is not too strong. For simplicity we have approximated this break as a softening of the electron distribution from to at , with a free parameter. The location of is set by the fractional electron energy up to (eq. [10]). Smaller values of , but larger than 0.1, also provide acceptable fits. The afterglow shown in Figure 1 is mildly relativistic after 10 days, so that departures from the analytically expected light-curve allow the model to accommodate both the optical decay before 2 days and the fall-off of the radio emission after 10 days. As illustrated in Figure 4 the effect of interstellar scintillation (Goodman 1997) is essential in explaining the departures between the observations and the model radio fluxes.
We note that a jet interacting with a wind-like external medium with yields fits with acceptable , but produces millimeter fluxes that exceed the upper limits shown in Figure 4 (right panel).
4.5 Parameter Ranges and Afterglow Energetics
The electron index and the initial jet opening angle are determined by the index of the power-law emission decay and by the time when jet effects set in, respectively (see eqs. [27], [21], and [22]). The remaining four model parameters, , , , and , can be determined from the three break frequencies , , (see eqs. [8], [13], [16], and [17]), and the synchrotron flux at the peak of the spectrum. Finding the location of the spectral breaks requires observations spanning a wide frequency range, from below the lowest break (self-absorption) to above the highest break (cooling, more likely). Even if this requirement is satisfied, observations in only three domains (radio, near infrared–optical, and -ray) do not determine all the spectral breaks unless the unconstrained break(s) cross(es) an observing frequency. This does not seem to be the case for the afterglows analyzed here, observations providing at most three “strong” constraints for four free model parameters. The number of constraints is even smaller if the interval between two adjacent observational frequencies does not contain a spectral break. For instance, in the case where , the -ray fluxes can be predicted from the optical emission and the spectral slope . If consistency is found between the model and the observed -ray fluxes, i.e. if the condition is indeed satisfied, then the -ray data will provide only a “weak” constraint, as they set only a lower bound on the cooling break frequency.
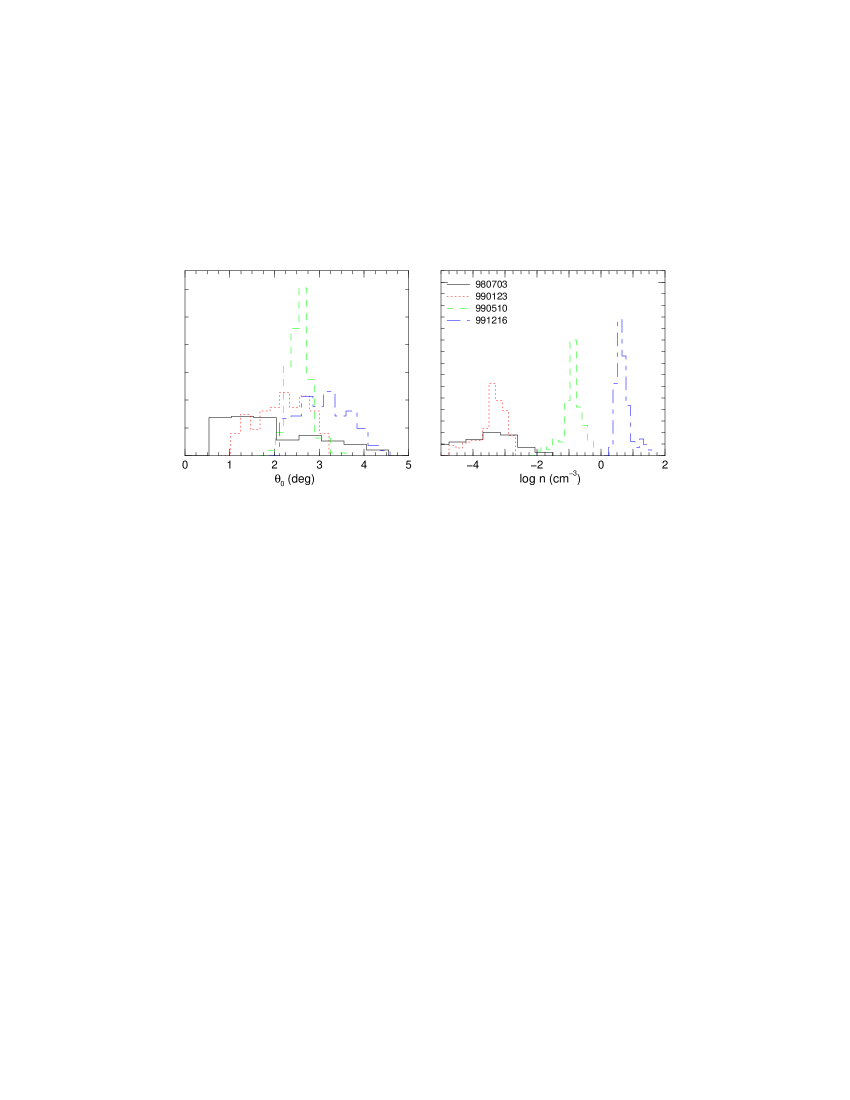
Therefore the uncertainty in the parameters of the afterglows analyzed in this work arises from that the number of effective observational constraints is smaller than the number of model parameters. To assess these uncertainties, we find sets of parameters which yield acceptable fits to the data, for a given isotropic equivalent energy . The distributions of the parameters for which the probability of exceeding the of the data is at least 20% are shown in Figures 5 and 6. Note that ranges from about to and that the external medium density spans four decades. Figure 6 shows the lack of a pattern in the electron and magnetic field parameters among the four afterglows. As expected, the index is well constrained for each afterglow, the light-curve decay being very sensitive to it. Note that, for the afterglows modeled here, does not have a universal value.
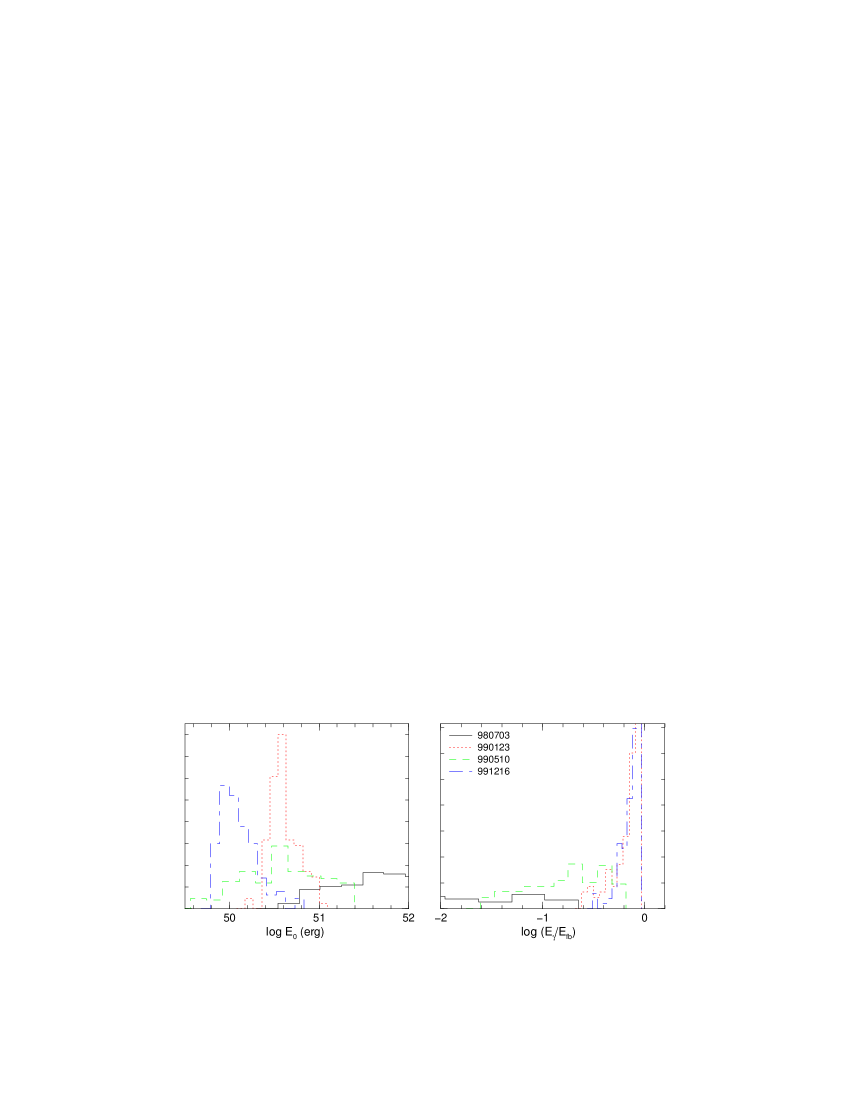
Figure 7 shows the distributions of jet energy and of the burst -ray efficiency, defined as the ratio of the isotropic equivalent of the energy released by the GRB in the 20 keV – 1 MeV range to the total fireball energy . The was calculated from the reported fluences above 20 keV (Kippen et al. 1998-9) and the measured redshifts: erg for GRB 980703, erg for GRB 990123, erg for GRB 990510, and erg for GRB 991216. Note that, when can be determined from observations, the jet energies are clustered in the to erg range, and that the minimum efficiency for GRBs 990123 and 991216 exceeds 20%.
5 Conclusions
We model the emission of GRB afterglows in the framework of collimated, uniform, lateral spreading jets interacting with an external medium. The model was used to determine the initial jet energy , opening angle , external medium density , and parameters and quantizing the minimum random Lorentz factor of shock-accelerated electrons and the strength of the magnetic field, respectively, for the afterglows of GRB 980703, 990123, 990510, and 991216.
As illustrated in Figures 5 and 6, the jet aperture and the index of the power-law distribution of electrons injected in the down-stream region are well constrained by observations, as the effects of collimation are seen at a time which depends strongly on (eq. [27]), while determines the afterglow decay rate (eqs. [21], [22], [29]). Other model parameters – , , and – are less well determined as observations in three frequency domains (radio, optical, and -ray) provide at most three constraints. Observations in a fourth domain, sub-millimeter, millimeter, or far-infrared, could help determine all the afterglow parameters, provided that the spectral breaks are located between adjacent observational frequencies.
Analysis of the available data for the 990123 and 990510 afterglows and the jet interpretation of the break exhibited by their optical emissions rule out a wind-like profile for the medium which decelerates the jet. However, the emission of the 980703 and 991216 afterglows can be accommodated by both types of external media (homogeneous or a pre-ejected wind). For 980703, 990123, and 990510, the allowed range of external densities is below , indicating that these bursts did not occur in hydrogen clouds.
For those afterglows with optical light-curve breaks we find jet energies lying mostly in the – erg range (Figure 7), and jet initial half-angles below . For the afterglow of GRB 970508, the only one observed in radio, optical and -ray that is not included in this work due to its non-standard optical and -ray brightening, Frail, Waxman & Kulkarni (2000) found a similar jet energy, erg, a much larger initial half-angle, , and an external density .
The minimum BATSE range (20 keV – 1 MeV) efficiency of the afterglows whose optical behavior indicates that the ejecta was well collimated ranges from 3% to 30% (Figure 7). The former limit is within the reach of current calculations of internal shock efficiency (Kumar 1999, Lazzati et al. 1999, Panaitescu, Spada & Mészáros 1999), but the latter exceeds it. However, if the energy distribution within the jet aperture is far from isotropy, such that the GRBs we see have an energy-per-solid angle peaking in the direction toward the observer, then the minimum required efficiency can be significantly smaller.
A.P. acknowledges support from the Lyman Spitzer Jr. fellowship. The work of P.K. is supported in part by NSF grant phy-0070928. The authors commend the work of Jochen Greiner, who maintains a very useful compilation of the available information on GRB afterglows at http://www.aip.de:8080/ jcg/grbgen.html.
REFERENCES
Beloborodov, A. 2000, ApJ, 539, L25
Beuermann, K. et al. 1999, A&A, 352, L26
Bloom, J. et al. 1998, ApJ, 508, L21
Bloom, J. et al. 2000, GCN∗ 756
Campins, H., Rieke, G., & Lebofsky, M. 1985, AJ, 90, no 5, 896
Cardelli, J., Clayton, G., & Mathis, A. 1989, ApJ, 345, 245
Castro-Tirado, A. et al. 1999a, ApJ, 511, L85
Castro-Tirado, A. et al. 1999b, Science, 283, 2069
Corbet, R. et al. 1999, GCN∗ 506
Djorgovski, S. et al. 1998, ApJ, 508, L17
Djorgovski, S. et al. 1999, GCN∗ 510
Frail, D. et al. 1999, GCN∗ 141
Frail, D., Waxman, E., & Kulkarni, S. 2000, ApJ, 537, 191
Frail, D. et al. 2000, ApJ, 538, L129
Fruchter, A. et al. 1999, GCN∗ 386
Fruchter, A. et al. 2000, GCN∗ 757
Fukugita, M., Shimasaku, K., & Ichikawa, T. 1995, PASP, 107, 945
Galama, T. et al. 1998, GCN∗ 145
Galama, T. et al. 1999, Nature, 398, 394
Garnavich, P. et al. 2000, ApJ, 543, 61
Goodman, J. 1997, New Astronomy, 2, 49
Halpern, J. et al. 2000, ApJ, 543, 697
Harrison, F. et al. 1999, ApJ, 523, L121
Heise, J. et al. 1999, IAUC 7099, GCN∗ 202
Huang, Y., Gou, L., Dai, Z., & Lu, T. 2000, ApJ, 543, 90
Israel, G. et al. 1999, A&A, 348, L51
Kelson, D. et al. 1999, IAUC 7096
Kippen, R. et al. 1998-9, GCN∗ 143, 224, 322, 504
Kulkarni, S. et al. 1999a, Nature, 398, 389
Kulkarni, S. et al. 1999b, ApJ, 522, L97
Kumar, P. 1999, ApJ, 523, L113
Kumar, P. & Piran, T. 2000, ApJ, 532, 286
Kumar, P. & Panaitescu, A. 2000, ApJ, 541, L9
Kuulkers, E. et al. 2000, ApJ, 538, 638
Lazzati, D., Ghisellini, G., & Celotti, A., 1999, MNRAS 309, L13
Mathis, J. 1990, ARA&A, 28, 37
Mészáros , P. & Rees, M.J. 1994, ApJ, 430, L93
Mészáros , P. & Rees, M.J. 1999, MNRAS, 306, L39
Murakami, T. et al. 1999, GCN∗ 228
Odewahn, S. et al. 1999, GCN∗ 261
Panaitescu, A., Mészáros , P., & Rees, M.J. 1998, ApJ, 503, 314
Panaitescu, A., Spada, M., & Mészáros , P. 1999, ApJ 522, L105
Panaitescu, A. & Kumar, P. 2000, ApJ, 543, 66
Pietrzynski, G. & Udalski, A. 1999, GCN∗ 319, 328
Piro, L. 1999, GCN∗ 500
Rhoads, J. 1999, ApJ, 525, 737
Rol, E. et al. 1999, GCN∗ 491
Sagar, R., Mohan, V., Pandey, A., & Castro-Tirado, A. 2000, BASI, 28, 15
Sari, R., Piran, T., & Narayan, R. 1998, ApJ, 497, L17
Sari, R. & Piran, T. 1999, ApJ, 517, L112
Schaefer, B. 2000, GCN∗ 517
Schild, R. 1977, AJ, 82, 337
Stanek, K., Garnavich, P., Kaluzny, J., Pych, W., & Thompson, I.
1999, ApJ, 522, L39
Takeshima, T. 1999, GCN∗ 478
Vreeswijk, P. et al. 1999, ApJ, 523, 171
Vreeswijk, P. et al. 2000, GCN∗ 751
Walker, M. 1998, MNRAS, 294, 307
∗ GCN Circulars can be found at http://gcn.gsfc.nasa.gov/gcn/