Interaction rates of dark-matter halos and subhalos
Abstract
The interaction rates of dark-matter halos and subhalos, including collisions and mergers, are computed using high-resolution cosmological -body simulations of the CDM model. Although the number fraction of subhalos of mass is only , we find that the interaction rate of such subhalos is relatively high because they reside in high density environments. At low redshift, the subhalo collisions dominate the total collision rate, and even at they are involved in more than 30% of all collisions. About 40% of the “major” mergers (those of mass ratio ) are between subhalos. Therefore subhalo interactions must be incorporated in models of structure formation.
We find that the collision rate between halos in physical density units, is , with , in agreement with earlier simulations and most observational data.
We test previous analytic estimates of the interaction rates of subhalos based on statistical models, which could be very inaccurate because of the small number of subhalos and the variation of conditions within small host halos. We find that, while such statistical estimates may severely overestimate the rate within hosts , typical of high redshifts, they are valid for larger hosts regardless of the number of subhalos in them. We find the ?) estimate of the subhalo merger rate to be valid for hosts at all redshifts.
The collision rate between subhalos and the central object of their host halo is approximated relatively well using the timescale for dynamical friction in circular orbits. This approximation fails in of the cases, partly because of deviations from the assumption of circular orbits (especially at low redshift) and partly because of the invalidity of the assumption that the subhalo mass is negligible (especially at high redshift).
1 Introduction
Interactions among dark matter halos and the galaxies that reside in them are inevitable in any cosmological scenario of hierarchical structure formation and have important observational implications. Halo interactions cause tidal stripping and harassment [Moore et al. (1998)]. They promote the exchange of angular momentum (e.g., [Barnes & Efstathiou (1987)]), trigger star bursts (e.g., [Mihos & Hernquist (1994a), Mihos & Hernquist (1994b)]), mix different stellar populations [Larson & Tinsley (1978)], produce tidal tails [Toomre & Toomre (1972), Dubinski et al. (1999), Springel & White (1999)], and change the galaxy morphology (e.g., [Oemler (1992)]). The tidal stripping and harassment that occur during these interactions enrich the intergalactic medium with processed elements [Kolatt et al. (2000)], disrupt existing galaxies, build new ones, and heat up the galaxy interior matter.
Galaxy interactions are observed directly (e.g., [Davis et al. (1997), de Mello et al. (1997), Conselice & Gallagher (1999), Neuschaefer et al. (1997)]) and indirectly by statistical means and through their outcomes [Abraham et al. (1997), Conselice et al. (2000), Wu (1999)]. The interaction rate rises as function of redshift [Le Fèvre et al. (2000), Patton & et al. (2000), Patton (1998), Carlberg et al. (1990), Zepf & Koo (1989)] (but cf. [Carlberg et al. (2000)]) and the density of the environment. Since the interaction rate is roughly proportional to the number density squared times the relative velocity, groups and clusters of galaxies show a higher specific interaction rate (per object) than the specific rate in the field.
The details of the physical processes that take place during and as a result of these interactions are not well understood. Gas dynamics, star formation and supernova feedback hinder a direct understanding of how such interactions influence the process of galaxy formation in general. In order to overcome this difficulty, semi-analytic investigations [Kauffmann et al. (1993), Cole et al. (1994), Somerville & Primack (1999), Somerville et al. (2000)] use simplified models for the merger rate of substructure (including the role of dynamical friction) in order to explore the possible implications of these events. These simplified models should be tested and improved by comparison with realistic cosmological simulations.
But even before addressing the additional physics involved in galaxy interactions, the halo gravitational interaction rate alone is too complicated to calculate analytically. The finite halo size and density profile, the many body interactions, the varying background potential all have their impact on the interaction rate.
The first stage of the theoretical exploration of gravitational halo interactions introduces the impulsive approximation [Spitzer (1958)], to estimate the effect of a close passage of two gravitationally bound systems. This approximation models the heating up of each individual system by the transfer of gravitational potential energy to internal kinetic energy. It also models the disruption by stripping and the contraction of the remaining debris. The impulsive approximation has been tested [Richstone (1975), Dekel et al. (1980)] in -body simulations where the effects of close encounters on mass exchange and profile evolution were addressed. The main objective of these investigations was to test mass loss due to tidal stripping. The conclusion was that although the impulsive approximation works well even beyond “fast” encounters, it is invalid for encounters with small impact parameters. Later, using two-halo -body experiments, ?) found that the impulsive approximation works only if the minimal distance between the passing halos is bigger than effective (de Vaucouleurs) radii. This clearly prevents the use of this approximation for close encounters and collisions.
The evolution of many-galaxy systems (rich clusters) was addressed by ?) with the inclusion of close encounters and tidal stripping, but not merging. Merritt investigated the question of mass segregation between subhalos and the host cluster, and found that the implied dynamical friction time is longer than would be expected without the presence of close encounters and tidal stripping.
Merging of dark matter halos was investigated on the basis of simulations by ?) (MH), who parameterized equal-mass mergers as a function of impact parameter and relative velocity for different initial density profiles. MH also explored the parameter space of very close passages.
Recently, many authors have performed detailed simulations of individual multi-halo systems (“clusters”) [Moore et al. (1996), Tormen (1997), Tormen et al. (1997), Tormen (1998), Ghigna et al. (1998), van den Bosch et al. (1999), Sensui et al. (1999), Okamoto & Habe (1999), Moore et al. (1999)]. These investigations focused on issues like tidal stripping, harassment, and orbital parameters. They led to various insights about the role interactions play within clusters, understanding how morphology changes due to fast encounters, how anisotropic orbits affect the final density profile, quantifying the dynamical equilibrium state in clusters, and quantifying the mass fraction of subhalos with respect to the diffuse matter. However, systems the size of rich and poor galaxy groups have been neglected until now. The present work is the first detailed investigation of subhalo encounters within a cosmological volume simulation.
Previously, the only relevant cosmological modeling of halo interactions has been via analytic methods such as the Press-Schechter (PS) formalism [Press & Schechter (1974)] and its extended versions (EPS) ([Lacey & Cole (1993), Lacey & Cole (1994)]). These theoretical predictions have been compared to -body results, with surprisingly good agreement (up to a factor of ) (e.g., [Gross et al. (1998), Somerville et al. (2000)]). Unfortunately EPS theory only accounts for mergers between distinct, virialized halos, and does not consider any other form of interaction. In particular EPS does not take into account non-merger interactions and does not provide the joint multiplicity-mass function of the progenitors (cf. [Somerville & Kolatt (1999)]). In addition, EPS theory neglects the spatial distribution of the existing halos, environmental dependence, and, most importantly, the interactions between subhalos within a given encompassing virialized host halo. All of these cases are extremely relevant to galaxy formation and evolution. For example, the results of MH were used by Somerville et al. (2000) to include in semi-analytic models the process of subhalo mergers, which they considered to be related to the Lyman break galaxies observed at high redshift (). In ?) we emphasize the role these collisions play, without appealing to MH but rather as identified in the high-resolution simulations studied in more detail here.
One may think that the shortcomings of the PS/EPS formalism may be overcome by using EPS to model isolated systems and then applying kinetic theory to virialized systems and substructure (cf. Somerville et al. 2000). However, this approach is questionable – first because of the cross-talk between isolated halos and subhalos, and then because of the limitations of the kinetic theory.
In the kinetic theory within the framework of statistical mechanics one predicts the collision rate among many bodies in a given system. When we calculate collision or merger rates in a gravitating many body system, the simple approach of kinetic theory is no longer valid. Several important differences prevent us from applying the conventional methods of statistical mechanics:
-
(i)
The gravitating systems under consideration are not necessarily in equilibrium. The velocity distribution function may be anisotropic, may deviate from the usually assumed Maxwellian distribution for relaxed systems, and may evolve in time. Moreover the number of “bodies” (i.e., halos) is not constant; halos may merge or dissolve and other new halos may enter the system or just pass through it in the course of time.
-
(ii)
The “bodies” are not equal, but exhibit a large range of masses. The mass function (and thus the cross section distribution) is complicated and evolves in time and space.
-
(iii)
The “bodies” are not point-like or rigid bodies, nor do they retain their identity; “bodies” may shrink, evaporate, grow, deform, etc.
-
(iv)
Gravitating systems exhibit “gravitational focusing” [Binney & Tremaine (1987)], i.e., an increase of the cross section due to the gravitational attraction between the interacting bodies.
-
(v)
Most of the gravitational systems under consideration are embedded within a background potential (e.g., individual galaxy halos in groups or clusters). This potential cannot in general be neglected. Moreover, the interplay between the cluster or group potential and its subhalos (see item (iii)) evolves in time.
-
(vi)
The effect of the background potential sometimes adds anisotropy to the orbits – for example spiraling-in of satellite halos within a host halo due to dynamical friction [Binney & Tremaine (1987)], or radial orbits along filaments and to the center of deep potential wells.
For the reasons outlined above, at present the only way to measure the halo interaction rate and other characteristics is to resort to high-resolution -body simulations. There are some minimum requirements for any simulation used to tackle such a problem. One needs a big enough dynamical range in spatial and mass resolution for the compilation of a statistical sample of the host/subhalo systems within a cosmological volume. The mass ratio between subhalos and hosts can range from to three or four orders of magnitude. The evolution of number density of the host halos and their subhalos is strongly dependent on the cosmological background and its ability to provide a fresh supply of progenitors throughout the host evolution. In addition, spatial resolution is of paramount importance since substructure tends to erase within the host unless the resolution allows its clear identification. Another necessary condition is the storage and analysis of many time-steps of the simulation to determine the temporal behavior and interaction of the substructure.
The simulations we use in the current analysis [Klypin et al. (1999)] meet all of these requirements, and in doing so represent an important advance in simulation technology. We have designed, tested, and used a new hierarchical halo finder ([Bullock (1999), Bullock et al. (2000)] hereafter BKS+) specifically for the goals of this paper.
In this paper we focus on the DM component alone and analyze the interactions between halos and within host halos – those that have at least one other halo within their virial radius. We make no discrimination by host or subhalo masses, though we sometimes segregate the results into clusters and groups. A major goal of this paper is to assess various estimates for the time scales in virialized systems that consist of distinct constituents.
In section 2 we briefly discuss the -body simulations and describe our strategy to find and model the dark matter halos. We shall then define the hierarchy we build for halos within the simulation and the various criteria for interactions. Section 3 prepares the ground for the interaction rate calculation by discussing the multiplicity function of host halos and its sensitivity to mass resolution. The multiplicity function plays an important role in various analytical estimates for the collision rate. In §4 we shall present the collision rate of halos, and the progenitor mass spectrum. A comparison to various approximations for collision timescales is carried out in §5, and we devote §6 to a similar evaluation of the dynamical friction timescale. We finally summarize our findings in §7.
2 Simulated halos
We used the Adaptive Refinement Tree (ART) code [Kravtsov et al. (1997)] to simulate the evolution of collisionless DM in the “standard” CDM model (; km s-1 Mpc-1; ). The simulation followed the trajectories of particles within a cosmological periodic box of size from redshift to the present. A basic uniform grid was used, and up to six refinement levels were introduced in the regions of highest density, implying a dynamic range of . The formal resolution of the simulation is thus , and the mass per DM particle is . We analyze 15 saved outputs at times between and .
A complementary, Mpc simulation of eight times higher mass resolution and two times higher force resolution is used to check issues of completeness and robustness to resolution. We analyze time-steps of this simulation in the range .
2.1 Model halos
The identification of halos is a key feature of the analysis; We try to make it objective and self-consistent when following halo interactions and mergers (see §2.4). Traditional halo finders utilize either friends-of-friends algorithms or overdensities in spheres or ellipsoids to identify virialized halos. These algorithms fail to identify substructure. We therefore have designed a new hierarchical halo finder, based on the bound density maxima (BDM) algorithm [Klypin et al. (1999)]. The details of the halo finder are described elsewhere ([Bullock (1999)],BKS+), and we summarize below only its main relevant features.
We impose a minimum number of 50 particles per modeled halo, unify overlapping maxima, and iteratively find the centers of mass of spheres about the maxima. We compute a spherical density profile about each center and identify the halo virial radius inside which the mean overdensity has dropped to a value , based on the spherical infall model. For the family of flat cosmologies (), the value of can be approximated by ([Bryan & Norman (1998)]) , where . In the CDM model used in the current paper, varies from about 200 at to at . If an upturn occurs in the density profile inside , we define there a truncation radius .
An important step of our procedure is the fit of the density profile out to the radius with a universal functional form. We adopt the NFW profile [Navarro et al. (1995)],
| (1) |
with the two free parameters and — a characteristic scale radius and a characteristic density. This pair of parameters could be equivalently replaced by other pairs, such as and . The minimum halo mass corresponding to 50 particles is (for the simulation). The modeling of the halos with a given functional form allows us to assign to them characteristics such as a virial mass and radius, to estimate sensible errors for these quantities, and to remove unbound particles. Using the NFW fits, we iteratively remove unbound particles from each modeled halo and unify every two halos that overlap in their and are gravitationally bound. Finally, we look for virialized regions within of big halos to enable subhalos near the centers of big host halos, e.g., mimicking cD galaxies in clusters.
Our halo finding is complete only for halos containing more than particles, i.e., of mass larger than (for the simulation) or (for the simulation). The resulting halo catalog is therefore gradually incomplete below these masses, as described in Bullock (1999) and ?) (hereafter SKB+). This should be kept in mind below, when we sometimes refer also to masses somewhat below the full completeness limit.
2.2 Hierarchy classification
Two halos are classified as a subhalo and a host when the center of the smaller halo lies within of the larger one. The one exception is the case we term “partners”, in which the two centers lie within of each other but the small halo is not fully contained within the large one and the mass ratio is smaller than 4/3.
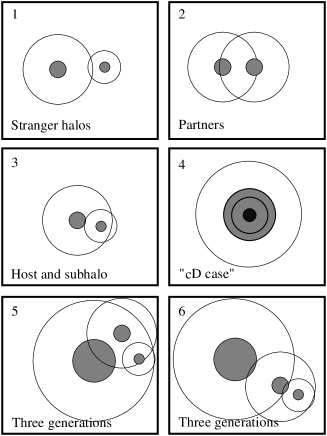
In the current application we limit ourselves to the first level of subhalos (but the classification scheme can straightforwardly be extended to deal with many levels of subhalos within subhalos and with other relations between halos). All halos that are not subhalos are termed “distinct” halos; they can be either “isolated” halos or hosts. Halos that do not host any subhalos are termed “simple” halos; these can be either isolated halos or subhalos. Figure 2 illustrates the different possible relationships and their classification.
2.3 Interaction definitions
The definition of halo interaction in an -body simulation is somewhat arbitrary. We can easily identify violent interactions, but more subtle phenomena are less evident. The borderline between a merger and a close encounter, for instance, should depend upon the final bound/unbound stage of a two body system, but finding a final bound state at some later timestep does not necessarily imply that a merger had occurred. Since in reality, as in the simulations, halos can disintegrate, or lose some of their mass during an interaction, the decision of what we would call a merger, namely what fraction of the progenitor halo mass should merge with another progenitor halo to form a united halo, is a matter of definition.
In our procedure we followed these guidelines: (a) All the definitions should be reproduceable within any -body simulation that is being analyzed. (b) Avoid arbitrariness as much as possible in the interaction definitions. (c) Avoid sensitivity of the results to particular choices of interaction definition. The decision to model all halos by one unique functional form was motivated by these guidelines.
2.4 Finding a collision
Interactions, by their nature, are a dynamical process. Any definition of interaction must therefore involve the comparison of two or more time-steps in the simulation. We hence identify and model halos in stored time-steps of the simulations, and compare the simulated halos in subsequent time-steps in order to define interactions.
Our procedure for finding a collision that occurred during an interval is as follows. We list all particles that are bound to the halo at . Particles are only listed under the highest level halo they are bound to – i.e., if under a subhalo, then not also its host halo. We identify these same particles at the later time step , if they are listed under any halo at this stage.
If any of the identified halos at contains particles from we fit an NFW profile based on these particles only. The fitting parameters are listed under the halo .
If at the end of this process a halo has more than one set of fit parameters from previous redshift halos, we check whether any pair of sets obey the “collision criterion” (see below). Note that halos that at contained more than twice the minimal number of particles, can merge with two separate halos at a later timestep , although this is unlikely to happen.
The collision criterion is consistently defined to match the halo-finder; if two density profiles, as calculated for two sets of particles, overlap in their scale radius , a collision has occurred. If each of the two modeled sets is gravitationally bound to the other modeled set then the collision is a merger. If this is not the case, the collision is an “unbound” collision. We use this term and the term “free-free collision” interchangeably. Since each fit contains an error in the derived value, the occurrence of a collision is up to the combined error in of the two fits. The binding relation is defined by comparing the relative center of mass velocity to the modeled NFW escape velocity of at the location of the center of mass of and vice versa.
3 Statistical view on substructure
Most galaxies in the local universe () are in groups according to various observational definitions of groups (e.g., Zabludoff & Mulchaey 1998 and references therein). If these definitions coincide with physically bound virialized systems, and if one identifies the simulated dark matter halos with galaxies (up to a certain mass) then we should find a similar fraction of subhalos in the simulations, provided the lower mass cutoff of the simulations accommodates the same galaxy mass range for which the group analyses have been carried out (see SKB+).
In our standard simulation we identify a total of halos at and at . Between % to % of all halos in the simulations we use are subhalos, almost independent of cosmological epoch and the mass resolution of the simulation. According to our classification, about % of all subhalos are subhalos of level and higher.
This leads to of so-called “galaxies” being group members (including the host if it is not too massive) which is less than the observed value for the simulation mass range. The mismatch between the identified fraction of grouped galaxies versus the same for grouped halos is resolved (SKB+) by allowing a halo tree buildup in which one uses three times the halos’ virial radius to identify subhalos, namely replace by in the definitions (i)-(iv) in §2.2. However in the current context where we are interested in real virialized systems, we use the notion of substructure defined in §2.2.
One of the important ingredients for the collision probability function is the number density of subhalos within a given halo. This number depends first and foremost on the mass of the host halo, but the cosmological epoch, the power spectrum, and the host halo shape may also affect it. At first we focus on the host mass. Figure 4 shows the multiplicity function for all host halos with at . We can identify three large clusters in the simulation ( at ) but we cannot detect whether the multiplicity function is continuous throughout the subhalo number range due to insufficient statistics. The multiplicity function is a function of the halo/subhalo mass resolution. Using the same simulation with times better halo mass resolution, ?) found to times more subhalos for the same host halos. Note that Colin et al. are defining halos differently and do not need to construct a density profile for the halos in order to identify collisions. When a mass cutoff similar to the one used here is applied to the higher mass resolution halo catalog, a very similar multiplicity function is obtained. For an effective mass cutoff ten times smaller than the 100% completeness value used here () the multiplicity function for hosts more massive than peaks at 4-5. As we shall shortly see, in all of the following comparisons with model predictions we shall use the actual halos we identify and hence we avoid the need to use only halos that have masses larger than our completeness limit. The completeness function for our halo finder is presented elsewhere (SKB+). We are complete for the smallest mass halo used in this analysis.
For all host halos in the current analysis, almost regardless of their mass, the multiplicity function peaks sharply at the first bin, namely at a situation of a binary system host and a single subhalo. For comparison in Fig. 4b we plot the same multiplicity function at where there are no prominent clusters present, and the multiplicity declines sharper than the function for . The multiplicity function does not seem to be a very strong function of the mass resolution of the simulation for high mass hosts. A somewhat more detailed view of the multiplicity-mass dependence is shown in Fig. 6 where a scatter plot reveals the general expected trend of high multiplicity for more massive halos. It is clearly seen though that on occasion even relatively low mass halos () exhibit high multiplicities. Figures 8a and 8b show the multiplicity function of somewhat less massive hosts at for the standard resolution and for eight times better mass resolution, respectively. We lowered the host mass threshold to at both resolutions in order to improve on the statistics. The limiting factor is the small number of massive halos in the small volume of the high resolution simulation rather than the mass resolution itself. This problem becomes more severe at higher redshifts.
Figure 10 shows the average number of subhalos as a function of redshift for 2 mass bins, less than or greater than . The dashed lines show the average number for all the halos, regardless of whether they contain subhalos or not, whereas the solid lines focus only on halos that contain at least one subhalo. Most halos in the larger mass bin contain subhalos. The average number of subhalos for host halos rises substantially from to between and and levels to a constant of subhalos per host for . In the small mass bins the common situation is one subhalo per host, i.e., a binary system.
4 Collision rate
Recall that halos that overlap in their NFW parameters, and that mergers are bound collisions (§2.4). In addition to determining the collision rate of all halos, in this paper we concentrate on the collision rate among subhalos, where the multiplicity function dictates much of the characteristic behavior. We may already guess from the lack of strong redshift evolution of the structure of this function (Fig. 4a in comparison to Fig. 4b and Fig. 10) that the subhalo collision rate does not decrease monotonically with time at late times, as expected for the collision rate among distinct halos in an expanding universe. Figure 12a shows the collision rate as a function of look-back time or equivalently the redshift. The overall number of collisions per Gyr per comoving volume is described by the solid line. The errors are derived from the errors in the modeled of the colliding halos through the definition of a collision as overlapping (cf. §2.4). Note that the collision and merger rates with finer time resolution were calculated, and in every case found to be consistent with the values that appear in Fig. 12 (and the following figures) within the quoted errors. In the overlapping redshift range of the standard and high resolution simulation, given the same mass cuts we find similar rates within the errors. That reduces the uncertainty with regard to the effect of the mass resolution on the calculated rate for a given mass range (see below for a discussion of other resolution effects). Only a fraction of these collisions occur among subhalos or between hosts and their subhalos. The shaded area on Fig. 12a depicts the collision rate only for collisions that involve at least one subhalo. A frequently quoted statistic is the merger rate (what we call the collision rate) in physical units as a function of redshift [Carlberg et al. (1990), Zepf & Koo (1989), Patton & et al. (2000), Le Fèvre et al. (2000)]. Figure 14 shows this representation of the collision rate where the increase at low redshift is prominent. Similar increases are reported by the abovementioned observational analyses in the range, although not by Carlberg et al. (2000) – suggesting that selection effects and the different observational tests for collisions used by different authors may be important.
In Fig. 16 we zoom-in onto the shaded region of Fig. 12a. Collisions that involve subhalos can further be divided into subclasses. The shaded region in Fig. 16 shows the merger (as opposed to all collisions) rate among subhalos, while the solid thick line describes the host – subhalo collision rate, namely a subhalo that got “absorbed” by its host or went through its center without keeping its identity. If the subhalo keeps its identity it is classified as a “cD” and therefore does not show up on the collision budget. A subhalo, however, can merge with a “cD” that resides at the center of a host.
As expected the overall collision rate rises steeply from to , reflecting the picture of bottom up hierarchical clustering and merger history. Below the rate starts to drop gently because in a low- CDM cosmology the accelerating expansion halts the collisions/mergers of isolated virialized halos. However in this redshift range the collisions among subhalos start to become a substantial fraction of all collisions. By that time galaxy groups and clusters start to form, and a significant increase in the number density of subhalos is obtained in these big host halos. The collision rate increases correspondingly. The increased velocity dispersion helps the process as well, though free-free collisions are still less probable than mergers. The fraction of unbound collisions out of all collisions among subhalos remains almost constant. Most of the erratic temporal features in the collision rate are due to unbound collisions between a subhalo and its host.
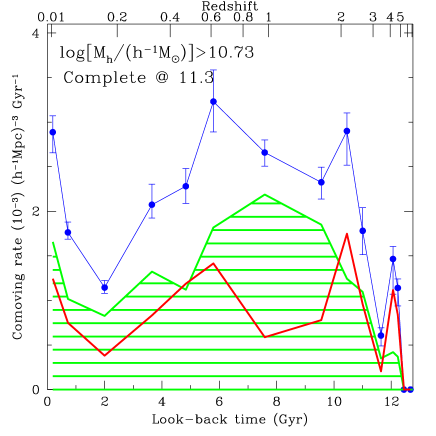
The collision rate is sensitive to the mass resolution of the simulation and its completeness limit. The higher mass resolution simulation not only shows a much higher collision rate (Fig. 12b) as a result of the mass function steepness, but it also shifts the peak of the collision rate to higher redshift where small halos are already virialized and participate in the collisions either as isolated halos or as subhalos of hosts. Figure 12b shows the overall collision rate and subhalos collision rate at a resolution eight times higher than the one in Fig. 12a only down to . At the overall collision rate with the high mass resolution is times higher and the rate among subhalos times higher. Recall that the product halo mass function reaches its completeness value only at particles, i.e., for the standard resolution. This problem is less severe than it could be because the slope of the low mass end of the subhalo mass function (SKB+) is only to . The mass spectrum of the progenitors in the two resolutions is of course very different. For any specific comparisons with observations (e.g., Kolatt et al. 1999) one has to first figure out the relevant mass range for progenitors.
4.1 Progenitor mass spectrum
Two important issues have to be examined with respect to the progenitor mass distribution. It is important to learn the mass range of progenitors in order to relate them eventually to physical entities. In particular, whether a collision is a “major” or “minor” one depends on whether the progenitor mass ratio is greater or less than some particular value, typically 0.3.
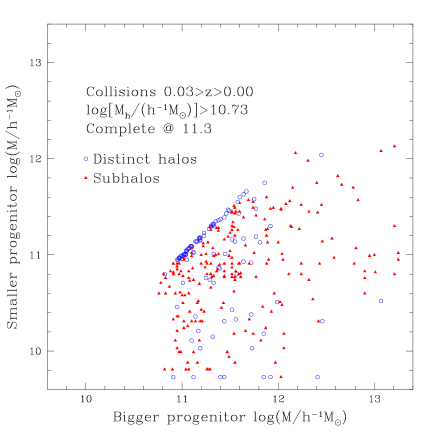
Figure 18 shows the distribution of masses for pairs of progenitors of collisions. The quoted masses of the progenitors are calculated directly from the number of particles that took part in the collision, which may be only fractions of the progenitor halo, as opposed to the modeled masses (of either the progenitor halos or the product halo). These masses can therefore be smaller than the mass resolution limit which refers to the minimal halo mass. In most cases these masses are a very good representation of the noisier modeled progenitor mass, especially for large mass progenitor halos.
As shown in Fig. 12a, the fraction of collisions among subhalos at low redshift is high. In Fig. 18 we show the mass spectrum for all the collisions between divided into collisions between distinct halos (circles) and among subhalos (triangles). At this low redshift almost all bigger progenitors have already exceeded . While most of the progenitors of collisions among distinct halos have mass ratios of , the collisions among subhalos involve a much broader spectrum of mass ratios. The complexity of the distribution clearly demonstrates why the numerical approach is essential. The mass function of subhalos cannot be derived by EPS (cf. SKB+), nor can the progenitor mass function. Most triangles at the right end of the figure are a subhalo – host collision. The pile-up of progenitors at the low mass end is a reflection of the steepness of the mass function (cf. Somerville & Kolatt 1999; SKB+).
Figure 20a is similar to Fig. 18 but at a higher redshift (). At this higher redshift the collisions among subhalos bear a much greater resemblance to the progenitor mass spectrum of the distinct halos. The higher resolution simulation (Fig. 20b) at similar redshifts shows the general trend of smaller mass progenitors which were not identified in the standard resolution simulation, and similar spectrum coverage for distinct halo collisions and collisions among subhalos. There is also a redshift evolution (SKB+) of the subhalo mass function that folds into the progenitor mass function at different redshift.
4.2 Major vs. minor mergers
The mass ratio between merger progenitors is assumed in semi-analytic models [Kauffmann et al. (1993), Cole et al. (1994), Somerville & Primack (1999), Somerville et al. (2000)] to determine the morphology of the central galaxy within the merger product. Based on hydrodynamic simulations [Barnes & Hernquist (1992)], it is assumed that the central galaxy resulting from a “major merger” (dark halo mass ratio greater than ) will have a dominant spheroidal stellar component, while the result of a “minor merger” of a small galaxy (mass ratio less than ) with a larger disk galaxy is again a disk galaxy. If indeed this identification is valid, we expect a higher fraction of “major mergers” in a high density environment, for consistency with the density-morphology relation [Dressler (1980)]. It is therefore interesting to see whether the mass ratio distribution alters when we turn to examine only collisions among subhalos.
Figure 22a shows the probability distribution of the progenitor mass ratio for mergers among subhalos, at different epochs. At high redshift (lower part) the distribution is almost uniform, and toward lower redshifts it tends to concentrate at low mass ratios, namely accretion of small progenitors onto bigger subhalos. The extended set of all collisions among subhalos shows a similar behavior. If mergers among distinct halos are also included (Fig. 22b) there appears at lower redshifts another probability peak for similar mass progenitors.
If we take mass ratios or greater as leading to major mergers, we find that of all mergers are major. Mergers among subhalos start with being major in of all cases at and only by . Similar results are obtained if unbound collisions are included.
5 Testing interaction rate approximations
In section 1 we have listed the various reasons for the inadequacy of the traditional analytic calculation for the collision rate as derived in statistical mechanics. In this section we shall attempt to compare results from the statistical mechanics approach and from two-halo interaction simulations with the full -body results obtained here.
5.1 Analytical calculations
In the kinetic theory, the average number of collisions a particle experiences per unit time is the collision rate, . For a system in equilibrium , with the number density of the particles, their collisional cross-section, and the average relative velocity between two particles in the ensemble. For a Maxwellian velocity distribution , where is the one-dimensional velocity dispersion. If the particles interact gravitationally, and are all identical in mass () and physical size (), the effective cross-section increases (gravitational focusing, e.g., Binney & Tremaine 1987) and the collision rate changes correspondingly by the addition of with . For a heterogeneous system with particles that retain their spherical symmetry, but exhibit various and values, we therefore define the average collision rate by
| (2) |
These rates are calculated for rigid bodies with radii , and yield a result for a collision rate as opposed to the merger rate.
Makino & Hut (1997, MH) derived an analytic approximation for the merger rate, based on their binary collision simulations. MH tested for mergers of equal-mass isolated halos of various initial density profiles. Instead of performing a big N-body simulation, they covered a large portion of phase space with their simulations and derived their expression from the results. As MH pointed out, there are numerous limitations with this approach. The merging criterion in MH is the requirement of negative energy value when the two systems are treated as a two body system. There is no simple way to determine particle affiliation with halos after the collision occurred (though the MH procedure seems very reasonable).
MH concluded that there is only a weak dependence on the initial halo profile and that a good approximation for the merger rate in a multi-halo system would be
| (3) |
This approximation should be relevant for a closed system (host halo) of radius which contains identical subhalos with half mass radius each. The one-dimensional velocity dispersion for the host and the subhalo are and , respectively. Note that MH neglected in this approximation the likelihood that the central object of their “cluster” may have a substantially larger cross section. Here we include it among the subhalo population of the host. Obviously the MH approximation is only applicable to our work if generalized to a system with appropriate progenitor mass spectrum and varying cross sections.
5.2 Comparison with simulations
When we calculate the various statistical predictions, using the data of the simulations and the formulae of the analytic or semi-analytic approximations, we are bound to introduce an error. While the approximations explicitly assume no evolution for the subhalo population and neglect the host potential, the number density and density profiles of the subhalos actually change from one time step to another, and the background potential of the host changes too. In comparison to realistic -body results a compromise should be taken. We would like the time lag between two compared timesteps to be as short as possible in order to validate the no-evolution assumption and the neglect of second order effects. On the other hand, we would like a long enough time-step to enable accumulation of proper statistics. The number density of subhalos is not constant because of the entry of new subhalos in between the analyzed time-steps, and subhalo destruction due to tidal stripping and galaxy harassment.
We here check how well these approximations compare with the results obtained from the simulations. Namely, we compare the modified kinetic theory approximation with our measured collision rate, and the MH approximation with the measured merger rate. At each time step we record for each host halo the number of subhalos it contains, and calculate the number density using the modeled virial volume of the host. For consistency with our collision definition (cf. §2.4), we take the cross section for each subhalo to be a function of its modeled . The instantaneous rate for this host halo is evaluated via
| (4) |
where the sum is over all subhalos. are the weights for the modeled ’s of the subhalo population ( for the simple estimate). The predicted number of collisions for this host during the proper time between subsequent registered redshifts is obtained by
| (5) |
with the number of subhalos of the host halo.
For statistical reasons it is more robust to compare the global rate rather than the rate for each individual host halo. Moreover, halos do not keep their identity from one time-step to another.
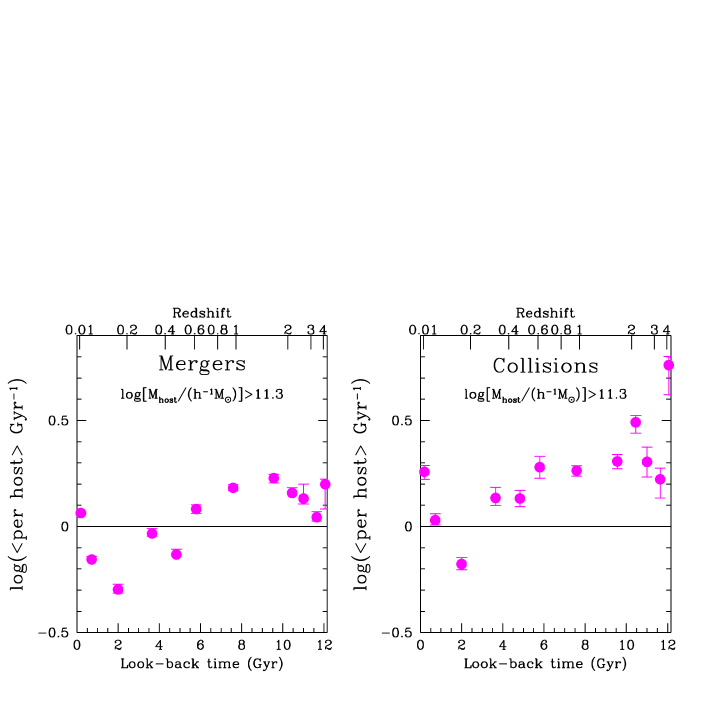
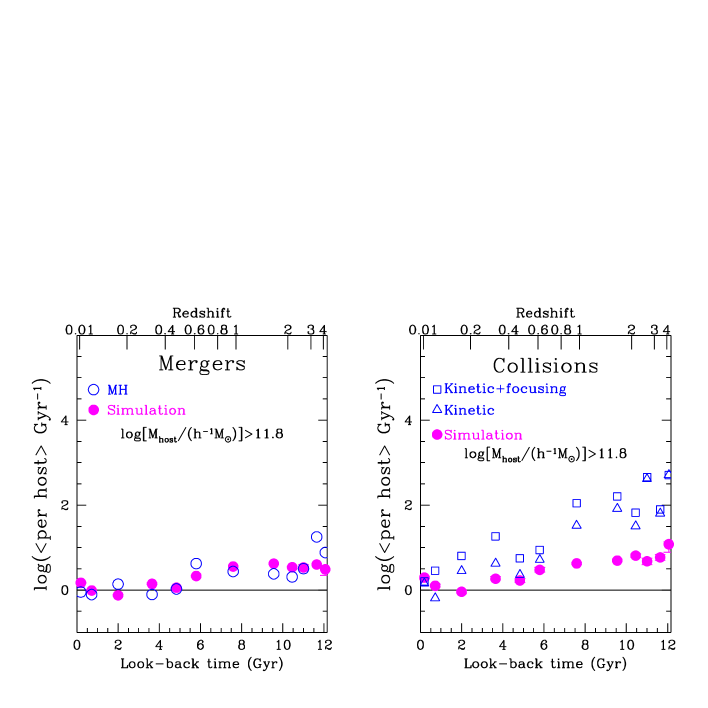
Figure 24 shows the average number of mergers and collisions per host halo per Gyr as a function of look-back time. The temporal evolution of the collision rate per host shows a similar behavior to that of the overall rate per comoving volume element (Fig. 16) with an increasing rate until ( for mergers) a decline until and another rise thereafter. Note that the comoving merger rate per host halo remains close to constant throughout the redshift evolution and only varies in the range Gyr-1. The same mild variation applies to the collision rate per host halo, which remains in the range Gyr-1.

Figure 26 shows the same data as appear in Fig. 24 in comparison to the approximation predictions. The empty symbols of Fig. 26 represent the approximations for the collision (merger) rate per host according to Eqs. 3-5. Note that the input data are taken from the true parameters of the simulation halos (Eq. 4).
Similarly, taking into account the fact that we are dealing with a realistic mass spectrum, and not equal-mass halos, and conforming to the half mass radius for the NFW modeled profiles, we use the same procedure (Eqs. 4, 5) to calculate the expected rate á la MH for each host halo in the sample. We summed all rates (multiplied by the number of subhalos for each host) and obtained the MH prediction for the merger rate per host halo.
It is evident from inspection of Fig. 26 that the theoretical approximations do not agree with the measured quantities at high redshift, and that the disagreement tends to decrease at lower redshifts. Part of the reason for the discrepancy can be read directly from Fig. 4 — even massive halos tend to have only a handful of subhalos sufficiently massive to survive our cuts, and do not reach the required large number density for statistical considerations. Other reasons for the discrepancy will be discussed shortly. Note that gravitational focusing only slightly changes (by ) the straightforward predictions of kinetic theory.
A way to cope with the limited number of subhalos per host is to divide the host population by the host mass or the number of subhalos they host. Although the approximations break down, they may still work for a subset of halos where the approximation assumptions are valid. In the next section we explore this possibility.
5.3 Interactions as a function of and host mass
We first test the conjecture that the governing factor for the mismatch between the predictions of the approximations is the small number of subhalos. At each given time-step the available multiplicity function does not allow, in general, a large enough number of host halos with high multiplicity. In order to check the conjecture, though, one needs proper statistics, i.e., many host halos of high multiplicity. A way around this difficulty is found by stacking redshift steps together according to the multiplicity of the host halo under consideration. That allows us to accumulate statistics from all time-steps and bin the data by of the halos instead of their collision redshift. The error we introduce by this statistics accumulation is mainly due to different conditional mass function of subhalos at different redshifts (SKB+).
Figure 28 shows the average number of mergers (collisions) per host halo per Gyr as a function of the number of their subhalos. We compare only host halos with since at high redshift both the host halo and the subhalo of lower masses have very low concentration (cf. Bullock et al. 2000), and thus may obey the “cD” case criterion and yield unphysically high rates. Evidently the rate is still overestimated with all three approximations by about one to two orders of magnitude. A fixed logarithmic shift of the kinetic theory model by for provides reasonably good agreement between the measured collision rate and the calculated one, for the high resolution simulation as well. We were able to identify the cause for the increasing discrepancy at the high multiplicity bin. It comes from low mass hosts with high multiplicity at (cf. Fig. 6) and some higher mass hosts with high multiplicity at . For the high mass hosts that show the most discrepant result (a small fraction), the multiplicity changes dramatically from one time-step to the next, generally toward lower multiplicity at the later time. The approximations (2) and (5) take , the number of subhalos, and , their number density, to be constant. But in these discrepant cases decreases due to tidal destruction, causing the subhalos to drop below our resolution limit, and thus decreases as well.
In conjunction with the additional increase in , the approximations show much higher interaction rates than are detected in the simulations. The breakdown of the approximation assumptions suggests that there might yet be a different factor which governs the collision rate more strongly and causes the deviation from the predictions.
The other governing parameter for the approximation success may be the host mass. Massive host halos on average have higher multiplicity and thus better fulfill the statistical assumptions. In addition to that, massive hosts are more stable and their gravitational potential prevent subhalos from escaping the virial radius. The competing effect is the stronger tidal force they exhibit; however, this is somewhat relaxed due to their typical lower concentration parameter (cf. BKS+) and hence moderate density gradients. We use the same stacking approach by which we examined the approximation dependence on the multiplicity to circumvent the difficulty of not having enough statistics at each time step. Here we consider mass bins, accumulating all similar host masses from all time steps. Since the halos were chosen under the proviso they had already virialized, similar host masses correspond to similar velocity dispersion within them, with no regard to the cosmological epoch, although this is not strictly valid with respect to the number of subhalos at different epochs and their scale radii (BKS+).
Figure 30 shows the merger rate as a function of the host mass. The simulation statistics only allow significant mass bins. Clearly for the high mass bin the MH approximation works well, while it overestimates the rate by a factor for the low mass bin, for reasons discussed in the previous subsection. The collision rate prediction from the kinetic theory works well for the large mass bin as well and exhibits a discrepancy of about an order of magnitude for the low mass bin. These results explain the large deviation from the models seen, e.g., in Fig. 26. The mass function is always dominated by the low mass end of the hosts. Naturally, this end tends to consist of less massive hosts at higher redshift. Most hosts therefore do not fall in the regime where good agreement with the models is obtained, and the average rate per host is dictated by these. The conclusion is that the difference between the kinetic theory predictions with or without taking gravitational focusing into account is not big, and they both fit the results from the simulations rather well for masses larger than . In the high resolution simulation a similar trend is detected and successful prediction of all three models can be extended due to better statistics to .
In an attempt to bin the mass more finely a useful approximation for all masses of host halos is found to be
| (6) |
with . The approximation (6) works fine for both mass resolutions when applied to the kinetic theory (, with or without gravitational focusing). There is no similar correction formula for the MH predictions.
In spite of the poorer statistics, we now go back to the evolution of the collision rate in time (Fig. 26) and apply the same calculation under the constraint of . This allows statistically significant results at almost all redshifts. Figure 32 shows the results. A very nice agreement is obtained for all redshift bins between the MH approximation and the simulation. The kinetic theory still overestimates the collision rate by about an order of magnitude beyond redshift , but gets closer to the simulation results at lower redshifts if gravitational focusing is ignored.
The MH prediction is expected to give somewhat higher results than the simulation since MH calculations consider the half mass radius while in the simulation the requirement is of a cross section in conjunction with a final bound state. Figs. 30a and 32a show that on average for large host halos the two merger definitions are similar, but in details and for small halos they differ. It is encouraging to verify that the merger definition is quite robust and the outcome rate does not depend on its fine details. The kinetic theory predictions tend to overestimate the rate since they neglect stripping (and thus shrinking cross section) and harassment to the degree of disappearance of halos.
6 Dynamical friction
The breakdown of the kinetic theory statistics in the limit of a few-body system, and in particular for low masses as seen in the simulations, leads us to seek an alternative assessment for the collision rate in these systems. Fig. 34 shows the distance of the identified collision, from the host center, for all collisions that involve at least one subhalo. Note that beyond the first radial bin, the rise in the number of collisions as a function of the radius in which they occur is slower than expected for a homogeneous distribution throughout the host’s virial volume, as assumed in the kinetic theory approximations (Eq. 3, 2). Instead, the distribution follows more closely a mass profile of . In the limit of a binary system, every collision is by definition a host – subhalo collision. These are the host – subhalo collisions that contribute to the big spike in Fig. 34 near .
Two competing processes are responsible for this type of collisions: a radial orbit may lead the subhalo directly to the host’s center [Moore et al. (1998)], while a more tangential orbit may end up spiraling into the center of the host due to dynamical friction. The characteristic time for spiraling in, as estimated by dynamical-friction theory, is clearly relevant for the latter but it may or may not be a useful approximation for the former. We therefore set to test the applicability of the dynamical-friction time scale in the realistic systems of our simulation.
Traditionally the rate of collisions is estimated using a simplified form of dynamical friction [Kauffmann et al. (1993), Somerville & Primack (1999)] which utilizes a very simple approach. The halo is assumed to be an isothermal sphere, and the subhalo is assumed to be a point mass on circular orbits, ignoring mass-loss as it spirals in. The more elaborate approximations by ?) and by Klypin et al. (1999) allow a more realistic density profile for the halos but they still assume circular orbits for subhalos.

We here focus on collisions between subhalos and their hosts. The progenitor subhalo of these collisions is identified in the regime between and of the host (apart from the “cD” case). We first check how well the traditional dynamical friction timescale predicts the behavior in the simulation. The expression for the dynamical friction time in the framework of NFW density profile for the host halo is given by [Binney & Tremaine (1987)]
| (7) |
where [Klypin et al. (1999)]
| (8) |
and is the one-dimension velocity dispersion at radius r,
| (9) |
The halo profile, and therefore the circular velocity , are assumed to remain constant between subsequent time-steps. The radii and are the initial and final radii to consider, respectively. The initial separation is identified at the earlier redshift as the offset between the center of mass of the host and that of the subhalo. The final radius is the sum of the values for the host and the subhalo, to maintain consistency with the collision definition. For the “cD” case is taken to be zero. The choice for the subhalo mass is somewhat ambiguous: the scheme we use modeles the subhalo mass according to its NFW density profile. An alternative is to consider only the mass within (c.f. §2.1). We tried both possibilities and found only negligible differences between the two results. Note, however, that the subhalo mass does change in between the two time-steps and thus deviations from the no-mass-loss approximation (Eq. 7) are expected. Interestingly, since the subhalo mass usually decreases, the approximation should underestimate the dynamical friction time. We shall soon see that the opposite happens, in many cases, indicating that the simplified model may be crude for other reasons too.
An alternative approach would be to calculate in a similar way it is done in certain semi-analytic models (e.g., Somerville & Primack 1999). The host halos are assumed to follow a singular isothermal sphere (SIS) profile whose constant circular velocity is given by the virial mass ad radius: . The dynamical friction time scale is then simplified to [Binney & Tremaine (1987)]
| (10) |
where the Coulomb logarithm is approximated by .
Among all collisions that have taken place between and we select only collisions of the type subhalo – host, namely systems that at already belonged to the same virialized system where approximations for dynamical friction time are applicable. We identify the progenitor that at used to be the subhalo and calculate its expected according to Eqs. (7) and (10). We do not take its actual orbital parameters into account, because we are interested in finding out whether is a good approximation when applied to a statistical sample of collisions as in the semi-analytic models. We then compare the expected dynamical friction time of this individual collision with the elapsed time between and in the simulation. The time resolution of the analyzed simulation output times does not allow a detailed comparison of the calculated dynamical friction time and the collisions as they happened in the simulations. The proper time gap between successive stored times serves instead as an upper limit for the real time.
If the dynamical friction time is a reliable estimate, all the individual values should be smaller than , because we selected for all collisions that have actually happened on a time shorter than or equal to . The choice of going “backwards” in time, namely from identified collisions to their progenitors, is made because some of the subhalos at the higher redshift got disrupted by the time of the lower redshift and can no longer serve as dynamical friction probes.
Figure 36 shows the distribution of dynamical friction time in units of , for all progenitor subhalos in the simulation at a given redshift, and for 9 timestep pairs. For the SIS calculation the dynamical friction time gradually becomes more of an overestimate as the simulation progresses in time. At high redshift , more than of all subhalos spiral into their hosts in a time comparable to or longer than their calculated SIS dynamical friction time. At low redshifts, the SIS dynamical friction is typically an overestimate, sometimes by more than two orders of magnitude. The use of the best-fit NFW profile brings about a somewhat worse agreement at high redshift. This is due to the lower halo concentration at high redshift that causes subhalos to be classified as “cD”, residing within the of their hosts. The definition of in such cases is more ambiguous and may not reflect the exact collision radius. Moreover, at high redshift a “cD” case may occur for progenitors of rather similar masses where the dynamical friction approximation breaks down anyway. In the SIS calculation for the “cD” cases, the steeper density profile near the center () tends to shorten the dynamical friction time estimate and partly compensates for the method inaccuracies. However at low redshift, where such degeneracies are rare, the NFW estimate does better than the SIS estimate and by it overestimates the time for only of all cases, in comparison to the in the SIS case.
This spread of should partly be attributed to the fit errors, as at high redshift the halos tend to be less concentrated (BKS+) and the calculated dynamical friction time is affected at large radii by the modeled . The bigger errors for at high redshift propagate thus to an error in the dynamical friction time estimate.
Semi-analytic models that use dynamical time estimates to predict mergers must take the errors in these estimates into account or else they underestimate the merger and collision rate both in absolute terms and more severely at low redshift relative to high redshift.
Figure 38 summarizes Fig. 36 and depicts the fraction of mergers between subhalos and hosts that occurred faster than the dynamical friction time prediction as a function of redshift. ?) have analyzed the dynamical friction time-scale for clusters in these simulations using a different methodology, and found that at high redshift the dynamical friction time-scale truly represents the cluster evolution whereas at lower redshift for a substantial fraction of the subhalos the dynamical friction timescale is longer than the actual merging timescale.

Some of the mismatch between the and may arise due to the invalidity of the circular orbit assumption. If most collision progenitors had initially radial orbits then the collision time should be smaller. The redshift dependence of the discrepancy can then be explained in terms of bigger infall velocities at lower redshift and domination of radial orbits near big groups and clusters.
Figure 40 (top) shows the radial velocity of the subhalo progenitor normalized to the modeled circular SIS velocity (or equivalently of NFW) at the lower redshift. The radial velocity should correlate with deviations from the dynamical friction time predictions, especially the negative radial velocities. Indeed, about of the mergers for which the dynamical friction estimate failed to yield the right time scale, show radial velocities , whereas this fraction is only for mergers of correct time scale prediction. Interestingly, there is a marginal indication that even positive radial velocities correlate with the breakup of the approximation. This may be interpreted as orbit eccentricity being an important reason for the deviation. At higher redshift (Fig. 40, bottom) progenitors have more circular orbits (only and of for correct and deviating mergers respectively) and therefore the deviation decreases. The difference between the time estimates by the SIS and NFW models is gradually amplified at low redshifts due to the larger concentration there (BKS+); the deviation of the simplified SIS profile from the realistic NFW profile grows with , which makes the SIS a weak approximation for high- halos.
Figure 42 indicates that the deviations from the dynamical friction time estimate are correlated with the location of the progenitor subhalo (as identified in the output time just preceding the merger). Subhalos from the outskirts of the host tend to merge on a timescale much shorter than the dynamical friction time estimate. The discrepancies stem from such progenitors because they either spend longer radial oscillation time there, or because they have just entered the host halo and are not yet virialized. A counter effect comes from deflections by other subhalos in the same host halo, which tend to make the dynamical friction timescale an underestimate of the true spiraling-in time [Merritt (1983)]. Apparently this effect is overruled by the effects working in the opposite direction.

Another possible cause for the mismatch between estimated and observed may be the breakdown of the assumption used in the derivation of . We checked for a correlation between the deviation from dynamical friction time estimate and the subhalo – host mass ratio. For the SIS estimate there does not seem to be any correlation between these two quantities. However all the deviating systems host – subhalo at high redshift are systems for which (the opposite is not true). Again, at high redshift when the concentration is low, and the subhalo mass is distributed over large radius, the assumption about a point-like subhalo with a fixed mass that does not affect the background potential breaks down, and hence the dynamical friction formula ceases to be valid especially for similar masses of host halos and the spiraling subhalo. This effect is somewhat stronger when the actual density profile (i.e., NFW) is taken into account. Despite the fact that in the dynamical friction framework these effects tend to weaken the dynamical friction and thus make the dynamical friction time estimate longer, other processes, e.g., two body relaxation are more common for “puffed” halos and may work to shorten the spiraling-in time scale. Note that by moving from the modeled to , becomes longer () and thus the choice of using cannot be the reason for the deviation.
7 Summary
We investigated the interaction rate of subhalos, which should be an important ingredient in the process of galaxy formation. This study is needed because virialized systems of objects evolve differently than unvirialized systems in which the objects are only weakly correlated. Also, the observed large fraction of galaxies in groups suggests that virialized systems of two galaxies or more are very common, and such high-density environments tend to be preferentially selected for observation. We thus computed the collision and merger rates within virialized systems in N-body simulations, and used the results to evaluate useful semi-analytic approximations. The large sample of halos of a range of masses and multiplicities enabled a comprehensive statistical analysis, and the especially designed halo finder and collision identifier allowed a proper quantitative study of substructure evolution. Given the resolution limits of our simulations and halo finder, we could account for only the two most massive members of a group like the Local Group, but since these two members commonly dominate the group dynamics, the mass resolution is adequate for our purpose.
We found that the comoving collision rate of subhalos is a substantial fraction to the total collision rate of halos in the CDM simulation. At the fraction of collisions that involve substructure is , and this fraction grows to at low redshifts (Fig. 12 (top)). In physical coordinates, this corresponds to a collision rate (Fig. 14). The evolution of the subhalo collision rate follows that of the total collision rate, namely a sharp rise between and 2, followed by a decline between and 0.4. (Fig. 16). Even though the exact evolution is affected by the specific cosmology simulated and the results are valid for a specific mass range limited by the resolution of the simulation, the general behavior of a rise followed by a decline should be robust. We find that the collision rate of subhalos lags behind the total rate by about Gyr. It also exhibits a different behavior at low redshift, when many large virialized systems exist and contribute a significant fraction of the collision rate and a rise in the merger rate.
The mass function of progenitors that participate in subhalo mergers is somewhat different from that of distinct halo collisions (Fig. 22), amplifying small differences in the tails of the mass functions for subhalos and distinct halos. The fraction of “major” interactions among those which involve at least one subhalo is only , unlike the fraction of major interactions among distinct halos. The moral is that accurate theoretical predictions of interaction rates should not be solely based on the halo mass function as derived from approximations such as Press-Schechter or Extended-PS, which ignore substructure.
We found that the Makino-Hut formula can serve as a reasonably good approximation for subhalo merger rates, as long as host halos more massive than are considered. At lower masses, the MH formula overestimates the merger rate by an order of magnitude. At high redshift, where less massive halos are abundant, the MH formula ceases to be a good description for the merger rate of the subhalo population.
Predictions of the subhalo collision rate from kinetic theory are found to recover the actual rate for host halos more massive than , but fail to do so, by one or two orders of magnitude, for less massive host halos, depending on their multiplicity. We presented a correction formula to match kinetic theory predictions with the simulated halos, using either the mass of the host, or the number of subhalos it contains.
For interactions between subhalos and their hosts, we examined the accuracy of the dynamical friction timescale as estimated for circular orbits. In general, the estimate based on the NFW density profile is acceptable for about half the cases. It significantly overestimates the collision time in about of the cases, and by more than an order of magnitude in of the cases. One reason for this failure is that, at least at early times, the halos tend to be of low concentration and the high-mass host halos are of low abundance, making the assumption of invalid in many cases. The deviation from circular orbits is clearly another reason for the failure of the dynamical-friction approximation, as demonstrated at the most recent output time of the simulation. We find that, by some coincidence, the estimate based on the approximation of halos as isothermal spheres is acceptable at high redshift. This is good news for semi-analytic models that commonly use this approximation. At low redshifts, on the other hand, the concentration tends to be high, and the SIS predictions become poor. The moral is that, in order to mimic substructure dynamics in a cosmological context, one needs to appeal to accurate simulations, or use approximations that were derived from such simulations. We have reasons to assume that these approximations, once expressed properly in terms of the host-halo mass, can be robust and not too sensitive to the particular cosmology. Proper collision rates can then be incorporated into galaxy formation scenarios and connect them to the evolution of large-scale structure.
Acknowledgments
The simulations were performed at NRL and NCSA. This work was supported by grants from NASA and NSF at UCSC and NMSU, and by Israel Science Foundation and US-Israel Binational Science Foundation grants. JRP gratefully acknowledges a Forchheimer Visiting Professorship at The Hebrew University.
References
- Abraham et al. (1997) Abraham R., Ellis R. S., Glazebrook K., 1997, in IAU 186: Galaxy Interactions at Low and High Redshift, p. 183
- Augilar & White (1985) Augilar L., White S., 1985, ApJ, 295, 374
- Barnes & Efstathiou (1987) Barnes J., Efstathiou G., 1987, ApJ, 319, 575
- Barnes & Hernquist (1992) Barnes J. E., Hernquist L., 1992, ARA&A, 30, 705
- Benson et al. (2000) Benson A., Cole S., Frenk C., Baugh C., Lacey C., 2000, MNRAS, 316, 107
- Binney & Tremaine (1987) Binney J., Tremaine S., 1987, Galactic Dynamics. Princeton Univ. Press, Princeton, NJ
- Bryan & Norman (1998) Bryan G., Norman M., 1998, ApJ, 495, 80
- Bullock (1999) Bullock J., 1999, Ph.D. thesis, University of California, Santa Cruz
- Bullock et al. (2000) Bullock J., Kolatt T., Sigad Y., Primack J., Dekel A., Kravtsov A., Klypin A., 2000, MNRAS, in press (BKS+)
- Carlberg et al. (2000) Carlberg R. G. et al., 2000, ApJ, 532, L1
- Carlberg et al. (1990) Carlberg R. G., Couchman H. M. P., Thomas P. A., 1990, ApJ, 352, L29
- Cole et al. (1994) Cole S., Aragón-Salamanca A., Frenk C., Navarro J., Zepf S., 1994, MNRAS, 271, 781
- Colin et al. (1999) Colin P., Klypin A., Kravtsov A., Khokhlov A., 1999, ApJ, 523, 32
- Conselice & Gallagher (1999) Conselice C., Gallagher I. J., 1999, AJ, 117, 75
- Conselice et al. (2000) Conselice C. J., Bershady M. A., Jangren A., 2000, ApJ, 529, 886
- Davis et al. (1997) Davis D., Keel W., Mulchaey J., Henning P., 1997, AJ, 114, 613
- de Mello et al. (1997) de Mello D., Infante L., Menaneteau F., Vieira G., 1997, ApJS, 110, 227
- Dekel et al. (1980) Dekel A., Lecar M., Shaham J., 1980, ApJ, 241, 946
- Dressler (1980) Dressler A., 1980, ApJ, 236, 351
- Dubinski et al. (1999) Dubinski J., Mihos J. C., Hernquist L., 1999, ApJ, 526, 607
- Ghigna et al. (1998) Ghigna S., Moore B., Governato F., Lake G., Quinn T., Joachim S., 1998, MNRAS, 300, 146
- Gross et al. (1998) Gross M. A. K., Somerville R. S., Primack J. R., Holtzman J., Klypin A. A., 1998, MNRAS, 301, 81
- Kauffmann et al. (1993) Kauffmann G., White S., Guiderdoni B., 1993, MNRAS, 264, 201
- Klypin et al. (1999) Klypin A., Gottlöber S., Kravtsov A., Khokhlov A., 1999, ApJ, 516, 530
- Kolatt et al. (2000) Kolatt T., Bullock J., Sigad Y., Primack J., Dekel A., Kravtsov A., Klypin A., 2000, submitted
- Kolatt et al. (1999) Kolatt T. et al., 1999, ApJ, 523, L109
- Kravtsov & Klypin (1999) Kravtsov A., Klypin A. A., 1999, ApJ, 520, 437
- Kravtsov et al. (1997) Kravtsov A. V., Klypin A. A., Khokhlov A. M., 1997, ApJS, 111, 73
- Lacey & Cole (1993) Lacey C., Cole S., 1993, MNRAS, 262, 627
- Lacey & Cole (1994) Lacey C., Cole S., 1994, MNRAS, 271, 676
- Larson & Tinsley (1978) Larson R. B., Tinsley B. M., 1978, ApJ, 219, 46
- Le Fèvre et al. (2000) Le Fèvre O. et al., 2000, MNRAS, 311, 565
- Makino & Hut (1997) Makino J., Hut P., 1997, ApJ, 481, 83 (MH)
- Merritt (1983) Merritt D., 1983, ApJ, 264, 24
- Mihos & Hernquist (1994a) Mihos J., Hernquist L., 1994a, ApJ, 425, L13
- Mihos & Hernquist (1994b) Mihos J., Hernquist L., 1994b, ApJ, 431, L9
- Moore et al. (1999) Moore B., Ghigna S., Governato F., Lake G., Quinn T., Stadel J., Tozzi P., 1999, ApJ, 524, L19
- Moore et al. (1996) Moore B., Katz N., Lake G., Dressler A., Oemler A., 1996, Nat, 379
- Moore et al. (1998) Moore B., Lake G., Katz N., 1998, ApJ, 495, 152
- Navarro et al. (1995) Navarro J., Frenk C., White S., 1995, MNRAS, 275, 56
- Neuschaefer et al. (1997) Neuschaefer L., Im M., Ratnatunga K., Griffiths R., Casertano S., 1997, ApJ, 480, 59
- Oemler (1992) Oemler J., A., 1992, in Fabian A., ed, Clusters and Superclusters of Galaxies. Dordrecht: Kluwer, p. 29
- Okamoto & Habe (1999) Okamoto T., Habe A., 1999, ApJ, 516, 591
- Patton (1998) Patton D., 1998, in Galaxy Dynamics, proceedings of a conference held at Rutgers University, 8-12 Aug 1998. To appear in ASP Conference Series, edited by D. R. Merritt, M. Valluri, and J. A. Sellwood, p. E171
- Patton & et al. (2000) Patton D., et al. , 2000, ApJ, 516, 153
- Press & Schechter (1974) Press W., Schechter P., 1974, ApJ, 187, 425
- Richstone (1975) Richstone D., 1975, ApJ, 200, 535
- Sensui et al. (1999) Sensui T., Funato Y., Makino J., 1999, PASJ, 51, 943
- Sigad et al. (2000) Sigad Y., Kolatt T., Bullock J., Dekel A., Primack J., Kravtsov A., Klypin A., 2000, MNRAS, submitted
- Somerville & Kolatt (1999) Somerville R., Kolatt T., 1999, MNRAS, 305, 1
- Somerville et al. (2000) Somerville R., Lemson G., Kolatt T., Dekel A., 2000, MNRAS, 316, 479
- Somerville & Primack (1999) Somerville R., Primack J., 1999, MNRAS, 310, 108
- Somerville et al. (2000) Somerville R., Primack J., Faber S., 2000, MNRAS, in press, astro-ph/0006364
- Spitzer (1958) Spitzer L. J., 1958, ApJ, 127, 17
- Springel & White (1999) Springel V., White S. D. M., 1999, MNRAS, 307, 162
- Toomre & Toomre (1972) Toomre A., Toomre J., 1972, ApJ, 178, 623
- Tormen (1997) Tormen G., 1997, MNRAS, 290, 411
- Tormen (1998) Tormen G., 1998, MNRAS, 297, 648
- Tormen et al. (1997) Tormen G., Bouchet F., White S., 1997, MNRAS, 286, 865
- van den Bosch et al. (1999) van den Bosch F. C., Lewis G. F., Lake G., Stadel J., 1999, ApJ, 515, 50
- Wu (1999) Wu K., 1999, Ph.D. thesis, University of California, Santa Cruz
- Zepf & Koo (1989) Zepf S., Koo D., 1989, ApJ, 337, 34