BeppoSAX observations of three distant, highly luminous clusters of galaxies: RXJ1347-1145, Z3146 and A2390
Abstract
We present an analysis of BeppoSAX observations of three clusters of galaxies which are amongst the most luminous in the Universe: RXJ1347-1145, Zwicky 3146 and Abell 2390. Using data from both the Low Energy (LECS) and Medium Energy (MECS) Concentrator Spectrometers, and a joint analysis with the Phoswich Detection System (PDS) data above 10 keV, we constrain, with a relative uncertainty of between 7 and 42 per cent (90 per cent confidence level), the mean gas temperature in the three clusters. These measurements are checked against any possible non-thermal contribution to the plasma emission and are shown to be robust.
We confirm that RXJ1347-1145 has a gas temperature that lies in the range between 13.2 and 22.3 keV at the 90 per cent confidence level, and is larger than 12.1 keV at level. The existence of such a hot galaxy cluster at redshift of about 0.45 implies an upper limit on the mean mass density in the Universe, , of 0.5.
Combining the BeppoSAX estimates for gas temperature and luminosity of the three clusters presented in this work with ASCA measurements available in the literature, we obtain a slope of 2.7 in the relation once the physical properties are corrected from the contamination from the central cooling flows.
keywords:
galaxies: clustering – X-ray: galaxies.1 INTRODUCTION
The X-ray emitting gas in clusters of galaxies cools by the emission of energy on a time scale which depends on the temperature and density of the intracluster medium (ICM). Where the density is higher, in the cores of the clusters, the cooling is more efficient and the temperature falls. To support the outer layers of gas, a subsonic flow of gas occurs towards the central region, producing a cooling flow that appears in X-rays as an enhancement of the central peak in the surface brightness profile and with a spectrum that presents multiple temperature components.
The stronger the cooling flow, the higher the X-ray luminosity which arises from both the thermal energy lost by the cooling gas and the gravitational work done to maintain the gas at constant pressure. Therefore, to compare global cluster gas properties with theoretical and numerical predictions, that, at present, cannot model the radiative cooling in detail, we need to account fully for the effects of cooling flows on the temperature and luminosity measurements (Fabian et al. 1994, Allen & Fabian 1998, Markevitch 1998).
In this paper, we present data collected with the instruments onboard of the Italian-Dutch satellite BeppoSAX for three highly luminous ( erg s-1), hot ( keV), distant () clusters of galaxies with large ( yr-1) mass deposition rates in their cores (Allen 2000): RXJ1347-1145, Zwicky 3146 (Z3146) and Abell 2390 (A2390). Using data from both the Low Energy (LECS) and Medium Energy (MECS) Concetrator Spectrometer and a joint analysis with the Phoswich Detection System (PDS) data above 10 keV, we show that it is possible to constrain at a high level of significance the hard tail of the bremsstrahlung emission.
All quantities quoted in this paper refer to the following cosmological parameters: km s-1 Mpc-1, , .
2 THE SAMPLE
We describe here the characteristics of the three galaxy clusters analyzed in the present study.
RXJ1347-1145 is a lensing cluster found in the ROSAT All Sky Survey (Schindler et al. 1995, 1997), with a slightly elongated X-ray structure around a very peaked central emission as it appears in the ROSAT HRI image. Analyses of the ASCA dataset provide temperature estimates ranging from keV (Schindler et al. 1997), when a single temperature model is adopted, to keV (Allen 2000), when a multi-phase gas is considered.
Z3146 is the fourth ranked luminous cluster in the ROSAT band as reported in the Brightest Cluster Sample (BCS, Ebeling et al. 1998). Its massive cooling flow has been inferred from the strong optical lines and blue continuum exhibited by its central galaxy and has been studied with ROSAT HRI (Edge et al. 1994). Allen (2000) quotes an ASCA estimate of the gas temperature corrected from the cooling flow of keV.
A2390 is the sixth ranked luminous cluster in the ROSAT band in the northern sky (BCS, Ebeling et al. 1998), has been widely studied in the X-ray waveband (Ulmer et al. 1986, Böhringer et al. 1999) and is optically rich (Abell, Corwin & Olowin 1989, Yee et al. 1996). It presents evidence of strong and weak lensing (Pello et al. 1991, Pierre et al. 1996, Squires et al. 1996). For A2390, Böhringer et al. (1999) measure keV when an isothermal model is used to fit the ASCA data. Once they add a cooling flow component and consider a ROSAT PSPC–ASCA joint fit, the temperature rises to keV. Using the ASCA dataset only, Allen (2000) measures keV with a single isothermal model, that rises to keV with a cooling flow component included in the spectral fit.
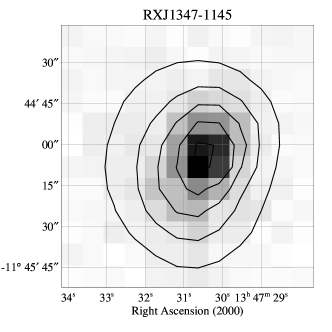
In Table 1, we quote for these three clusters the exposure and net count rates measured in each instrument on board BeppoSAX , the Galactic absorption estimated in direction of the X-ray centroid determined from the respective ROSAT HRI image (see Fig. 1) and their redshift from literature. Given the assumed cosmology, one arcmin corresponds to 0.408, 0.324, 0.277 Mpc, at the redshift of RXJ1347-1145, Z3146, A2390, respectively.


| Cluster | RA, Dec (2000) | date | LECS (0.1–4 keV) | MECS (2–10.3 keV) | PDS (13–60 keV) | |||||
|---|---|---|---|---|---|---|---|---|---|---|
| hms, deg | Exp. (ksec) | cts s-1 | Exp. (ksec) | cts s-1 | Exp. (ksec) | cts s-1 | ||||
| RXJ1347-1145 | 13 47 31.0, –11 45 11 | 0.4510 [1] | 4.8 | 2000 Jan 25 | 28.6 | 5.30.1 | 73.2 | 9.90.1 | 36.5 | 4.02.6 |
| Z3146 | 10 23 40.0, +04 11 11 | 0.2906 [2] | 3.0 | 1999 Dec 07 | 13.1 | 6.20.2 | 38.4 | 9.30.2 | 17.9 | 8.23.6 |
| A2390 | 21 53 36.8, +17 41 44 | 0.2279 [3] | 6.8 | 1999 May 28 | 33.0 | 9.00.2 | 76.1 | 16.50.2 | 35.4 | 2.12.4 |
3 SPECTRAL ANALYSIS
We present the data from the three instruments onboard the Italian-Dutch satellite BeppoSAX (Boella et al. 1997): LECS (0.1–4 keV), MECS (1.8–10.5 keV) and PDS (15–200 keV). In Table 1, we present the details of the observations.
Using Xselect v2.0, we extract the spectra after screening for events without an attitude solution (generally 1 count for every 1,000 good events) from the standard cleaned and linearized event file of LECS and the merged event file collected from units 2 and 3 of the MECS.
For all three clusters, we have selected circular regions with radii of 8 arcmin around the source in the LECS image and 6 arcmin in the MECS image. These regions should contain more than 95 per cent of the flux observed in the MECS and about 90 per cent of that collected from the LECS, given the standard calibration files for point sources (see below for the calibration files adopted in the present analysis).
Using similar regions in detector coordinates, background spectra were extracted from the MECS23_bkg.evt file, a 475 ksec exposure of blank fields at high Galactic latitude. Following the procedure described in Fiore, Guainazzi & Grandi (1999), we have checked that the count rates in regions of the source field far away from the two calibration sources, the MECS strongback and any evident serendipitous source are consistent with the count rates measured in the same regions (in detector coordinates, DETX and DETY) in the blank-field.
For the spectral analysis, we have made use of the calibration files released on September 1997 from the SAX-SDC, specifically the redistribution matrix file lecs_sep97.rmf and mecs1_sep97.rmf, and the ancillary response file lecs_130_124_8_sep97.arf and mecs23_6_sep97.arf, for the LECS and MECS, respectively. Moreover, we have used the SAXDAS routine lemat to obtain both the RMF and ARF files for the three datasets simulating the extend emission of the cluster with point sources each with an estimated contribution to the X-ray flux determined by the opportunely rebinned image in RAW coordinates.
The counts were grouped to a minimum of 25 per bin in order that the statistic could be applied in the fitting analysis.
In the process of fitting the spectra simultaneously, we have left free the intercalibration constant of the spectral normalization in the LECS with respect to that in the MECS, used as reference. This value varies between 0.71 and 0.73 when an effective area appropriate for a point-source is used in fitting the LECS data. This is in agreement with the present absolute calibration of the two instruments. When the more appropriate ARF file created with lemat is used, the intercalibration constant is about 1 for all the best-fit results.
The PDS background-corrected spectra were retrieved from the on-line SDC archive and analyzed using the redistribution matrix file pds_256_aug97_fixjan98.rmf. We group the PDS counts according to the grouping file provided by SDC. The PDS vs. MECS normalization factor was fixed to 0.86. No differences are observed between PDS spectra that do or do not include corrections due to applying a crystal-temperature-dependent Rise-Time threshold.
We fit the spectra using the photoelectric absorption model that adopts the cross-sections calculated by Balucinska-Church and McCammon (1992), in front of a Mekal emission model (Kaastra 1992, Liedhal et al. 1995) in Xspec (version 11.0.1, Arnaud 1996). The absorption is fixed to the Galactic value quoted in Table 1 obtained from the 0.675 0.675∘ pixel HI map of Dickey & Lockman (1990). The results of the fitting analysis are presented in Table 2 and shown in Figure 2. As comparison, we quote in Table 2 the results for a thermal fit to the MECS data only.
In the same Table, we also present the results obtained from fitting two further models that include an additional contribution to the single-phase plasma: (i) a power-law that can take into account any non-thermal contamination from an unresolved active galaxy; (ii) an intrinsically absorbed cooling flow component which can model the emission from the central multi-phase gas (see also discussion for the ASCA data in Allen & Fabian 1998). The aim in fitting these models is to check the robustness of the gas temperature estimates against any additional contribution to the thermal emission. We note, however, that the LECS, which provides data in the soft X-ray part of the spectrum and is used to constrain the intrinsic absorption and the normalization of the cooling flow component, has an energy resolution (FWHM) of about 11 per cent at 3 keV, that is comparable to ASCA Gas scintillation Imaging Spectrometers (GIS) but is poorer by a factor of 4 than the Solid state Imaging Spectrometers (SIS), which also has an effective area larger by a factor of 10 than the LECS. Therefore, any constraint on the modeling of the low-energy spectrum obtained through the “1T+CF” model will be less tight of that provided ASCA data (see Allen 2000). In our analysis, we placed lower and upper limit on the intrinsic cluster absorption of and cm-2 respectively. We flag as unc the values which are unconstrained within these bands by our analysis.
The quoted pseudo–bolometric luminosity is estimated over the energy range 0.01–100 keV for the “1T+CF” model.
| data | Model | kT | abundance | (d.o.f.) | Prob | -pow | |||
| keV | cm-2 | erg s-1 | |||||||
| RXJ1347-1145 | |||||||||
| only MECS | 1T | 0.989 (131) | 0.52 | – | – | 83.5 | |||
| LECS + MECS + PDS | 1T | 0.993 (207) | 0.52 | – | – | – | |||
| 1T+pow | 0.990 (205) | 0.53 | 2 (fixed) | () | |||||
| 1T+CF | 0.999 (205) | 0.49 | unc | 204.0 | |||||
| Z3146 | |||||||||
| only MECS | 1T | 0.904 (97) | 0.74 | – | – | 32.4 | |||
| LECS + MECS + PDS | 1T | 0.992 (141) | 0.51 | – | – | – | |||
| 1T+pow | 0.976 (139) | 0.57 | 2 (fixed) | () | |||||
| 1T+CF | 1.003 (139) | 0.47 | unc | 69.6 | |||||
| A2390 | |||||||||
| only MECS | 1T | 0.991 (142) | 0.52 | – | – | 34.7 | |||
| LECS + MECS + PDS | 1T | 1.074 (263) | 0.20 | – | – | – | |||
| 1T+pow | 1.039 (261) | 0.32 | 2 (fixed) | () | |||||
| 1T+CF | 1.058 (261) | 0.25 | unc | 78.3 | |||||


Generally, all of the spectral fits provide an acceptable reduced . We discuss in the next subsection the results obtained from both the “1T” and “1T+CF” model. Regarding the “1T+pow” model, we note that only A2390 shows a constrained contribution from a power-law component with a luminosity less than erg s-1 (2–10 keV) and a photon index of consistent with the typical value for active galaxies (e.g. Nandra et al. 1997). Both RXJ1347-1145 and Z3146 do not show reasonable values to model the power-law component. For reference, we quote in Table 2 the best-fit results obtained for the three clusters in exam with the “1T+pow” model and fixing the photon index to 2 (Nandra et al. 1997).
3.1 Comparison with ASCA and ROSAT results
All of the clusters in our sample were observed with both the ASCA (Tanaka et al. 1994) and ROSAT (Trümper 1983) satellites. We discuss below the previous estimates of the gas luminosity and temperature in comparison to the results presented in this work.
-
•
RXJ1347-1145. Schindler et al. (1997) estimate a luminosity of erg s-1 in the 2–10 keV ASCA /GIS band. This measurement is about 20 per cent lower than the value estimated from the ASCA /GIS3 for the same dataset by Allen (2000; , where hereafter is the luminosity in unit of erg s-1). From the fit of the MECS spectrum alone, we measure an intermediate value between the two ASCA estimates of erg s-1.
Schindler et al. (1997) also report a luminosity of and erg s-1 with ROSAT /HRI in the 0.1–2.4 keV and bolometric bands, respectively. Whereas the extrapolation of our 1T best-fit provides only 70 per cent of the ROSAT flux in the 0.1–2.4 keV band, the bolometric value is in good agreement with the result obtained from the 1T+CF model applied to the joint analysis of the 3 BeppoSAX instruments and about 7 per cent lower than the estimate in Allen (2000).
More controversial is the case for the gas temperature. While the estimate in Allen (2000) obtained from fitting simultaneously the 0.6–10 keV SIS and 1–10 keV GIS data is in agreement with the best-fit value of about 14 keV within the 90 per cent confidence interval, the value of keV (90 per cent confidence level) quoted in Schindler et al. (1997) can be excluded from the BeppoSAX data at 99.99 per cent confidence level. In fact, from our analysis, the (99.73 per cent) lower limit is given by a temperature of keV.
We show in Fig. 3 the residuals produced from the BeppoSAX data when the model of Schindler et al. (1997) is used. In particular, it seems that most of the residuals appear at energies below keV and above keV, in spectral region not well covered from the selected energy range in their ASCA analysis of 0.7–9 keV.

Figure 3: The best-fit model in second line of Table 1 in Schindler et al. (1997) is here considered: keV, cm-3, . Only the normalization is left free to vary. The rebinning is done for presentation purpose. -
•
Z3146. The estimated intrinsic rest-frame luminosity from the RASS (0.1–2.4 keV, Ebeling et al. 1998) is erg s-1. Using the same spectral model of Ebeling and collaborators, we calculate a of . Extrapolating the results of our 1T model, we measure erg s-1. Thus, there is evidence for a slight mismatch in the spectrum shape between ROSAT and BeppoSAX , despite a general agreement in the normalization.
In the 2–10 keV band, the fit of the MECS spectrum provides a luminosity of erg s-1, 13 per cent lower than the estimate from ASCA /GIS3 in Allen (2000).
Regarding the plasma temperature, our estimates are consistent within the 90 per cent confidence level with the results in Allen (2000).
-
•
A2390. Böhringer et al. (1999) fit both ROSAT /PSPC and ASCA /GIS data. They measure a luminosity of (0.1–2.4 keV) and (2–10 keV) erg s-1. Ebeling et al. (1998) quote an intrinsic luminosity of erg s-1 from the ROSAT All Sky Survey. Extrapolating to the 0.1–2.4 keV band the fit on our dataset, we obtain using the spectral model in Ebeling et al. (1998) and our best-fit 1T model, respectively, in good agreement with the ROSAT estimates.
Allen (2000) quotes a 2–10 keV ASCA /GIS3 luminosity of erg s-1, that is about 17 per cent higher than both the estimate of Böhringer et al. (1999) and our measure from MECS data only of erg s-1.
The gas temperature quoted in both Allen (2000) and Böhringer et al. (1999), and obtained from analysis of ASCA data, are consistent within the 90 per cent confidence limits with the values measured from the joint LECS-MECS-PDS fit.
In conclusion, our results point to a general 10 per cent systematic disagreement among the ASCA , ROSAT and BeppoSAX flux calibrations. It is worth noting that Grandi and Guainazzi show in the 1999 report on the BeppoSAX - ASCA intercalibration using 3C273 that GIS3 provides a normalization of the continuum higher by a factor between 9 and 15 per cent than the corresponding value estimated in the same energy band with MECS for quasi-simultaneous data acquired in 1996 and 1998.
4 A COOLING–FLOW CORRECTED L–T RELATION
The relations between the measured (e.g. gas temperature and luminosity) and derivative (e.g. total gravitating mass) quantities determined from X-ray observations is a basic step in constraining cosmological parameters through the cluster mass function.
The observed values of the intracluster gas luminosity and temperature are correlated due to the fact that the luminosity depends on the cluster baryon fraction and the temperature is a direct measure of the potential well of the dark halo.
In fact, the luminosity, , goes like , where we have considered that (i) the gas fraction ratio is constant with redshift, (ii) the dark matter density evolves like , and (iii) the equation of the hydrostatic equilibrium, , holds.
Considering that bremsstrahlung emission is the dominant emission process in clusters with keV, the cooling function, , is then proportional to and, consequently, the bolometric luminosity is proportional to the square of the temperature, . However, this is only valid for a sufficiently hot cluster where the ambient luminosity and temperature are well determined above any contamination, like the excess in cool emission present in the core of cooling flow clusters (e.g. Fabian et al. 1994, Allen & Fabian 1998, Markevitch 1998).
The three clusters presented in this work are among the most luminous known and are affected by the presence of the massive central cooling flows. Therefore, it is worth considering where they lie in the plot once we take into consideration the best-fit results of the “1T+CF” model. We add these results to a list of ASCA measurements of bolometric luminosity and temperature obtained from literature and corrected for the contamination from cooling flows, either by including a cooling flow model in the spectral analysis (like we have done in the present analysis; cf. also Allen & Fabian 1998) or excluding the central emission to compose the analyzed spectrum (e.g. Markevitch 1998).
The final sample is plotted in Fig. 4 and contains 64 entries. Of these, 3 are in common between our sample and the one of Allen and collaborators (A2390, Z3146, RXJ1347-1145), five (A478, A1795, A2029, A2142, A2319) are analyzed both in Allen & Fabian (1998) and in Markevitch (1998).
The physical values of the clusters in the combined sample range between (A2657) and (RXJ1347-1145) erg s-1 in bolometric luminosity (the median of the distribution is erg s-1), between (A1736) and (RXJ1347-1145) keV in temperature (median: keV), between (A2657) and (RXJ1347-1145) in redshift (median: ).
To investigate the behavior of the relation, we use the following linear fit
| (1) |
where erg s and , and we use the downhill simplex method implemented in the amoeba routine to minimize the following merit function (Press et al. 1992):
| (2) |
for each of the different datasets considered in our sample. In the equation above, and . We assume a 10 per cent uncertainty on the luminosity measurements (i.e., ) and equal to the maximum of the 68.3 per cent confidence asymmetric errors on the temperature.
In particular, combining several different datasets, we follow the indications in Lahav et al. (2000) for minimizing a “weighted” merit function
| (3) |
where is the number of data present in the dataset . This formalism allows us to consider some effective Hyper-Parameters, , that provide a diagnostic on the systematic effects (more relevant for low ) of that specific dataset in the overall modeling. Considering this, the BeppoSAX data are better modelled than the other two datasets ( 3 vs. 0.2).
The errors on the best-fit parameters are estimated from 500 bootstrap replications of the fit. In Table 3, we show both the best-fit parameters and and the values that characterize their distribution after 500 bootstraps (i.e., the median and the 16 and 84 percentile that corresponds to the lower and upper 1 level in a Gaussian distribution).
Here we note that the computation of the physical properties presented in the present work follows the technique used in Allen (2000) and differs from the analysis done by Markevitch in the fact that we try to model spectrally the emission from the core, whereas Markevitch cuts the core emission from the spectral analysis and extrapolates the contribution from the core to the total luminosity from the external emissivity. To take into account the different way in which the bolometric luminosity is estimated, we leave free the normalization, , in the relation in eqn. 1 when we perform a linear fit in each dataset. Only the slope parameter is linked among the three datasets.
Combining the three datasets, we observe a slope in the relation of about 2.7. From the distribution of the best-fit values after bootstrap resampling, we are still far (too steep) from the value of 2 predicted from the simple gravitational collapse of plasma in a cluster dark matter.
This result is consistent, within , among the three different datasets here considered and with the Bayesian analysis applied to the Allen (2000)’s and Markevitch (1998)’s sample by Reichart, Castander & Nichol (1999).
| cut | N data | N sample () | scatter | ||
|---|---|---|---|---|---|
| only BeppoSAX data | 3 | 3 (0.9) | 0.327 | ||
| only Allen (2000) | 30 | 30 (141.3) | 0.512 | ||
| only Markevitch (2000) | 31 | 31 (108.7) | 0.240 | ||
| all | 64 | 3 (1.0), 30 (146.8), 31 (109.9) | 0.437 | ||
| erg s-1 | 53 | 3 (1.0), 30 (141.5), 20 (71.0) | 0.420 | ||
| keV | 46 | 3 (1.2), 25 (86.0), 18 (61.6) | 0.388 |

5 DISCUSSION AND CONCLUSIONS
From the BeppoSAX observation, we can constrain the ambient temperature in the clusters of galaxies RXJ1347-1145, Z3146 and A2390 with a relative uncertainty of (17/41), (11/41), (7/9) per cent in the (lower/upper) boundary (at the 90 per cent confidence level) respectively, when a cooling flow model is included in the spectral analysis.
Although the instrument characteristics of BeppoSAX do not allow us to constrain firmly any absorption intrinsic to the cluster atmosphere and/or the normalization of the emission from the central cooling gas, the measurements of the ambient gas temperature are in agreement, within the 90 per cent confidence level, with the results from the analysis of ASCA data in Allen (2000). In particular, the plasma temperature in RXJ1347-1145 appears well defined between 13.2 and 22.3 keV (90 per cent confidence level) and above 12.1 keV at the level. This measurement of the temperature is in good agreement with an independent estimate of 16.2 ( 3.8, level) keV obtained from the observed X-ray gas density and the measured Sunyaev–Zeldovich (1972) distorsion of the cosmic microwave background in the direction of RXJ1347-1145 (Pointecouteau et al. 1999; see also Komatsu et al. 1999).

Following the arguments of many authors (e.g. Bahcall & Fan 1998, Donahue et al. 1999, Henry 2000) the existence of such a hot cluster at redshift 0.45 is highly unlikely in an Einstein – de Sitter universe. We can estimate this probability, calculating the expected evolution of collapsed structures with a given minimum mass according to the Press-Schechter (1974) formalism. Integrating the number of collapsed objects with gravitating mass above that corresponding to a temperature of 15.9 keV over the redshift range of , and requiring at least the existence of RXJ1347-1145, the single detection provides a stringent upper limit of 0.43. Considering also the lower and upper end of the range of the acceptable gas temperature of 13.2 and 22.3 keV, with the 90 per cent uncertainty on the single detection, we constrain the cosmological parameter between 0.25 and 0.70 (cf. Fig. 5).
Future Chandra and XMM observations of these highly luminous clusters of galaxies at intermediate redshift will resolve spatially the profiles of the gas temperature, abundance and deposition rate.
ACKNOWLEDGEMENTS
This paper has made use of linearized event files produced at the BeppoSAX Science Data Center. We thank T. Oosterbroek and A. Parmar for their help in using the SAXDAS routine lemat. The referee, A. Edge, is thanked for his suggestions in improving the presentation of this work. We acknowledge the support of the Royal Society.
References
- [] Abell G.O., Corwin H.G., Olowin R.P., 1989, ApJS, 70, 1
- [] Allen S.W., 1998, MNRAS, 296, 392
- [] Allen S.W., Fabian A.C., 1998, MNRAS, 297, L57
- [] Allen S.W., 2000, MNRAS, 315, 269
- [] Arnaud K.A., 1996, ”Astronomical Data Analysis Software and Systems V”, eds. Jacoby G. and Barnes J., ASP Conf. Series vol. 101, 17
- [] Bahcall N. A., Fan X., 1998, ApJ, 504, 1
- [] Balucinska-Church M., McCammon D., 1992, ApJ, 400, 699
- [] Boella G., Butler R.C., Perola G.C., Piro L., Scarsi L., Bleeker J.A.M., 1997, A&AS, 112, 299
- [] Böhringer H., Tanaka Y., Mushotzky R.F., Ikebe Y., Hattori M., 1999, AA, 334, 789
- [] Dickey J.M., Lockamn F.J., 1990, Ann. Rev. Ast. Astr., 28, 215
- [] Donahue M., Voit G.M., Scharf C.A., Gioia I.M., Mullis C.R., Hughes J.P., Stocke J.T., 1999, ApJ, 527, 525
- [] Ebeling H., Edge A.C., Böhringer H., Allen S.W., Crawford C.S., Fabian A.C., Voges W., Huchra J.P., 1998, MNRAS, 301, 881
- [] Edge A.C., Fabian A.C., Allen S.W., Crawford C.S., White D.A., Böhringer H., Voges W., 1994, MNRAS, 270, L1
- [] Fabian A.C., Crawford C.S., Edge A.C., Mushotzky R.F., 1994, MNRAS, 267, 779
- [] Fiore F., Guainazzi M., Grandi P., 1999, Cookbook for BeppoSAX NFI Spectral Analysis, version 1.2, available at http: //www.sdc.asi.it /software /cookbook/
- [] Gehrels N., 1986, ApJ, 303, 336
- [] Grandi P., Guainazzi M., 1999, “3C273 BeppoSAX -ASCA intercalibration”, available at ftp://www.sdc.asi.it/ pub/ sax/ doc/ reports/ asca_sax_crosscal.ps.gz
- [] Henry J.P., 2000, ApJ, 534, 565
- [] Kaastra J.S., 1992, An X-Ray Spectral Code for Optically Thin Plasmas (Internal SRON-Leiden Report, updated version 2.0)
- [] Komatsu E., Kitayama T., Suto Y., Hattori M., Kawabe R., Matsuo H., Schindler S., Yoshikawa K., 1999, ApJL, 516, L1
- [] Lahav O., Bridle S.L., Hobson M.P., Lasenby A.N., Sodre Jr L., 2000, MNRAS, 315, L45
- [] Liedahl D.A., Osterheld A.L., Goldstein W.H., 1995, ApJ, 438, L115
- [] Markevitch M., 1998, ApJ, 504, 27
- [] Nandra K., George I.M., Mushotzky R.F., Turner T.J., Yaqoob T., 1997, ApJ, 477, 602
- [] Pello R., LeBorgne J.F., Soucail G., Mellier Y., Sanahuja B., 1991, ApJ, 366, 405
- [] Pierre M., LeBorgne J.F., Soucail G., Kneib J.P., 1996, A&A, 311, 413
- [] Pointecouteau E., Giard M., Benoit A., Desert F.X., Aghanim N., Coron N., Lamarre J.M., Delabrouille J., 1999, ApJL, 519, L115
- [] Press W.H., Schechter P., 1974, ApJ, 187, 425
- [] Press W.H., Teukolsky S.A., Vetterling W.T., Flannery B.P., 1992, Numerical Recipes in Fortran, Cambridge University Press
- [] Reichart D.E., Castander F.J., Nichol R.C., 1999, ApJ, 516, 1
- [] Sarazin C.L., 1988, X-ray emission from clusters of galaxies, Cambridge University Press
- [] Schindler S., Guzzo L., Ebeling H., Böhringer H., Chincarini G., Collins C.A., De Grandi S., Neumann D.M., Briel U.G., Shaver P., Vettolani P., 1995, A&A, 299, L9
- [] Schindler S., Hattori M., Neumann D.M., Böhringer H., 1997, A&A, 317, 646
- [] Squires G., Kaiser N., Fahlman G., Babul A., Woods D., 1996, ApJ, 469, 73
- [] Sunyaev R., Zeldovich Y., 1972, Comments Astrophys. Space Phys., 4, 173
- [] Tanaka Y., Inoue H., Holt S.S., 1994, PASJ, 46, L39
- [] Trümper J., 1983, Adv. Space Res., 2, 142
- [] Ulmer M.P., Kowalski M.P.m Cruddace R.G., 1986, ApJ, 303, 162
- [] Yee H.K.C., Ellingson E., Carlberg R.G., 1996, ApJS, 102, 289