The Evolution of Population Gradients in Galaxy Clusters: the Butcher-Oemler Effect and Cluster Infall
Abstract
We present photometric and spectroscopic measurements of the galaxy populations in clusters from the CNOC1 sample of rich, X-ray luminous clusters at . A classical measure of the galaxy blue fraction for spectroscopically confirmed cluster members shows a significant Butcher-Oemler effect for the sample, but only when radii larger than 0.5 are considered. We perform a principal component analysis of galaxy spectra to divide the total cluster light into contributions from stellar populations of different ages. Composite radial distributions of different stellar populations show strong gradients as a function of cluster-centric radius. The composite population is dominated by evolved populations in the core, and gradually changes at radii greater than the virial radius to one which is similar to coeval field galaxies. We do not see evidence at any radius within the clusters for an excess of star formation over that seen in the coeval field. Within this redshift range, significant evolution in the fractional population gradient is seen. Both low and high redshift clusters have similar populations in the cluster cores, but higher redshift clusters have steeper gradients and more star forming galaxies at radii outside of the core region – in effect, a restatement of the Butcher-Oemler effect. Luminosity density profiles are consistent with a scenario where this phenomenon is due to a decline over time in the infall rate of field galaxies into clusters. Depending on how long galaxies reside in clusters before their star formation rates are diminished, this suggests a decrease in the infall into clusters of a factor of between and . We also discuss alternative scenarios for the evolution of cluster populations.
1 Introduction
The evolving populations in galaxy clusters offer a unique opportunity to directly observe galaxy evolution, and particularly the effects of environment on star forming galaxies. Present-day rich clusters have strikingly different populations from galaxies in poorer environments, suggesting that some mechanism is at work on the cluster population which is absent in the lives of normal field galaxies. The first clues towards understanding the evolution of the cluster population came more than 20 years ago, with the discovery that higher redshift clusters have a larger fraction of blue galaxies than those at the present epoch: the Butcher-Oemler effect (Butcher & Oemler 1978, 1984). These purely photometric results were confirmed spectroscopically (e.g., Dressler & Gunn 1982, 1992; Lavery & Henry 1986; Fabricant, McClintock & Bautz 1991) and populations of both star forming and recently post-star formation galaxies in moderate redshift clusters have been identified (i.e., the Balmer-strong H- or KA galaxies; Dressler & Gunn 1982; Couch & Sharples 1987; Poggianti et al. 1999). Many subsequent investigations have focused on the details of how these galaxies are transformed into the population seen in clusters today (Couch & Sharples 1987; Barger et al. 1996; Poggianti et al. 1999; Balogh et al. 1999, B99 hereafter). The emerging picture is that there may be a population of galaxies which were formed very early in the cluster’s history, corresponding to the ellipticals often seen in cluster cores (e.g., Bower, Lucey & Ellis 1992; Ellis et al. 1997; Gladders et al. 1998; Kelson et al. 2000; van Dokkum et al. 1998). Subsequent generations of infalling field galaxies have had their star formation disrupted, possibly with an associated starburst. As this transformation progresses, these galaxies might be identified with normal-looking spirals, then galaxies with strong Balmer absorption spectra, and finally S0 galaxies which have retained some of their disk structure but have ceased active star formation (Dressler et al. 1997).
Despite these advances, a number of questions remain about the evolution of cluster galaxies and the Butcher-Oemler phenomenon. Recently, there have been several challenges to the existence of the Butcher-Oemler effect as a universal pattern which equally affects all classes of clusters (Andreon 1998; Andreon & Ettori 1999; Smail et al. 1998; Jones, Smail & Couch 2000). The original distant cluster samples which were investigated are a heterogeneous mixture of clusters found by optical signatures or by their association with a strong active galactic nucleus. In many cases, cluster masses or richnesses are still not well determined due to the difficulty of obtaining robust velocity dispersions, and there is a possibility of significant substructure in some objects. More recently, X-ray selected clusters, which in part overlap with optically-selected clusters but on average may be more massive or more relaxed, have been investigated. In several cases (Smail et al. 1998; B99), the incidence of blue or post-star forming galaxies has been found to be significantly less than that of previous samples. Thus, a worrisome question remains as to how the observed galaxy populations relate to the more global properties of the clusters, such as mass and dynamical state, as well as the cluster sample selection method.
Even if clusters do contain a higher fraction of star forming galaxies at higher redshifts, a second fundamental question is whether this blue population represents a true increase in the average star formation in these galaxies over the properties of galaxies in the coeval field. A significant fraction of galaxies in some spectroscopic surveys have been found to be starbursts or have Balmer lines strong enough to signify a previous starburst encompassing 10-30% of the galaxy mass (Lavery & Henry 1988; Barger et al. 1996; Poggianti et al. 1999). This suggests that temporary episodes of excess star formation are associated with a galaxy’s tenure in the cluster. However, Balogh et al. (1997, B99) found no evidence for excess star formation in a sample of luminous X-ray selected clusters, as the generally smaller numbers of starburst and post-starburst galaxies could be explained by galaxies infalling from the field. Thus, they conclude that the cluster environment works only in the direction of suppressing star formation. The differences in these results may be partially ascribed to differences in the selection technique for the galaxies observed and identified in both cluster and field; but some of the discrepancy may come from true differences in the cluster samples.
Here we describe an investigation of the relationship between galaxy evolution and cluster structure, based on a well-defined and homogeneous sample of clusters at and coeval field galaxy measurements. Photometry and spectroscopy from the Canadian Network for Observational Cosmology Cluster Redshift Survey (CNOC1; Yee, Ellingson & Carlberg 1996) were used to construct a sample of cluster galaxies and the properties of their stellar population. Field galaxy measurements from the CNOC2 Field Galaxy Survey (Yee et al. 2000) were used to accurately determine the properties of field galaxies at these redshifts. We present both a classical measure of the cluster blue fraction determined from spectroscopically confirmed cluster members and a spectral principal component analysis (PCA) which delineates the relative fractions of starlight from different stellar populations. In an approach complementary to that of looking at individual galaxy properties in detail, we focus on building smooth composite spatial distributions of the various stellar populations. With these distributions, it is possible to explore the relationship between the evolution of galaxy populations and the growth and evolution of the cluster.
In §2 of this paper we present the data and in §3 we discuss the blue fraction measurements. We describe the principal component analysis method and tests of its accuracy from galaxies of known spectral type in §4. In §5 we present the results based on composite radial distributions of the average PCA components. We discuss the results and their implications for scenarios of galaxy population evolution in rich clusters in §6. Our conclusions are summarized in §7. Throughout this paper =0.1 and =100 km s-1 Mpc-1 are used.
2 The CNOC1 Cluster Sample
The CNOC1 Cluster Redshift Survey targeted 16 rich X-ray luminous galaxy clusters with . The clusters range in velocity dispersion from about 600 to 1200 km s-1, with erg s-1. Deep Gunn and imaging and multi-slit spectroscopic observations from the Canada-France-Hawaii 3.6m telescope were used to map the cluster sample to radii of 1–3 Mpc from the cluster cores. Wavelength coverage was Å in the rest frame of each cluster, with a resolution of about 15Å. This wavelength range samples the important features of [OII] emission, the 4000Å break, Ca[II] H and K and the Balmer lines H and higher. A total of 1200 cluster galaxies were spectroscopically identified. The CNOC1 cluster MS0906+11 was omitted from this analysis because it shows strong binary substructure in both X-ray and velocity data, and robust values for dynamical parameters were not possible.
Particular care was taken to quantify selection effects and the completeness of the sample as a function of galaxy magnitude, color, redshift and position. For each galaxy, a completeness measure was empirically calculated for its apparent magnitude, position within the cluster and color ( and ; see Yee et al. 1996 for details). These values reflect our selection criteria for spectroscopy, as well as empirical success rates, and their inverses are used as weighting functions to build a representative sample of cluster properties. The largest factor in these weights is due to apparent magnitude, and the color selection effect is very small. The wide field coverage and careful attention to the empirical selection functions are crucial for building an accurate portrait of cluster structure. We note that CNOC1 chose a relatively simple selection criterion based only upon galaxy apparent magnitude and position; for comparison, the MORPHS clusters observed by Dressler et al. (1999) were chosen by a combination of magnitude, position and morphology/color in order to concentrate observations on the non-passive population. As a result, the overlap between the several clusters the CNOC and MORPHs samples have in common is actually minimal – MS 0016+16 has an overlap of only 7 cluster galaxies (Ellingson et al. 1998).
Dynamical and spatial analyses of the clusters (Carlberg et al. 1996; Carlberg, Yee & Ellingson 1997, CYE hereafter; Carlberg et al. 1997a, b) yielded cluster masses, mass-to-light ratios and density profiles. In particular, we adopt their dynamically-determined values for , the radius within which the average cluster density is 200 times the critical density. This radius averages 1.17 Mpc for the sample; virial radii are 1.5–2 . Lewis et al. (1999) presented the X-ray gas profiles from ROSAT HRI and PSPC observations of much of the sample, finding that dynamical and X-ray measurements of the cluster masses are in excellent agreement. Balogh et al. (1997, B99) analyzed spectral line indices for cluster galaxies in a classical approach to galaxy evolution which is complementary to the approach used here. Whereas line indices give detailed information about star formation histories in individual galaxies, here we use a PCA decomposition as a broader measure of galaxy properties to create smooth distributions of starlight in populations at several different ages. These measurements are then combined with the dynamical and X-ray properties of the clusters to address the issue of galaxy evolution in terms of the spatial distribution of different populations.
3 The Blue Galaxy Fraction
The first indication of evolution in cluster populations came from purely photometric measurements of the fraction of blue galaxies, , in the clusters (Butcher & Oemler 1978). The original definition of was based on the fraction of galaxies in a cluster which are more than 0.2 mag bluer in than the early-type galaxies. The galaxies are counted to an absolute magnitude of within the radius , which encompasses 30% of the cluster galaxies. While the Butcher-Oemler effect is clearly seen in many clusters, this purely photometric measure can be affected by the significant fraction of field galaxies found within the counting radius. The CNOC1 survey provides a dataset from which one can derive for a substantial sample of spectroscopically-confirmed cluster members, without having to perform background corrections. Here we use similar but not identical definitions to compute for the CNOC1 clusters, using the spectroscopically confirmed cluster galaxies only, and for a range of absolute magnitude and radius parameters.
We define the dividing line between blue and red galaxies relative to the observed color of the cluster red sequence. This guards against possible systematic errors in our color measurements. On the vs diagram we fit the color magnitude relation for the early-type galaxies using a least absolute deviation (LAD) algorithm (Press et al. 1992) with iterative rejection. The fit is performed using galaxies inside 1/2 to maximize the prominence of the red-sequence. Since the LAD algorithm can be unstable, the fit is examined by eye to ensure a good fit. In a few instances where there are either too few galaxies defining the red-sequence or the red-sequence has too wide a dispersion compared to its magnitude range, an eye-fitted CMR is used.
Blue galaxies are defined as galaxies bluer than half the color difference (in the observed bands) between the E/S0 and Sbc SED, where the SEDs are computed from the templates of Coleman, Wu & Weedman (1980); i.e., the dividing line between blue and red galaxies is half way between the colors of an E/S0 and Sbc galaxy. This corresponds to of 0.21 to 0.28 mag, depending on the cluster redshift. The original criterion of mag (corrected to z=0) is similar, in that it corresponds to 2/3 of the difference between the colors of an E/S0 and Sbc galaxy. It should be noted that is strictly computed based on the photometric properties of the galaxies, regardless of the spectroscopic classification. The only spectroscopic information that is used is the redshift, which defines a galaxy as a cluster member.
For the primary values, we count galaxies within the redshift limits defined for each cluster as presented in Table 1 of Carlberg et al. (1996) to a k- and evolution-corrected absolute magnitude of , or the spectroscopic magnitude limit (CYE), whichever is brighter. K-corrections are calculated from Coleman et al. (1980) and the evolution assumed is . All but three clusters out of 15 (MS0015+16, MS0451-03, and MS1006+12) have spectroscopic limits which are within 0.5 mag of –19.0 mag. The counting radius is . The galaxies are weighted as described in §2 above, and error bars are computed using simple root statistics. As a comparison to the original definition of , the limit is slightly brighter (equivalent to ), and the average radius of 1.17 h-1 Mpc for , is typically a factor of 2 or more larger than .
The results are plotted in three panels in Figure 1 as vs . Figure 1a shows the strong correlation of vs redshift, with a range of between 0.1 to 0.4, similar to that obtained by Butcher & Oemler (1984). The dashed line represents the best fit to the data, with a slope of 0.62 0.14. To test the effects of the galaxy sample selection limits, we also computed values using the criteria of a sampling radius of and , as well as 0.5 and (Figures 1b and 1c). The former test is important to verify that the somewhat uneven absolute magnitude limits of the primary sample do not have a significant influence on the values, as typically the higher the redshift of the cluster, the higher the probability that it is not sampled to –19.0 mag. Figure 1b indicates that and the Butcher-Oemler effect do not depend critically on on the luminosity of the galaxies. Sampling to a limit one magnitude brighter produces mostly additional scatter in the results – the average value for is essentially identical with an average ratio of 1.
Sampling to a smaller radius (Figure 1c), however, appears to produce a significant effect. When sampling only to a radius of 1/2 r200, the blue fraction drops by an average of 20% (a 2 result), and the Butcher-Oemler effect appears to be mostly obliterated, in that most clusters (with the exception of MS0451–03) have very similar values, regardless of their redshift. It appears that the cores of clusters do not evolve significantly in their populations, and that the Butcher-Oemler effect is caused by changes in populations at radii well outside of the cluster cores. This result immediately hints at the possibility of strong and evolving population gradients in galaxy clusters, and also explains some of the discrepant results from estimates of which have relied on data from only the cluster cores (e.g., Smail et al. 1998).
4 Principal Component Analysis of Galaxy Spectra
4.1 Technique
Principal component analysis (PCA) provides a sensitive method for measuring the strengths of different stellar populations from spectroscopic data. This technique has been used by various groups (e.g., Connolly et al. 1995; Zaritsky, Zabludoff & Willick 1995; Bromley et al. 1998; Folkes et al. 1999) to determine galaxy populations. It is especially applicable to the faint, high redshift galaxies observed in the CNOC1 survey, because the entire spectrum, rather than a narrowly defined range of line indices, contributes to the measurement.
We use the relatively high signal-to-noise galaxy spectra taken from the Las Campanas Redshift Survey (LCRS; Shectman et al. 1996) to derive our PCA basis vectors. The method employed is the same as that described in detail by Bromley et al. (1998) in their LCRS spectral classification analysis; here we give only a very brief summary. The LCRS spectra are first renormalized, de-redshifted to the rest-frame wavelength range 3500-5500Å, and then effectively continuum subtracted by high-pass filtering. The resulting catalog of spectra is then put into matrix form, upon which we apply singular value decomposition (SVD; see e.g., Press et al. 1992) in order to derive the set of orthonormal vectors, here galaxy spectra, which will then form the basis in our principal component analysis. The original LCRS analysis finds four significant PCA basis vectors, which correspond roughly to an “Elliptical” component showing the standard old-population features, two “Emission” components exhibiting [OII] 3727 and [OIII] 4959,5007 emission lines typical of star formation, and a “Balmer” component featuring strong Balmer absorption lines indicative of intermediate age stars. In this paper we combine the two original emission components into a single vector because our CNOC1 spectra generally do not extend to the H/[OIII] region. We plot in Figure 2 the resulting three orthonormal PCA basis vectors used in the analysis of our CNOC spectra.
We use a standard linear least-squares technique to decompose each spectrum into the best-fit linear combination of the three orthonormal PCA basis vectors. At the same time, we also fit a 7th-order Legendre polynomial to each spectrum in order to account for the continuum, as the PCA basis was derived originally from continuum-subtracted data. The fits are done in observed-frame wavelengths, and we use simple linear interpolation to compute flux values for the basis vectors at the appropriate redshifted wavelengths. In effect, we are writing each continuum-subtracted spectrum, , as a linear combination of the three PCA basis vectors ,
| (1) |
where is the wavelength, is the galaxy redshift, and the are the best-fit PCA coefficients. We further renormalize the according to
| (2) |
so that the form a measure of the fractional luminosity-weighted contribution of each PCA basis vector to the galaxy spectrum in question. The set of thus provides a measurement of the stellar population for each galaxy, and we will typically refer to the as the PCA components.
The combination of these three PCA components is adequate to separate most types of normal galaxies. Figure 3 shows PCA components for galaxies in the Kennicutt Spectrophotometric Atlas of low-redshift galaxies (Kennicutt 1992). Normal elliptical and spiral galaxies are well separated on this plot. Our chosen normalization requires that the data points lie within the lower left triangle of the plot: a pure “Elliptical” spectrum will be located at the origin. Note that the Kennicutt Atlas does not populate the region of the plot with large Balmer values and low emission-line values. In this region we plot high signal-to-noise examples of KA (post-star formation) galaxies from the CNOC1 clusters as identified by standard line indices (e.g., Barger et al. 1996; Poggianti et al. 1999; B99) to illustrate the properties of these important cluster galaxies.
We estimate uncertainties in the PCA components, , as follows. We start with the formal uncertainties in the returned by the linear least-squares fit, and check these error estimates using the 1164 CNOC2 (Yee et al. 2000) galaxies for which we have two independent spectra available for PCA fits. We compare the actual differences in the to their formal errors, and we find that the main effect is that the formal errors are underestimates at , but overestimates at larger . We thus empirically rescale the formal uncertainties in order to match the observed differences, and as we have a large set of redundant spectral observations, we can readily do this rescaling as a function of for each of the three PCA components. The typical correction factors to the original formal errors are for , and at larger .
For our data, negative values are allowed for any of the components, in order to retain statistical robustness and to provide an additional check on uncertainties. Our average spectra have uncertainties on the order of 0.01–0.15 in each component. Large negative values are absent, with the exception of a small number of galaxies with negative “Emission” components. These stem from large noise spikes at the blue end of some of the lower redshift galaxies being mistaken for (negative) [OII] emission, and are usually accompanied by large estimated uncertainties. We note that these galaxies also have large negative [OII] equivalent widths and large uncertainties as reported by B99. The “Emission” component is most sensitive to this type of error because we typically sample only one strong emission feature in our spectral range; as such, it is most closely analogous to a single line index measurement. Unfortunately, such errors, when combined with our normalization scheme, can also strongly affect the other components. Because of this, galaxies with values less than in any component are individually examined, and if a single noise feature is implicated in a negative emission component, the emission component is set to zero and the other components renormalized accordingly. Comparison of galaxy colors and line indices versus PCA components, for galaxies which have undergone this correction versus those which have cleaner blue spectral regions, show no systematic effects.
PCA values were also checked against the classical line indices from B99 (Figure 4). The expected correlations between “Emission” and [OII] and between “Balmer” and H are seen, with variations within the uncertainties. Note that the correlations are not required to pass through the origin, as the PCA components are based on relative powers of many lines. The PCA analysis was able to extract usable values for about 15% more galaxies than the line indices, and, in general, uncertainties were slightly smaller relative to the range of values observed (i.e., 2Å uncertainty was typical for H-, which has about a 10Å true range in the sample; the PCA component has a median uncertainty of 0.08 for measurements with a range of 0–0.8). Thus, the PCA components can produce a somewhat clearer delineation between objects with differing stellar populations. One feature of note is that the “Emission” component saturates at unity as the [OII] line strength increases. That is, our PCA technique is not usable as a linear measure of emission line luminosity in individual galaxies beyond Sc, as a Scd and a starburst galaxy may both have values close to unity. Thus, a detailed analysis of starburst galaxies is better done directly with emission line indices, rather than with these PCA components, though measurements of star formation rates for less active types are still accurate. For cluster populations, the fraction of very strong star forming galaxies is very small, so this slight nonlinearity is unlikely to significantly affect average population measures.
4.2 Population Gradients in Galaxy Clusters
A composite average population gradient from 913 galaxies in 15 clusters was constructed from galaxies with k -evolution corrected . In constructing composite PCA values for subsamples of the data, individual galaxy PCA values were weighted according to each cluster’s selection function for apparent magnitude, position within the cluster, and color (see §2). More than 50% of galaxies within these magnitude limits are sampled in each cluster, with the success rate of identifying objects observed spectroscopically greater than %. About 3% of the galaxies with redshifts showed catastrophic problems in a part of the spectrum which made accurate PCA estimates impossible. These objects were excluded from the sample and galaxy weights for the remaining objects were recalculated accordingly. Creating a fair composite sample of the galaxies as a function of cluster-centric radius also requires correcting for the fact that the individual clusters can have varying observational coverage. To account for the fact that some clusters were not observed to the maximum radius, weights for galaxies at large radii were increased by the inverse of the fraction of the clusters which were observed to that radius. For this analysis, the brightest cluster galaxy was omitted for each cluster, since these galaxies (which are often cD galaxies) may have a very different star formation history from the rest of the cluster. Finally, galaxies were also weighted by the inverse of the cluster richness, as measured by the galaxy-cluster spatial covariance amplitude Bgc (e.g., Yee & López-Cruz 1999). This photometric measure of the galaxy overdensity within 0.25 Mpc of the cluster core is well correlated with velocity dispersion and X-ray temperature (Yee et al. 2000). Correcting for cluster richness ensures that the results are not dominated by the few richest clusters, and that composite luminosity densities for high and low redshift subsamples are properly normalized, even if there is a difference in mean richness between them. Together, this weighting scheme allows us to create a fair sample of cluster properties, corrected for observational selection effects and the gross effects of richness. Galaxy positions were scaled by (CYE), which corrects for differing cluster richness by scaling each galaxy position to a fixed cosmological overdensity. These dynamical parameters are well determined for these clusters by 30-200 cluster members each, and have been found to yield results in excellent agreement with X-ray determinations of the cluster masses (Lewis et al. 1999).
Figure 5a shows the average PCA components for a composite of the 15 clusters, as a function of cluster-centric radius. A clear spatial gradient is seen, with the older population declining from the cluster core towards the outer parts of the cluster, and an accompanying increase in the emission line component. There are between 107 and 294 galaxies in each bin except for the outermost, which has only 17. Uncertainties were estimated via bootstrap techniques. Also plotted are the average PCA values for galaxies at taken from the CNOC2 field galaxy spectroscopic sample. It is clear that the PCA component curves are approaching these values with increasing radius, and also that at no point is there an excess of emission line activity in the cluster, relative to the field, confirming the results from Balogh et al. (1997), who used line indices from the same spectral database.
Morphological and spectral gradients similar to this are seen in low-z clusters (e.g., Oemler 1974; Dressler 1980; Whitmore et al. 1993). Similar gradients, seen in galaxy color, morphology, or emission line strengths, have also been noted in clusters at higher redshifts by a number of investigators (e.g., Abraham et al. 1996; Smail et al. 1998; Morris et al. 1998; Couch et al. 1998; Balogh et al. 1997 and Dressler et al. 1997). Such gradients are consistent with the infall of field galaxies in hierarchical clustering models of cluster growth (e.g., Gunn & Gott 1972; Kauffmann 1995; Balogh, Navarro & Morris 2000) and suggest that galaxies which have more recently fallen into the cluster potential preferentially inhabit its outskirts. A related phenomenon is the spatial/velocity segregation of red and blue galaxies in clusters. Blue galaxies are generally found to have higher velocities and more extended spatial distributions than red galaxies, which has led to some confusion as to the accuracy of virial mass estimates. Carlberg et al. (1997), however, showed that for the CNOC1 sample, a separate dynamical analysis of red and blue subsamples produced the same mass. Thus, we expect these gradients in our data, and note that galaxies throughout the clusters appear to be at least in quasi-equilibrium with the cluster potential.
The principal component analysis allows the construction of a smooth model cluster in the three separate components, and hence allows a self-consistent correction for spatial projection effects. A deprojected version of the component fractions is shown in Figure 5b. Here an overall average galaxy density profile, (r), was adopted from CYE and is of the form:
| (3) |
where is the true, deprojected radius. For each ring in projected radial coordinates, we determine the fractional contribution from galaxies in shells at greater true radius, . The projected PCA components are then corrected for contamination from the projection of these galaxies. The outermost bin is the first to be corrected. PCA components for regions outside of the surveyed area. The values for are assumed to be the CNOC2 field values and the average of the outermost data point and the field values is assumed for . The spatial deprojection is then propagated inwards, using the new components for the outer bins to correct the inner ones. The spatial deprojection tends to steepen the gradient but the effect is relatively small; the most significant difference is that the innermost points for the elliptical population are raised by about 10%. While deprojected profiles are appealing, this process introduces substantial random and systematic uncertainties from the assumed profile, and errors in the outer bins propagate inwards – note, for example, how the slight departure from absolute smoothness in the projected profile at is amplified in the bin at . Thus, while we provide deprojected versions of several of our results based on the whole cluster sample, results which further split the data into smaller subsamples are shown only in projected spatial coordinates.
4.3 Population Gradients in “Natural” PCA Coordinates
The three original PCA axes are strikingly similar to recognizable stellar population types, but do not actually correspond exactly to distinct real galaxy types. However, these PCA components can be linearly transformed to measure a galaxy’s match to any template stellar population. In Figure 6a we plot a weighted composite for the sample, where the three components have been linearly transformed to a new PCA coordinate system with axes named “Old Population”, “Field-like”, and “Post-Star Formation (PSF)”. These new PCA coordinates were defined in order to divide the stellar light from each galaxy into components representing empirically-determined stellar populations of different ages: a “natural” PCA coordinate system for cluster populations. Table I lists the axes of the redefined PCA coordinate system in terms of the original components. “Old Population” values were chosen to match ellipticals in the Kennicutt Spectrophotometric Atlas of galaxies (1992), and agree with the reddest galaxies in these clusters. A decomposition of spectral synthesis models (from Bruzual & Charlot 1993) indicates that any population more than about 3 Gyr old will yield similar PCA values. The new “Field-like” vector is calculated separately for each cluster, based on the average for CNOC2 field galaxies at these same redshifts and magnitudes. On average, values are similar to a present-day Sbc, but with additional power in Balmer absorption lines. There is a mild increase in the “Emission” fraction between and and thus the “Field-like” component is defined as a function of cluster redshift. “Post-Star-Formation” values are determined from a spectral synthesis model of a galaxy whose star formation is constant for 4 Gyr and then is abruptly stopped. The new vector corresponds to the time of the maximum Balmer component, about 1 Gyr after the truncation. This rather extreme spectral type is found to be in general agreement with the observed PCA values from the strongest KA spectra of galaxies seen in the clusters.
Note that these components are not strictly orthonormal, though they are normalized to a sum of unity, as before. Thus, the equivalent of total flux is conserved, but the final component values are dependent on the choice of all three axes. While the “Old Population” and “Field-like” components are robustly determined empirically, the “PSF” component is somewhat more arbitrarily defined. Choosing a slightly different recipe for this component will raise or lower all three values. For example, changing the “PSF” component to a somewhat less strong Balmer component, more indicative of average KA galaxies (Elliptical= 0.15, Emission=0.15, Balmer=0.70; see e.g., Figure 3) will raise the “PSF” component for an average cluster galaxy by about 0.02, and lower each of the “Old Population” and “Field-like” components by about 0.01 to compensate. Thus, in addition to the random uncertainties in our PCA values, there is an additional systematic uncertainty of a few percent in their interpretation as real stellar populations.
Despite this slight degeneracy, the overall cluster structure is well illustrated by this transformation. “Old Population” galaxies preferentially occupy the cluster interior, and a smooth gradient towards younger populations is seen until the properties of cluster galaxies approach those of the coeval field population asymptotically at 2–5 , well outside of the virial radius. Figure 6b shows the same results deprojected in the same manner as Figure 5b. The profiles are qualitatively the same as for the projected spatial coordinates, but are steeper in the core region. Note especially that the data are quite consistent with zero “Field-like” or “PSF” component in the cluster core, and then a fairly steep rise within about 0.5.
The post-star formation component appears relatively flat in projected spatial coordinates, and flat with a central dip in deprojected spatial coordinates with a component fraction of about 10%. Again, there is a possibility of a few percent systematic uncertainty in the absolute values, though the overall shape remains the same for different choices of PCA coordinates. This is larger than the fraction of identifiable KA galaxies seen in the same dataset by B99, who further conclude that there is no excess of such galaxies over the field. However, the PCA technique is sensitive to smaller fractions of galaxy light in the post-star formation state (i.e., there is no discrete cutoff in line strength, as there is in identifying individual KA galaxies), so higher fractions are expected than for studies which count only galaxies with extreme signatures. We confirm the result that there is only a few percent of very strong Balmer-line galaxies in the clusters, but note that there are many galaxies with slightly weaker Balmer lines still in excess of what is expected for normal field or elliptical galaxies. These galaxies overlap the observational scatter from the substantial passive/elliptical galaxy population and so individual identification of their populations is impossible. Thus, the comparison with B99 appears reasonable, and this analysis of the data suggests that there is a small excess of light from intermediate age stars over the field population. Comparison with the KA fraction in the MORPHS sample of clusters at similar redshifts (Dressler et al. 1999; Poggianti et al. 1999) is slightly more troubling, as they find closer to 20% of the galaxies have strong post-starburst signatures. This may signify true differences in cluster populations for X-ray selected clusters such as the EMSS sample, versus the optically-selected MORPHS clusters (see §6).
The intermediate shape of the “PSF” profile, neither rising nor falling as steeply as the other components, indicates that the “PSF” components do indeed trace a population which is intermediate in dynamical state as well as stellar age. Interestingly, because the populations must approach a pure “Field-like” component outside of the cluster, we expect that the “PSF” component will approach zero at large radii. However, our data do not show an obvious decline even in the outermost data point.
4.4 The Evolution of Population Gradients
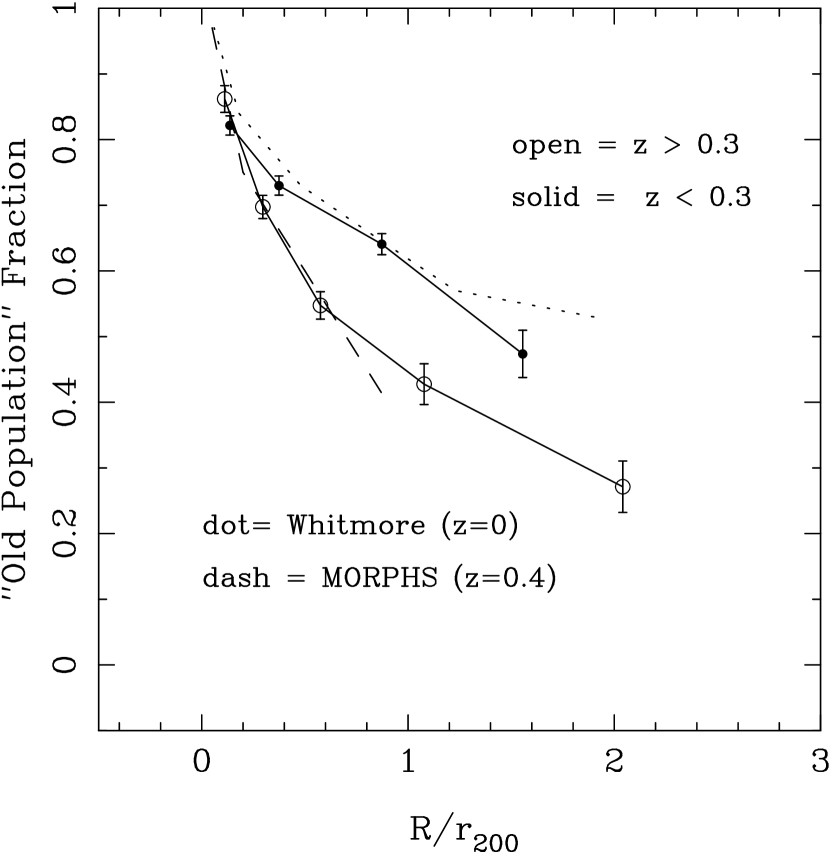
In Figure 7 we examine the trend in population gradients in clusters over our redshift range of 0.18 to 0.55. Plotted are the “Old Population” components versus radius for subsamples at and . The PCA values, weights and uncertainties are calculated as before. While the cluster cores appear to be similarly dominated by old populations, a significant change in the fractional population gradient is seen between the two redshift bins. At lower redshift, the old population appears to dominate to larger radii, whereas at higher redshifts, the field-like galaxies are more noticeable in the inner portions of the cluster, though they still avoid the central core. This steepening of the population gradient can be thought of as a more detailed restatement of the Butcher-Oemler effect. Note that redefining the Butcher-Oemler effect in terms of gradients immediately explains the changes in the apparent blue fraction measures shown in Figures 1a and 1c, where the counting radius was changed. It also explains why some studies which have focused on the cluster cores have found very little evidence for population evolution.
A rough comparison of these results with those from previous measures of galaxy cluster populations can be made by equating our “Old Population” with the summed fractions of E and S0 galaxies from morphological studies and assuming that Mpc for clusters in other surveys. Values inferred from Figure 7 of Dressler et al. (1997) for the subset of “regular” clusters from the MORPHS sample are plotted with a dashed line on Figure 7, and suggest that the PCA population gradient in the higher redshift bin are generally in agreement with other clusters at similar redshifts. Interestingly, our lower redshift bin, with a mean redshift of , appears to be very close to the values inferred by the morphological gradients derived by Whitmore, Gilmore & Jones (1993). The dotted line on Figure 7 shows an estimate of the population gradients from their low redshift sample. While care must be taken in comparing spectral and morphological quantities, it appears that the PCA gradients are generally in agreement with other measures of galaxy type, and also suggest that the evolution in the gradients tapers off at .
5 Luminosity Density Profiles
Luminosity surface density profiles for each PCA component were constructed from the total galaxy luminosity surface density distribution and the PCA fractional gradients shown in Figure 6a. Figure 8 shows the profiles for the transformed PCA coordinates described above. The fractional gradients seen in Figure 6 are shown here as relative light distributions which increase in spatial extent from older to younger stellar populations. This is quite consistent with what is expected from the accretion of field galaxies into the cluster, where galaxies which fell into the cluster at earlier times and whose stellar populations have longest felt the effects of the cluster environment will have a more concentrated spatial distribution than those that are only now entering the cluster for the first time. We note that the “Field-like” and “PSF” populations are most similar in shape, suggesting that much of the older population significantly predates the introduction of these younger galaxies to the cluster.
In Figure 9 we illustrate a possible explanation for the evolution in cluster populations and population gradients in clusters by constructing luminosity profiles as a function of cluster redshift. Figure 9a shows the relative luminosity surface density for the “Old Population” component for and . The two curves are nearly identical in both shape and normalization. Note that the normalization for all curves in Figures 8, 9a and 9b is identical – since the weights for each galaxy are normalized by the cluster richness, as measured by Bgc, the possible observational selection effect that the higher redshift bins contain somewhat richer clusters on average is removed. Plotting the distributions as a function of rather than a fixed metric radius normalizes each galaxy position in terms of cosmological overdensity at the cluster redshift. It appears that the old population, which presumably includes both galaxies which were formed early in the cluster’s history, as well as galaxies which have been spectroscopically transformed after falling into the cluster environment, has not changed in shape significantly relative to over this timescale, This is in agreement with the idea that these galaxies have resided in the cluster for several billion years and are in a stable dynamical equilibrium.
Figure 9b shows the sum of the “Field-like” and “Post-Star-Formation” light profiles, representing galaxies which are newer introductions to the cluster potential. The two components were summed in part to slightly increase the signal-to-noise ratio and also to represent more closely the light from “Butcher-Oemler” galaxies, which are often taken as the mixture of both star forming and KA galaxies. Summing two of the three components also minimizes possible complications from the PCA coordinate transformations, since the cluster populations are now divided into two nearly-normal components, with a systematic uncertainty from PCA coordinate definitions of only about 1%. These curves are normalized identically to those in Figure 9a; note that the core densities are lower by about a factor of 8 and the curves are more extended, relative to the “Old Population.” Also, unlike the “Old Population”, the young stellar populations show significant evolution over the redshifts observed. Qualitatively, the two curves appear to have similar shapes outside of the cluster core, but the lower redshift curve has an amplitude about a factor of three lower than the higher redshift curve. Thus the Butcher-Oemler effect appears to be caused by a decrease in the density of a young stellar population which has the same overall spatial extent relative to at these redshifts.
6 Discussion
6.1 The Infall of Field Galaxies into Clusters
The results from composite radial distributions of galaxy populations are consistent with a simple model of cluster formation and evolution. It appears that the cluster can be modeled as the sum of two components: a virilized component of older galaxies, and a younger component which, while it is probably in quasi-equilibrium with the cluster potential (Carlberg et al. 1997a), has fallen in more recently and which may eventually be expected to transform both spectrally and dynamically to blend with the older population. Galaxies in the midst of this transformation (e.g., KA galaxies, or the “PSF” PCA component) appear to inhabit an intermediate spatial distribution.
The origin of the young and intermediate-age components – identified with the “Butcher-Oemler galaxies” – may be constrained by tracing their spatial luminosity distribution as a function of redshift. Over the redshift range sampled here, we find that outside the core region ( 0.25 ) the shape of the young population luminosity distribution appears to be unchanging. This strongly suggests that dynamical state of galaxies (i.e., time since entry to the cluster potential) and age of their stellar populations are fundamentally linked. This is a reasonable assumption if the mechanism which transformed the population is due to the cluster environment. The main difference in these curves is then a simple vertical shift, and these results can thus be interpreted as a straightforward decline in the infall rate of new galaxies into the cluster. In this scenario, galaxy population changes can be used as a direct measure of cluster growth rates. This explanation for galaxy population evolution was also suggested by Kauffmann (1995), who modeled cluster populations according to a recipe for hierarchical clusters in a CDM universe, and Abraham et al. (1996), who modeled the morphological gradients in the CNOC1 cluster Abell 2390 as a function of cluster infall.
The young, field-like component comprises about 15% of the galaxy light within for our higher redshift subsample. The difference in mass-to-light ratios between the “Field-like” and “Old Population” stars can be estimated from the relative flux at Å in population synthesis models for a galaxy with ongoing star formation versus a passively evolving population (e.g., Charlot & Bruzual 1993). The mass-to-light ratio of the “Old Population” should be about 2.5 times that of the “Field-like” population, implying that about 6% of the stellar mass in the cluster has recently fallen into the cluster at an observed epoch of . Thus, the Butcher-Oemler effect illustrates the sensitivity of galaxy populations in tracing even a very small fraction of infall into the cluster.
Figure 9 further suggests that the infall rate has declined further by a factor of by . However, calibrating this result to absolute infall rates and linking it to cosmological models remain uncertain because of the unknown timescales of both virialization and population evolution in these environments. For example, the mechanism which affects ongoing star formation in clusters might operate quite gradually, as may be indicated by the relatively weak Balmer line strengths. If this is the case, the “Field-like” galaxies we see in the cluster may have been introduced to the cluster a billion or more years earlier than the observed epoch. That the blue galaxies are seen to be in equilibrium with the same mass potential as the red galaxies (Carlberg et al. 1997a) also suggests that they may remain in the cluster for several crossing times before undergoing a significant spectral transformation. In addition, the spectral transformation can be expected to take 1–3 billion years, even if star formation is terminated abruptly.
The ratio of the “Field-like” to “PSF” components in Figure 8 places rough limits on the maximum length of the delay between galaxy infall and the cessation of star formation. The observed ratio in the light densities of about 4 implies a ratio of 2–3 in the mass densities, since the mass-to-light ratio of the “Field-like” population will be less than that of the more evolved “PSF” population. The “PSF” population is relatively short lived, with a duration of about 1 Gyr. Thus, in the case of a constant infall rate, the “Field-like” population can endure the cluster environment for 2-3 Gyr. For a declining infall rate, this value is an upper limit. Estimates of this timescale were also found to be on the order of a few Gyr by Poggianti et al. (1999) and Balogh et al. (2000). The observed epochs of our redshift subsamples are at and ; a conservative estimate of a 1.5 billion year delay between infall and the post-star formation phase of the spectral transformation would place the epoch of infall corresponding to the observations at and , for the lower and higher redshift bins, respectively (= 75 km s-1 Mpc-1, =0.5). Note that this assumes that star formation is terminated almost instantaneously upon a galaxy’s entry into the cluster. A larger delay of 3 Gyr places the infall for our larger observed redshift bin at .
The very tentative agreement between our spectroscopic gradient and the morphological gradients from (Whitmore et al. 1993) also suggest that cluster infall is very rapidly decreasing during intermediate redshifts and perhaps is coming to a steady state by our lower redshift bin, corresponding to . This is qualitatively in agreement with evidence that the cluster X-ray luminosity function has not evolved strongly since ( e.g., Henry et al. 992; Rosati et al. 1998; Vikhlinin et al. 1998), and low-density cosmological models which place most of cluster formation at . Expanding the study of population gradients to both higher and lower redshifts, and combining the results with analytic and N-body results for cluster growth will be a topic of further investigation.
6.2 Other Scenarios for Galaxy Evolution in Clusters
An alternate viewpoint to a declining infall rate is that some physical property of the cluster environs has evolved over these timescales, driving the observed evolution in the populations. Possibilities include differing rates or efficiencies of galaxy-galaxy interactions, evolving gas densities in the cluster, which would affect the efficiency of ram-pressure stripping of gas from infalling galaxies, and the evolution of the infalling field population (Lavery & Henry 1988; Dressler & Gunn 1993; Moore et al. 1996; Fujita 1998). We have already removed the primary effect of field galaxy evolution by constructing vector components which are based on the observed field population at the same magnitudes and redshifts as the clusters.
Global evolution in the hot intra-cluster medium is also probably not a strong driving force in the observed evolution. All of the clusters in our sample are luminous X-ray clusters, and there does not appear to be a strong correlation between the X-ray gas density and the galaxy populations. Figure 10 shows the “Old Population” component for 8 clusters versus azimuthally averaged X-ray gas density, each measured at 0.5 from the cluster core. The gas density measurements are based on the ROSAT/ASCA observations from Lewis et al. (1999). While there is some variation in each parameter, they do not appear positively correlated, as would be expected if gas density evolution were driving the overall population changes. (Note that gas stripping may still be responsible for the transformation of individual galaxies, while an independent, cosmologically changing condition drives the population evolution.) The baryon fractions in these clusters also do not show a strong correlation with redshift (Lewis et al. 1999), further suggesting that the Butcher-Oemler effect is not directly linked to an evolving intra-cluster medium.
Changing rates of efficiencies of galaxy-galaxy interactions remain a possible mechanism for galaxy evolution in clusters, although morphological evidence for this remains mixed (e.g., Oemler et al. 1997). Since the effects of cluster richness and dynamics are normalized in this analysis, any evolutionary effect must come from either a cosmological change in the clustering of galaxies as they fall into the cluster (i.e., a declining rate of infalling pairs or small groups which might inhabit the regions near clusters) or in the ability of galaxies to continue to form stars in the wake of a collision. A more detailed analysis of statistical interaction rates in these clusters is underway.
A common property of these scenarios is that either more favorable environmental conditions or a higher resiliency of the infalling field galaxies result in star formation in infalling galaxies persisting for a longer time within the high redshift cluster environment. This general scenario of a longer interval before a galaxy completes its spectral transformation can be contrasted against the alternative scenario of changing infall rates, and the observed trend in the fractional population gradients can be used to constrain them. As discussed above, the observed gradients are qualitatively in agreement with the scenario that changing infall rates drive the observed evolution. A key feature of the infall model is that most of the additional blue galaxies seen at higher redshift are linked with a newly infalling population with an extended spatial distribution. Thus the Butcher-Oemler effect is greater when a larger counting radius is used and the cluster core is changing relatively slowly.
In the changing-timescale scenario, the excess blue galaxies seen at higher redshift are galaxies which are persisting in their star formation despite the fact that they fell into the cluster long ago. Thus we would expect to see that the major evidence for evolution would be that the “Field-like” population would have a more concentrated spatial distribution relative to (i.e., more like the “Old Population”) at higher redshifts. In terms of population gradients, this will tend to create gradients which manifest the Butcher-Oemler effect via additional blue galaxies in the inner parts of the clusters. Thus, the gradients would tend to become flatter at higher redshift, with the strongest evolution in the core region due to the dynamically old but spectroscopically unevolved population. Figures 7 and 9 cannot definitively rule out this possibility, as the strength of such an effect is based on the details of both cluster and galaxy formation, as well as the exact mechanism that truncates star formation in the cluster environment. However, the data appear to be more consistent with a simple infall model rather than with a simple model of increasing the length of time galaxies can persist in forming stars in the cluster environment.
6.3 How Representative are Current Cluster Samples?
While some of the discrepancies in measurements of the Butcher-Oemler effect can be explained by differing observational and analysis techniques, there appear to be significant differences in the average properties of different cluster samples. In particular, the CNOC1 X-ray selected sample appears to have a significantly lower fraction of both star forming and post-star forming galaxies than the optically-selected MORPHS sample (B99; this work). This difference most likely springs from the two different ways in which the samples were collected. The MORPHS sample for many years comprised the only sample of rich clusters at and is a heterogeneous collection of optically and AGN-selected clusters. They span a fairly wide range of richnesses, and in some cases the richness or cluster mass is still not well-determined; overestimating the mass because of velocity structures in a merging cluster may be a concern. Morphologically they also span a range of types, including both centrally concentrated and diffuse clusters and it is not clear how well they represent the cluster population as a whole.
The CNOC1 cluster samples were chosen primarily from the Einstein Medium Deep Survey (EMSS; Gioia et al. 1990, Gioia & Luppino 1994) X-ray sample, with the addition of the rich cluster Abell 2390. Both optical and X-ray morphologies show that these clusters are on average very smooth and regular. This is not surprising, as the X-ray selection technique is most sensitive to the high gas densities in the cores of centrally concentrated clusters. In addition, the central luminosity peaks from cooling flows can make less-massive high redshift clusters much more visible to X-ray surveys: nearly half of the CNOC1 clusters are cooling flow clusters. As cooling flows may be associated with clusters which have not had a major merging event in the recent past (e.g., Allen 1998), this may strengthen the tendency towards regular clusters. Hence, selection technique may predispose the CNOC1 sample, and very luminous X-ray clusters in general, to appear to be more quiescent than other samples, and our implied infall rates may actually be lower limits to the actual growth of cluster structures.
These systematic differences in the cluster samples may be responsible for the differing fraction of post-starburst galaxies seen in the MORPHS and CNOC1 samples, if the starburst phenomenon is associated with the infall of small groups into the cluster potential. Starbursts may be commonly induced by galaxy interactions, which in turn are more frequently found in the low velocity dispersion environments of small groups. If the luminous X-ray clusters which dominate the CNOC/EMSS sample have not absorbed a significant subclump of galaxies within the previous 1.5 or more Gyr, they are not likely to contain a significant fraction of galaxies with post-starburst spectra. A number of new surveys for high redshift clusters are amassing large numbers of both fainter X-ray clusters and optically-selected clusters (e.g., Zaritsky et al. 1997; Holden et al. 1999; Scharf et al. 1996; Rosati et al. 1998; Kim et al. 1999; Lewis, Stocke & Ellingson 1999; Gladders & Yee 2000). These should soon allow galaxy population studies for complete samples of clusters which are truly representative of the cluster population at a chosen redshift, and provide enough variation in cluster type to investigate the dependence of population on the clusters’ recent merging histories.
7 Summary and Conclusions
We have investigated the Butcher-Oemler effect in a sample of 15 rich galaxy clusters at from the CNOC1 cluster survey. A classical measurement of the cluster blue fraction, based on spectroscopically confirmed cluster members, shows a significant Butcher-Oemler effect, in that high redshift clusters have a larger fraction of star forming galaxies. These galaxies are found primarily outside of the cluster cores, and the Butcher-Oemler effect virtually disappears when a counting radius of only 0.5 is used.
We have developed an alternative method of measuring stellar populations in galaxies via a principal component analysis (PCA) of galaxy spectra. Basis vectors defined from the low-redshift LCRS spectral database were used to decompose cluster galaxy spectra into three components, corresponding to an old, passively evolving population, a young population matched to the coeval field, and a population of intermediate age, matched to a 0.5 Gyr post-star formation population. These components are shown to be robust measurements of stellar populations by comparison with low redshift galaxy spectra and classical line indices. However, unlike line indices, PCA components directly measure the fraction of light emitted by a given population, allowing for straightforward construction of population fractions and spatial distributions.
Composite population gradients show a smooth transition from the infalling field galaxy population to the older populations seen in the inner regions. The gradients are corrected for the evolution of the field population and cluster richness and show no evidence for an excess of star formation in the cluster; the cluster environment therefore appears to have the monotonic effect of decreasing star formation in infalling galaxies. However, there is evidence for a small excess of intermediate age stars, mostly located in galaxies with mixed stellar populations. This suggests that star formation in these galaxies has been truncated gradually, without an accompanying strong starburst.
Evolution in the cluster galaxy population between and 0.2 is manifest in a flattening of the fractional population gradient at later epochs, while the cluster cores remain dominated by an old, red population. Luminosity surface brightness distributions indicate that the old stellar population has a centrally concentrated, unchanging spatial extent as a function of . Younger galaxy populations have a more extended distribution that also retains its general shape but appears to be decreasing by about a factor of three in amplitude between and . This phenomenon is most consistent with scenarios where the mechanism which truncates star formation in individual galaxies remains constant, but the cluster population evolution is driven by a declining rate of infall into the clusters. Depending on the length of time that star formation in galaxies can survive the cluster environment, this may indicate a change in the infall rates into clusters between and ; if galaxies reside in the cluster for a significant interval before ceasing star formation, the evolution will correspond to even earlier epochs. We note that the stellar mass fraction of young populations in these clusters is on the order of a only few percent, despite the fact that it requires several Gyr to transform stellar populations from young to old populations. This also suggests that the Butcher-Oemler effect as seen at intermediate redshifts is a lingering echo of more rapid cluster formation which occurred much earlier, in qualitative agreement with low-density cosmological models. Additional N-body and analytical modeling is necessary to firmly link the observed evolution in population gradients to models of cluster formation and growth.
These results indicate that galaxy populations provide a very sensitive probe of cluster growth, and that the construction of spatial distributions for different galaxy populations may illuminate both cluster and galaxy evolution. Extending similar studies to both higher and lower redshifts is critical towards building a consistent picture of cluster evolution. However, the best studied samples at intermediate and high redshifts may not be representative of the cluster population, as both X-ray and optically selected samples may introduce systematic biases in the dynamical state and formation history of the clusters. As the populations seen in individual clusters may be strongly affected by the recent merging history of the cluster, it is important that a wide variety of cluster types be sampled in order to build a truly representative sample. A new generation of high redshift cluster samples based on algorithms which are sensitive to low surface brightness and newly merging cluster structures is necessary to expand and clarify our picture of the formation of galaxy clusters and the effects of environment on galaxy evolution.
References
- (1)
- (2) Abraham, R. G., et al. 1996, ApJ, 471, 694
- (3)
- (4) Allen, S. W. 1998, MNRAS, 296, 392
- (5)
- (6) Andreon, S. 1998, ApJ, 501, 533
- (7)
- (8) Andreon, S., & Ettori, S. 1999, ApJ, 516, 64
- (9)
- (10) Balogh, M. L., Morris, S. L., Yee, H. K. C., Carlberg, R. G., & Ellingson, E. 1997, ApJ, 488, L75
- (11)
- (12) Balogh, M. L., Schade, D., Morris, S. L., Yee, H., K. C., Carlberg, R. G., & Ellingson, E. 1998, ApJ, 504, L7
- (13)
- (14) Balogh, M. L.; Morris, S. L.; Yee, H. K. C.; Carlberg, R. G.; Ellingson, E. 1999, ApJ, 527, 54 [B99]
- (15)
- (16) Balogh, M., L., Navarro. J., & Morris, S. L., 2000, ApJ, in press
- (17)
- (18) Barger, A. J., Aragon-Salamanca, A., Ellis, R. S., Couch, W. J., Smail, I., & Sharples, R. M. 1996, MNRAS, 279, 1
- (19)
- (20) Barger, A. J., et al. 1998, ApJ, 501, 522
- (21)
- (22) Bower, R. G., Lucey, J. R., & Ellis, R. S. 1992, MNRAS, 254, 601
- (23)
- (24) Bromley, B. C., Press, W. H., Lin, H., & Kirshner, R. P. 1998, ApJ, 505, 25
- (25)
- (26) Bruzual, G. A., & Charlot, S. 1993, ApJ, 405, 538
- (27)
- (28) Butcher, H., & Oemler, A., Jr. 1978 ApJ, 219, 18
- (29)
- (30) Butcher, H., & Oemler, A., Jr. 1984, ApJ, 285, 426
- (31)
- (32) Carlberg, R. G., Yee, H. K. C., & Ellingson, E. 1997, ApJ, 478, 462 (CYE)
- (33)
- (34) Carlberg, R. G., Yee, H. K. C., Ellingson, E., Abraham, R., Gravel, P., Morris, S., & Pritchet, C. J. 1996, ApJ, 462, 32
- (35)
- (36) Carlberg, R.G., et al. 1997a, ApJL, 476, L7
- (37)
- (38) Carlberg, R.G., et al. 1997b, ApJL, 485, L13
- (39)
- (40) Coleman, G. D., Wu, C., & Weedman, D. W. 1980, ApJS, 43, 393
- (41)
- (42) Connolly, A. J., Csabai, I., Szalay, A. S., Koo, D. C., Kron, R. G., & Munn, J. A. 1995, AJ, 110, 2655
- (43)
- (44) Couch, W. J., Barger, A. J., Smail, I., Ellis, R. S., & Sharples, R. M. 1998, ApJ, 497, 18
- (45)
- (46) Couch, W. J., Ellis, R. S., Sharples, R. M., & Smail, I. 1994, ApJ, 430, 121
- (47)
- (48) Couch, W. J., & Sharples, R. M. 1987, MNRAS, 229, 423
- (49)
- (50) Dressler, A., & Gunn, J. E. 1982, ApJ, 263, 533
- (51)
- (52) Dressler, A., & Gunn, J. E. 1983, ApJ, 270, 7
- (53)
- (54) Dressler, A., & Gunn, J. E. 1992, ApJS, 78, 1
- (55)
- (56) Dressler, A., Oemler, A., Jr., Butcher, H. R., & Gunn, J. E. 1994, ApJ, 430, 107
- (57)
- (58) Dressler, A., et al. 1997, ApJ, 490, 577
- (59)
- (60) Dressler, A., Smail, I., Poggianti, B. M., Butcher, H., Couch, W. J., Ellis, R.S., & Oemler, A., Jr. 1999, ApJS, 122, 51
- (61)
- (62) Ellingson, E., Yee, H. K. C., Abraham, R. G., Morris, S. L., Carlberg, R.G. 1998, ApJS, 116, 247
- (63)
- (64) Ellis, R. S., Smail, I., Dressler, A., Couch, W. J., Oemler, A. Jr., Butcher, H., Sharples, R. M. 1997, ApJ, 483, 582
- (65)
- (66) Fabricant, D. G., McClintock, J. E., & Bautz, M. W. 1991, ApJ, 381, 33
- (67)
- (68) Folkes, S., et al. 1999, MNRAS, 308, 459
- (69)
- (70) Fujita, Y. 1998, ApJ, 509, 587
- (71)
- (72) Gioia, I. M., Maccacaro, T., Schild, R. E., Wolter, A., & Stocke, J. T. 1990, ApJS, 72, 567
- (73)
- (74) Gioia, I. M., & Luppino, G. A. 1994, ApJS, 94, 583
- (75)
- (76) Gladders, M.G., López-Cruz, O., Yee, H.K.C., & Kodama, A. 1998, ApJ, 501, 571
- (77)
- (78) Gladders, M. G. & Yee, H. K. C. 2000, AJ, in press (astro-ph/0004092)
- (79)
- (80) Gott, J. R., & Gunn, J. 1972, ApJ, 176, 1
- (81)
- (82) Henry, J. P., et al. 1992, ApJ, 386, 408
- (83)
- (84) Holden, B. P., Nichol, R. C., Romer, A. K., Metevier, A., Postman, M., Ulmer, M. P. & Lubin, L. M. 1999, AJ, 118, 2002
- (85)
- (86) Jones, L., Smail, I. & Couch, J. W. 2000, ApJ, 528, 118
- (87)
- (88) Kauffmann, G. 1995, MNRAS, 274, 153
- (89)
- (90) Kim, R. S. et al. 1999, BAAS, 195, 3003
- (91)
- (92) Kelson, D. D., et al. 2000, ApJ, 529, 768
- (93)
- (94) Kennicutt, R. C., Jr 1992, ApJS, 79, 255
- (95)
- (96) Lavery, R. J., & Henry, J. P. 1986, ApJ, 304, L5
- (97)
- (98) Lavery, R. J., & Henry, J. P. 1988, ApJ, 330, 596
- (99)
- (100) Lewis, A. D., Ellingson, E., Morris, S. L., & Carlberg, R. G. 1999, ApJ, 517, 587
- (101)
- (102) Lewis, A. D., Stocke, J. T., & Ellingson, E. 1999, BAAS 194, 8904
- (103)
- (104) Moore, B., Katz, N., Lake, G., Dressler, A., & Oemler, A. 1996, Nature, 379, 613
- (105)
- (106) Morris, S. L., Hutchings, J. B., Carlberg, R. G., Yee, H. K. C., Ellingson, E., Balogh, M. L., Abraham, R. G., & Smecker-Hane, T. A. 1998, ApJ, 507, 84
- (107)
- (108) Oemler, A., Jr., Dressler, A., & Butcher, H. 1997, ApJ, 474, 561
- (109)
- (110) Poggianti, B. M., Smail, I., Dressler, A., Couch, W. J., Barger, A. J., Butcher, H., Ellis, R. S., & Oemler, A. 1999, ApJ, 518, 576
- (111)
- (112) Press, W. H., Teukolsky, S. A., Vetterling, W. T., & Flannery, B. P. 1992, Numerical Recipes (Cambridge: Cambridge University Press)
- (113)
- (114) Rosati, P., Della Ceca, R., Norman, C., & Giacconi, R. 1998, ApJ, 492, L21
- (115)
- (116) Scharf, C. A., Jones, L. R., Ebeling, H., Perlman, E., Malkan, M., & Wegner, G. 1997, ApJ, 477, 79
- (117)
- (118) Shectman, S. A., Landy, S., D., Oemler, A., Tucker, D. L., Lin, H., Kirschner, R. P. & Schechter, P. L., 1996, ApJ, 470, 172
- (119)
- (120) Smail, I., Dressler, A., Couch, W. J., Ellis, R. S., Oemler, A., Butcher, H., & Sharples, R. M. 1997, ApJS, 110, 213
- (121)
- (122) Smail, I., Edge, A. C. Ellis, R. S. & Blandford, R. D. 1998, MNRAS, 293, 124
- (123)
- (124) van Dokkum, P. G., Franx, M., Kelson, D. D., & Illingworth, G. D. 1998, ApJ, 504, L17
- (125)
- (126) Vikhlinin, A., McNamara, B., Forman, W., Jones, C., & Quintana, H. 1998, ApJ, 498, L21
- (127)
- (128) Whitmore, B. C., Gilmore, D. M., & Jones, C. 1993, ApJ, 407, 489
- (129)
- (130) Yee, H. K. C., Ellingson, E., & Carlberg, R. G. 1996, ApJS, 102, 269
- (131)
- (132) Yee, H. K. C. & López-Cruz, O. 1999, AJ, 117, 1985
- (133)
- (134) Yee, H. K. C., et al. 2000, ApJS, 130, in press (astro-ph/000426)
- (135)
- (136) Zaritsky, D. Zabludoff, A. I., & Willick, J. A. 1995, AJ, 110, 1602
- (137)
- (138) Zaritsky, D. Nelson, A. E., Dalcanton, J. J., & Gonzalez, A.H. 1997, ApJ, 480, 91
- (139)
| New component Axis | Elliptical | Emission | Balmer | |
|---|---|---|---|---|
| Old Population | 0.77 | 0.03 | 0.20 | |
| Field-like | =0.25 | 0.32 | 0.39 | 0.29 |
| 0.35 | 0.28 | 0.46 | 0.26 | |
| 0.45 | 0.22 | 0.51 | 0.26 | |
| 0.55 | 0.22 | 0.52 | 0.26 | |
| Post Star Formation (PSF) | 0.10 | 0.05 | 0.85 |