Complex Phase Lag Behaviors of the 0.5 – 10 Hz QPOs in GRS 1915+105
Abstract
Through studying the hard lags between the soft (3.3 – 5.8 keV) and hard (13.0 – 41.0 keV) photons of the 0.5 – 10 Hz QPOs in GRS 1915+105, we have classified them into three types: 0.5 – 2.0 Hz QPOs, 2.0 – 4.5 Hz QPOs, and 4.5 – 10 Hz QPOs. They are closely related to different temporal and spectral states. The first type of QPOs (0.5 – 2 Hz) have positive hard lags at both the QPO fundamental and first harmonic frequencies. These QPOs were observed in the quiescent soft state. The second type of QPOs (2 – 4.5 Hz), which were also detected in the quiescent soft state, have opposite signs of hard lags at the QPO fundamental and first harmonic frequencies. The third type (4.5 – 10 Hz), which showed up in medium soft quiescent/out-burst states, do not have significant higher harmonic peaks. There is a smooth transition between these three types of QPO behaviors. We did not detect 0.5 – 10 Hz QPOs in the very soft state. We discuss some of the implications of these results.
1 Introduction
The superluminal source GRS 1915+105 displays a rich diversity of lightcurve morphology, power density spectrum (PDS), quasi-periodic oscillations (QPOs), phase lags, and coherence. The lightcurve morphology varies from out-burst to intermittent out-burst, to quiescence (e.g. Belloni et al. 1997, 2000). The PDS shape can be either a broken power law with a flat top or a simple power law (Morgan, Remillard, & Greiner 1997). The QPO fundamental frequency ranges from mHz to 67 Hz (e.g. Morgan, Remillard, & Greiner 1997), and some QPOs were detected up to the third harmonic (Cui 1999).
Several studies have related the temporal behaviors with the spectral properties. For example, using the standard disk blackbody and power law model, Muno, Morgan, & Remillard (1999) found that the 0.5 – 10 Hz QPO frequency increases as the inner-disk color temperature increases from 0.7 to 1.5 keV. Chen, Swank, & Taam (1997) showed that the hardness ratio between the energy bands 11 – 30.5 keV and 2 – 11 keV is a good indicator for the presence of two types of QPOs. When this hardness ratio is above 0.1, GRS 1915+105 exhibited narrow 0.5 - 6 Hz QPOs. Broad QPOs or no QPO were observed when this hardness ratio is below 0.1. According to Markwardt, Swank, & Taam (1999), the 1 – 15 Hz QPOs were present when the power-law component became hard and intense, but the QPO frequency is correlated with the parameters of the thermal component. In these studies, the 0.5 – 10 Hz QPOs were treated as a single type of QPOs. However, our studies of the phase lag behaviors of the 0.5 – 10 Hz QPOs indicate that there are three types of 0.5 – 10 Hz QPO behaviors which can be classified according to the QPO frequency: 0.5 – 2.0 Hz, 2.0 – 4.5 Hz, and 4.5 – 10 Hz.
Complex phase lag (or hard lag) behaviors have been observed in the 3 – 12 Hz QPOs of XTE J1550–564 (Wijnands, Homan, & van der Klis 1999) and in the 66.8 mHz QPO of GRS 1915+105 (Cui 1999). Wijnands, Homan, & van der Klis (1999) found two types of 3 – 12 Hz QPOs in XTE J1550–564. The first type of QPOs have a broad QPO peak with a QPO frequency of 6 Hz. The hard lags of this type of QPOs are negative at both the fundamental and first harmonic frequencies. The second type of QPOs, which have narrow peaks and a fundamental peak frequency of 3 Hz, switch signs for the hard lags at the different harmonic frequencies. Similarly, Cui (1999) found that the hard lags of the 66.8 mHz QPO in GRS 1915+105 alternate from negative to positive values as the frequency increases from the fundamental to higher harmonic frequencies.
In this letter, we show the different phase lag behaviors of 0.5 – 10 Hz QPOs in 20 Rossi X-ray Timing Explorer (RXTE) observations of GRS 1915+105. We find that the phase lag behaviors are closely related to the QPO fundamental frequency and the spectral states. In section 2, we describe how the data were analyzed. In section 3, the analysis results are presented. In the last section, we discuss the implications of these results.
2 Data Reduction
To examine the phase lag behaviors, we selected the observations published in Morgan, Remillard, & Greiner (1997) that showed QPOs in the frequency range of 0.5 – 10 Hz. We also picked several other observations in late 1996 and 1997 which cover a big dip in the All Sky Monitor (ASM) light curve of GRS 1915+105. A full list of the observations is given in Table 1. The radio fluxes at the times of some of these observations are given in Pooley & Fender (1997) and Fender et al. (1999).
We extracted light curves using three energy bands, 3.3 – 5.8 keV, 5.8 – 13.1 keV, and 13.1 – 41.0 keV. The channels in the energy range of 2.5 – 3.3 keV were not used, because they have been binned together with the channels below 2.5 keV in the archival high time resolution data. The counts were summed into time bins of 7.8125 ms, and timing analyses were performed on intervals of 256 seconds.
The timing analyses included calculations of power density spectra and cross-spectra. In order to attenuate noise, we averaged the power spectra and cross-spectra over all observation intervals. In displaying the power density spectra, we used the Leahy normalization (Leahy et al. 1983) without subtracting white noise. Phase lags and coherence between signals at two different energy channels were obtained from the cross-spectra. We used Monte Carlo simulations to estimate the phase lag errors from the cross spectra. In the simulations, we assumed that the values of the real and imaginary parts had normal distributions, and used the fact that the cross-spectrum is a linear function of detector count rates.
We classified the GRS 1915+105 lightcurve profiles into two general states. One is the “quiescent” state in which the count rates on the 1-s time resolution lightcurves vary by less than 20% of the average count rates and there are no spikes wider than 10 seconds. The other is the “out-burst” or “flaring” state which has spikes wider than 10 seconds and count rates varying by more than 20% of the average value, but does not have large scale structures in the light curves. Belloni et al. (2000) classified the observations of GRS1915+105 into 12 classes (hereafter Belloni classes), based on their count rate and hardness characteristicsi. Our “quiescent” state corresponds to Belloni classes and , and the “flaring” state includes classes , , and .
We used a simple power law model plus interstellar absorption to fit the photon spectra in the energy range of 2.5 – 40 keV. Though this simple model does not give good fits to the data, the photon power-law index is a good indicator of the spectral hardness. We defined three spectral states: soft state ( = 2.0 – 3.0), medium soft state ( = 3.0 – 4.0), and very soft state ().
3 Analysis Results
The results are summarized in Table 1. The observations are listed in the increasing order of the QPO fundamental frequency. Three types of hard lag behaviors were found in the observations. The hard lags at the fundamental and first harmonic frequencies are both positive when the fundamental frequency is low. When the fundamental frequency increases above 2 Hz but below 4.5 Hz, the hard lags become negative at the fundamental frequency but stay positive at the first harmonic frequency. When the fundamental frequency moves to even higher values, no significant first harmonic peak can be detected. While there is a smooth transition between these behaviors, to highlight their differences we describe the three types separately in the following sub-sections.
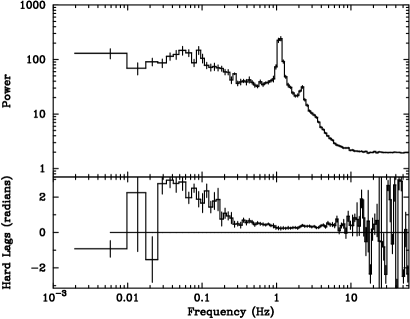
3.1 0.5 – 2 Hz QPOs
Figure 1 shows an example of the 0.5 – 2 Hz QPOs and the hard lags between the two energy bands (3.3 – 5.8 keV and 13.1 – 41.0 keV). Both the fundamental and first harmonic peaks are significantly detected. The hard lags at both peaks are positive and consistent with the values at the surrounding continuum frequencies. Among the four observations that detected the 0.5 - 2 Hz QPOs, the coherence between the two energy bands at the QPO fundamental frequency is 0.95 or 0.96, which is also consistent with the overall distribution of the coherence. The photon spectrum power-law index is in the range of 2.6 – 2.7, which indicates that GRS 1915+105 was in the soft state. As the QPO fundamental frequency increases, the hard lag at the fundamental frequency decreases while the the hard lag at the first harmonic frequency increases. The X-ray flux in the range of 3.3 – 13.1 keV was essentially the same among the four observations, and the source was in the “quiescent” state.
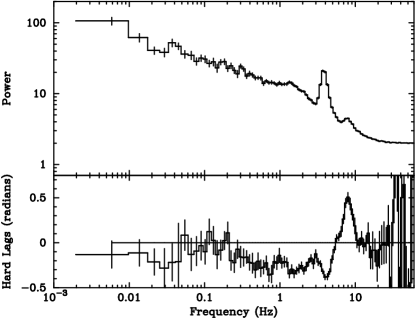
3.2 2.0 – 4.5 Hz QPOs
The 2.0 – 4.5 Hz QPOs have very peculiar phase lag behaviors (for example, see Figure 2). The hard lags are negative at the QPO fundamental frequency but turn positive at the first harmonic frequency. They significantly deviate from the overall trend in the hard lag distribution over frequencies. The photon power-law index is in the range of 2.5 – 3.0. Thus GRS 1915+105 was in the soft and quiescent state. Though the hard lags at the fundamental frequency appear to generally become more negative at higher fundamental frequencies, this trend is not as well defined as that for the 0.5 – 2.0 Hz QPOs. Among the nine observations that detected the 2 - 4.5 Hz QPOs, the total 3.3 – 13.1 keV X-ray flux varied by a factor of more than three, and had no apparent correlations with the QPO fundamental frequency. However, spectral analyses by Trudolyubov, Churazov, & Gilfanov (1999) showed that the fundamental frequency positively correlates with the flux of the soft blackbody component that was obtained by fitting the spectrum with the standard disk backbody plus an exponentially cutoff power law.
The coherence is generally high at the fundamental frequency (above 0.85) except for the observation on July 5th, 1997, which may be treated as a special case because the analysis was done on the quiescent segments of an intermittent out-burst state. The coherences in the intermittent out-burst state were significantly lower than the coherences in both the quiescent and flaring states. The implications of this need to be further investigated.
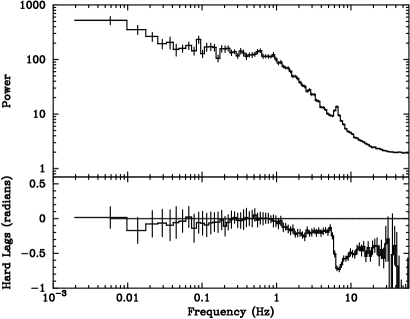
3.3 4.5 – 10.0 Hz QPOs
When the QPO frequency is above 4.5 Hz, the first harmonic QPO peak can not be significantly detected, and we do not see a change in the sign of the hard lags between the fundamental and where the first harmonic frequencies would be (for example, see Figure 3). The hard lags at both frequencies are negative. The coherence at the fundamental frequency between the two energy bands (3.3 – 5.8 keV and 13.1 – 41.0 keV) is lower than for the previous two types of QPOs. The source was in the medium soft state with a photon spectrum power law index of 3.1 – 3.4. Unlike the previous two types of QPO, 4.5 – 10 Hz QPOs can be present in both quiescent and out-bursting states. The 3.3 – 13.1 keV X-ray flux is also very diverse.
3.4 Epochs without 0.5 – 10.0 Hz QPOs
We have three observations that did not detect 0.5 – 10.0 Hz QPOs. One common feature among these observations is that the source was in the very soft state with a photon power-law index above 4.0 (Table 1). Similar results were also reported by Muno, Morgan, & Remillard (1999). Among the three observations, one has a PCA 3.3 – 13.1 keV count rate of 6889 counts/s, compared to 16800 and 24005 counts/s in the other two observations. Therefore, the source was not necessarily in the very high state even though the spectra were very soft.
4 Discussion
Through studying the hard lag behaviors of the 0.5 – 10 Hz QPOs, we have highlighted them into three types that are closely related to different temporal and spectral properties. The first type of QPOs (0.5 – 2 Hz) have positive hard lags at the fundamental and first harmonic frequencies and were observed in the quiescent soft state. The second type of QPOs (2 – 4.5 Hz) were also detected in the quiescent soft state but have opposite signs for the hard lags at the fundamental and first harmonic frequencies. The third type (4.5 - 10 Hz), which showed up in medium soft quiescent/out-burst states, do not have significant harmonic peaks. There is a general trend that the hard lags at the QPO fundamental frequency decrease from positive to negative values as the fundamental frequency moves from 0.66 Hz to higher values. We also found that the photon spectra become softer as the QPO fundamental frequency increases. After we presented this work to the 195th AAS meeting in Atlanta on January 14th, 2000, it was brought to our attention that a recent paper by Reig et al. (2000) also reported such trends in GRS 1915+105.
The opposite signs of the hard lags at the QPO fundamental and first harmonic frequencies do not necessarily mean that the photon arrival times are different at different QPO harmonic frequencies. For example, the Fourier transform of a decaying oscillating signal is:
| (1) | |||||
The power density has two QPO peaks at and respectively. For , the two dominant terms are:
| (2) |
So we have and . Therefore, , i.e. they have opposite signs for the phase term even though the oscillations have no time delays from each other. The two additional minor terms make the conclusion less obvious, but we still can find appropriate and to make the phase lags have opposite signs. Therefore, it may be misleading to interpret the phase lag at a particular QPO frequency as simply the time delay between two oscillating signals.
In the classic multi-color thermal disk models, the negative hard lags can be explained by assuming that perturbations propagate from the inner disk to the outer disk. The perturbations on the inner edge may come from the central object or from the magnetic fields that are being sucked into the central object. Zhang, Cui, & Chen (1997) and Cui, Zhang, & Chen (1998) suggested that GRS 1915+105 contains a black hole rapidly spinning in the same direction as the accretion disk. In such a prograde system, the last stable orbit is much smaller than the non-spinning system. Therefore, strong perturbations on the inner edge of the accretion disk are very likely. There may also be perturbations propagating inwards from the outer edge of the disk, which generate positive hard lags. When the disk inner edge is farther away from the central object and thus the QPO frequency is smaller, it is natural to assume that the perturbations on the inner edge is weaker. Therefore, the inward perturbations would dominate over the outward perturbations, and the hard lags are expected to be positive. This could explain why the lowest 0.5 – 2 Hz QPOs have positive hard lags while the faster ones have negative hard lags.
Taam, Chen, & Swank (1997) proposed that the out-bursts in GRS 1915+105 are due to the ejection of the inner disk. A direct prediction of this model is that the inner disk edge is farther away from the central object in the out-burst state than in the quiescent state. Our results may pose problems to this prediction. The observation made on July 5th, 1997, for example, had long out-burst and quiescent segments. We therefore performed separate timing analyses on the out-burst and quiescent segments. We found that the quiescent state has a lower QPO fundamental frequency than the out-burst state, and thus the disk inner edge should be closer to the central object in the out-burst state than in the quiescent state if we assume the QPO fundamental frequency is somehow related to the sound crossing time across the disk inner edge.
References
- (1)
- (2) Belloni, T., Méndez, M., King, A. R., van der Klis, M., & van Paradijs, J. 1997, ApJ, 488, L109
- (3)
- (4) Belloni, T., Klein-Wolt, M., Méndez, M., van der Klis, M., & van Paradijs, J. 2000, A&A, 355, 271
- (5)
- (6) Böttcher, M., & Liang, E. P. 1998, ApJ, 506, 281
- (7)
- (8) Böttcher, M., & Liang, E. P. 1999, ApJ, 511, L37
- (9)
- (10) Chen, X., Swank, J. H., & Taam, R. E. 1997, ApJ, 477, L41
- (11)
- (12) Cui, W., Zhang, S. N., Chen, W. 1998, ApJ, 492, L53
- (13)
- (14) Cui, W. 1999, ApJ, 524, L59
- (15)
- (16) Fender, R. P., et al. 1999, MNRAS, 304, 865
- (17)
- (18) Hua, X.-M., Kazanas, D., & Titarchuk, L. 1997, ApJ, 482, L57
- (19)
- (20) Leahy, D. A., Darbro, W., Elsner, R. F., Weisskopf, M. C., Kahn, S., Sutherland, P. G., & Grindlay, J. E. 1983, ApJ, 266, 160
- (21)
- (22) Lin, D., Smith, I. A., Böttcher, M., & Liang, E. P. 2000, ApJ, 531, 963
- (23)
- (24) Markwardt, C. B., Swank, J. H., & Taam, R. E. 1999, ApJ, 513, L37
- (25)
- (26) Morgan, E. H., Remillard, R. A., & Greiner, J. 1997, ApJ, 482, 993
- (27)
- (28) Muno, M. P., Morgan, E. H., & Remillard, R. A. 1999, ApJ, 527, 321
- (29)
- (30) Nowak, M. A., Vaughan, B. A., Wilms, J., Dove, J. B., Begelman, M. C. 1999, ApJ, 510, 874
- (31)
- (32) Pooley, G. G., & Fender, R. P. 1997, MNRAS, 292, 925
- (33)
- (34) Reig, P., Belloni, T., van der Klis, M., Méndez, M., Kylafis, N., Ford, E. C. 2000, submitted to ApJ, astro-ph0001134
- (35)
- (36) Taam, R. E., Chen, X., Swank, J. H. 1997, ApJ, 485, L83
- (37)
- (38) Trudolyubov, S. P., Churazov, E. M., & Gilfanov, M. R. 1999, Astronomy Letter, 25, 718
- (39)
- (40) van der Klis, M. 1995, in X-ray Binaries, ed. W. H. G. Lewin, J. van Paradijs, and E. P. J. van den Heuvel (Cambridge U. Press), 252
- (41)
- (42) Vaughan, B. A., & Nowak, M. A. 1997, ApJ, 474, L43
- (43)
- (44) Wijnands, R., Homan J., & van der Klis, M. 1999, ApJ, 526, L33
- (45)
- (46) Zhang, S. N., Cui, W., Chen, W. 1997, ApJ, 482, L155
- (47)
| bbThe QPO fundamental frequency (Hz). | ccWhether the first harmonic peak is present or not, ‘Y’ for yes, and ‘N’ for no. | ddThe hard lag at the fundamental frequency (in radians). ‘N/A’ means not applicable because no QPO is detected. | eeThe hard lag at the first harmonic frequency (in radians). ‘N/A’ means not applicable because no first harmonic peak is detected. | Cohn ffThe coherence value at the fundamental frequency. ‘N/A’ means not applicable because no QPO is detected. | ggThe photon spectrum power-law index. | PCA hhThe average PCA count rate in the range of 3.3 – 13.1 keV (Counts/s). | F/Q iiWhether the source is in the flaring state ‘F’ or in the quiescent state ‘Q’. | Date |
|---|---|---|---|---|---|---|---|---|
| Y | 0.95 | 2.6 | Q | 1996-07-26 | ||||
| Y | 0.96 | 2.6 | Q | 1996-08-03 | ||||
| Y | 0.95 | 2.7 | Q | 1996-07-19 | ||||
| Y | 0.95 | 2.7 | Q | 1996-08-10 | ||||
| Y | 0.95 | 2.9 | Q | 1996-07-16 | ||||
| Y | 0.92 | 2.8 | Q | 1997-10-08 | ||||
| Y | 0.88 | 2.6 | Q | 1997-02-22 | ||||
| Y | 0.88 | 2.6 | Q | 1996-10-29 | ||||
| Y | 0.19 | 2.6 | Q | 1997-07-05 jjThe observation was split into quiescent segments and out-burst segments. The timing analysis has been done separately on each type of segment. | ||||
| Y | 0.93 | 3.0 | Q | 1996-07-11 | ||||
| Y | 0.92 | 3.0 | Q | 1996-07-14 | ||||
| Y | 2.6 | Q | 1996-12-24 | |||||
| Y | 0.91 | 2.9 | Q | 1996-08-25 | ||||
| N | N/A | 0.88 | 3.1 | F | 1996-08-18 | |||
| kkA broad QPO peak. | N | N/A | 0.55 | 3.4 | F | 1997-07-07 | ||
| N | N/A | 0.65 | 3.2 | Q | 1996-08-31 | |||
| N | N/A | 0.12 | 3.1 | F | 1997-07-05 jjThe observation was split into quiescent segments and out-burst segments. The timing analysis has been done separately on each type of segment. | |||
| N | N/A | 0.68 | 3.4 | F | 1996-10-15 | |||
| No | N | N/A | N/A | N/A | 4.4 | F | 1996-06-29 | |
| No | N | N/A | N/A | N/A | 4.0 | Q | 1997-07-20 | |
| No | N | N/A | N/A | N/A | 4.0 | F | 1997-12-22 |