Envelope tomography of long-period variable stars††thanks: Based on observations made at Observatoire de Haute Provence, operated by the Centre National de la Recherche Scientifique, France
Abstract
This paper is the first one in a series devoted to the study of the dynamics of the atmospheres of long-period variable (LPV) stars. Results from a two-month-long monitoring of the Mira variables RT Cyg and X Oph around maximum light with the ELODIE spectrograph at the Haute-Provence Observatory are presented. The monitoring covers phases 0.80 to 1.16 for RT Cyg and phases 0.83 to 1.04 for X Oph. The cross-correlation profile of the spectrum of RT Cyg with a K0 III mask confirms that the absorption lines of RT Cyg in the optical domain appear double around maximum light. No line doubling was found in the optical spectrum of X Oph around maximum light, indicating that this feature is not common to all LPVs.
This paper also presents the application to RT Cyg of a new tomographic111The word tomography is used here in its etymological sense (‘display cuts’), which differs somewhat from the broader sense in use within the astronomical community (reconstruction of a structure using projections taken under different angles). technique deriving the velocity field across the atmosphere by cross-correlating the optical spectrum with numerical masks constructed from synthetic spectra and probing layers of increasing depths. This technique reveals that both the temporal evolution of the line doubling, and its variation with depth in the atmosphere of RT Cyg, are consistent with the ‘Schwarzschild scenario’. This scenario relates the temporal evolution of the red and blue peaks of the double absorption lines to the progression of a shock wave in the atmosphere.
The temporal evolution of the Balmer H, H, H and H emission lines around maximum light is also presented for RT Cyg and X Oph. The velocity variations of H and of the absorption lines are discussed in the framework of two competing models for the formation of Balmer emission lines in LPV stars.
Key Words.:
Stars: AGB and post-AGB – Stars: atmospheres – Stars: late-type – Stars: oscillations – Stars: variables: general – Shock waves1 Introduction
Long-period variable stars (LPVs) are cool giant stars showing more or less periodic light variations with amplitudes of several magnitudes in the visual and with periods of several hundred days. Depending on their visual amplitudes and on the regularity of their variability cycles, they appear in several flavours, namely Mira Ceti-type variables (Mira stars or Miras), Semi-Regular variables (of the SRa or SRb subtypes) or Irregular variables (of the Lb subtype). Mira and SR variables represent one of the latest stages in the evolution of stars with initial masses in the approximate range 1 to 9 M⊙.
It is known since long that the brightness variations of LPVs go along with spectral changes: (i) hydrogen and some metallic lines turn from absorption to emission after minimum light (Merrill 1921), (ii) the velocity of the emission and absorption lines correlates with phase and excitation potential (Merrill 1923a; Adams 1941), (iii) several absorption lines appear double around maximum light (Adams 1941; Merrill & Greenstein 1958; Maehara 1968).
In a review on red stars, Merrill (1955) was the first to suggest that the bright emission lines sometimes appearing in LPVs may be explained by some kind of “hot front” moving outward. He further suggested that this running hot front may have the structure of a shock wave.
Although the shock wave scenario is nowadays quite widely accepted (see de la Reza 1986 and references therein), the lack of self-consistent pulsation models for LPV stars (due to the important role played by convection and the difficulty of modelling it) prevents from grasping exactly how, why and where emission and double absorption lines form. As a consequence, several (sometimes conflicting) theories aiming at explaining the spectral peculiarities of LPVs have appeared in the literature. Although the most popular models locate the formation of emission lines in the hot wake of the shock (e.g., Gillet 1988a), an alternative model proposed by Magnan & de Laverny (1997) associates emission lines with purely radiative non-LTE processes independently of any shock wave. In this model, the double-peak nature of the emission lines is not connected in any way with the velocity field, contrary to the shock-wave model.
Concerning the absorption lines, their doubling around maximum light is most easily seen in the rather clean near-infrared spectral domain (e.g., Gillet et al. 1985; Hinkle et al. 1997 and references therein). Long-term radial velocity measurements of the infrared rotation-vibration lines of CO have revealed well-defined variations with phase, regularly repeating from one cycle to the next and following a typical S-shaped curve (Hinkle et al. 1997). These radial-velocity variations are generally believed to reflect the differential bulk motions occurring in the large and tenuous atmosphere of LPVs and associated with its pulsation. Alternatively, the complex absorption profiles have also been explained without resorting to differential velocity fields: Gillet et al. (1985) have argued that the doubling of the metallic absorption lines results in fact from the development of an emission core in the line. This emission component is caused by the radiative release of the thermal energy dumped into the post-shock layer by the shock front. This model has the advantage of being able to account for the P Cygni line profiles sometimes observed in LPV spectra (and appearing when the emission core becomes brighter than the local continuum). A similar explanation in terms of the shock-induced temperature inversion has been proposed by Karp (1975) for the line doubling observed in Cepheid variables. Detailed radiative-transfer calculations have shown that the formation of double absorption lines does not necessarily require a velocity gradient, since a temperature inversion is in principle sufficient.
Recent studies have clearly validated theories accounting for the complex absorption line profiles observed in several kinds of pulsating stars (RR Lyrae: Chadid & Gillet 1996, Fokin & Gillet 1997; Cephei stars: Mathias et al. 1998; BL Herculis: Gillet et al. 1994, Fokin & Gillet 1994; RV Tauri: Gillet et al. 1989a) in terms of velocity fields. The validity of the Schwarzschild scenario accounting for double absorption lines in terms of a velocity gradient in the photosphere remains however to be demonstrated for LPV stars. The present paper presents the first clear observational evidence thereof.
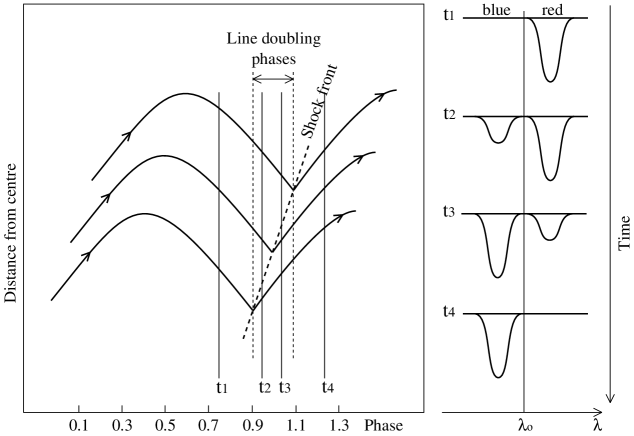
2 The Schwarzschild scenario
A definitive way to conclude that double absorption lines are indeed the signature of a velocity gradient in the atmosphere rather than of a central emission core is to check whether the double absorption-line profiles behave as predicted by the Schwarzschild scenario. Although Schwarzschild (1952) proposed this scenario in relation with W Vir variables, it should be applicable to any kind of variable stars with a shock wave propagating through its photosphere. According to this scenario, the intensity of the blue and red components of a double line should follow (around maximum light) the temporal sequence illustrated in Fig. 1 (Note that this scenario implicitly assumes that the processes radiating away the thermal energy dumped into the post-shock layers by the shock front have a negligible impact on the line profile). The observation of such a temporal sequence for the absorption line profiles in Miras would definitely point towards the velocity stratification as the origin of the double absorption lines, and moreover would offer a way to directly probe the velocity field associated with the pulsation.
3 The cross-correlation technique
The extreme difficulty in testing whether the Schwarzschild scenario operates in LPV stars comes from (i) the need for an intensive mid-term (i.e., daily for about 2 months around maximum light) monitoring of LPV stars, (ii) the crowded nature of the spectra of Mira stars, particularly in the optical domain. The cross-correlation technique provides a powerful tool to overcome the second difficulty. Indeed, the information relating to the line doubling (velocity shift and line shape) is in fact distributed among a large number of spectral lines, and can be summed up into an average profile, or more precisely into a cross-correlation profile, by a cross-correlation algorithm. If the correlation of the stellar spectrum with a specially designed mask involves many lines, it is possible to extract the relevant information from very crowded and/or low signal-to-noise spectra (e.g., Queloz 1995). Examples of the use of the cross-correlation technique (with the CORAVEL spectrovelocimeter) to derive line profiles may be found in Gillet et al. (1989a, 1990) for RV Tauri stars and in Udry et al. (1998) for Mira stars.
4 Monitoring of the Mira variables RT Cyg and X Oph
4.1 The ELODIE spectrovelocimeter
A monitoring of two Mira-type stars, RT Cyg and X Oph, was performed with the fibre-fed echelle spectrograph ELODIE (Baranne et al. 1996) from 1999, August 3 to October 4, with an interruption between September, 3 and September, 16. Both stars were observed each night (weather-permitting), resulting in 32 spectra for both RT Cyg and X Oph. ELODIE is mounted on the 1.93-m telescope of the Observatoire de Haute Provence (France), and covers the full range from 3906 Å to 6811 Å in one exposure at a resolving power of 42 000. Cross-correlation functions (CCF) with the default K0 III mask have been computed directly in the (pixels,orders) space (i.e., without merging or rebinning the spectrum, in order not to lose accuracy) following the prescription of Baranne et al. (1996).
4.2 RT Cyg
In Fig. 2, the nightly sequence of CCF profiles obtained for RT Cyg is presented. RT Cyg is a M2e–M8.8e Mira star belonging to an old (extended/thick disk or halo) population (Alvarez et al. 1997), with a rather short period [190.28 d according to the General Catalogue of Variable Stars (GCVS); Kholopov et al. 1988], typical of old populations, and a visual amplitude of 7 mag. Its maximum light was reached around 1999, September 1 according to the AAVSO light curve (Mattei 1999, Observations from the AAVSO International Database, private communication). Due to the uncertainties on the epoch of maximum light (2–3 days) and since the period is not constant from one cycle to the other, the transformation from Julian Dates to phases carries some degree of arbitrariness. In the present paper, phases were computed assuming that RT Cyg reached maximum light on 1999 September, 1 and adopting the GCVS period. It is worth noting that the light curve of RT Cyg shows a bump on the rising branch. By analogy with RR Lyr variables, this may be a signature of a particularly strong shock wave running through the atmosphere (Hill 1972; Fokin 1992; Bessell et al. 1996).
It can be seen in Fig. 2 that the sequence of CCFs follows the Schwarzschild scenario sketched in Fig. 1: at phase 0.80, a single absorption peak is seen at 113 km s-1; then, coming closer to maximum light, the CCF becomes more and more asymmetric (phases 0.80–0.90), until the blue component becomes clearly visible around phase 0.90. The blue peak continues to strenghten and becomes even stronger than the red peak after phase 0.96. The intensity of the red component, that remained almost constant until this phase, then starts to fade away. A visual inspection of a few clean lines in the spectrum has confirmed that the doubling of the CCF is not an artefact of the method, but reflects the doubling of the spectral lines probed by the considered mask.

The CCFs have been fitted by gaussian or double gaussian functions in order to derive the corresponding radial velocity, with the results shown on Fig. 3. The single absorption peak with 113 km s-1 seen at phase 0.80 splits up into a blue component with 121 km s-1 and a red component with 109 km s-1. The blue component becomes more and more blueshifted until its velocity reaches 130 km s-1 around phase 0.0. After maximum light, the blue shift of the blue component slowly decreases. The radial velocity of the red component appears to be much more stable than that of the blue component. The monitoring stopped at phase 0.158 (see Lebzelter et al. 1999 for radial velocities from infrared CO and Ti lines covering a more extensive fraction of the light cycle).
Unfortunately, the center-of-mass (COM) velocity is not known for that star, as there are no submm CO observations available222Based on a theoretical relationship between the shock amplitude and the outward post-shock velocity, Willson et al. (1982) obtain km s-1 for the COM velocity if RT Cyg is pulsating in the fundamental mode, or km s-1 for a first-overtone pulsation. Since these values are strongly model-dependent, they will not be used here.. The chances of detecting CO lines in RT Cyg are weak, though, since its IRAS 12 m flux (6.4 Jy) is more than 10 times smaller than in stars with detected CO lines. The unknown COM velocity prevents us from putting constraints on the strength of the shock (see, however, the analysis of Willson et al. 1982). For the classical Schwarzschild scenario to hold true, the COM velocity needs to fall in between the red and blue peaks (as it is the case for all the Mira variables monitored in the IR by Hinkle et al. 1997, as well as for the theoretical estimate of the COM velocity of RT Cyg by Willson et al. 1982; see also Lebzelter et al. 1999). In that case, a new shock wave appears at the bottom of the photospheric layers as they are already moving downwards on the ballistic motion induced by the previous shock (Chadid & Gillet 1996). The blue peak observed in RT Cyg would then correspond to ascending matter in the envelope, driven by the coming shock wave. If on the contrary the COM velocity would not fall in between the red and blue peaks but both peaks are ‘redshifted’ (a situation encountered at some phases in radial pulsators like RR Lyrae stars; see Chadid & Gillet 1996), this situation corresponds to a receding shock (in an Eulerian rest frame; in Lagrangian coordinates, the shock is obviously propagating outwards). Such a shock is not strong enough to oppose the infalling atmosphere.
In principle, the velocity variations of the blue peak convey information about the propagation of the matter just behind the shock. The shock may either accelerate as it encounters less and less resistance in an atmosphere of decreasing density, or decelerate as part of its energy is dissipated by radiative losses during its upward motion (Gillet et al. 1985). In RT Cyg (Fig. 3), the two trends are observed in succession: the ascending layer which is first accelerating (phases 0.87 to 0.98) decelerates after phase 0.08. The same trend may be observed for the layer where the red peak forms, which reacts with some delay to the motion of the underlying ‘blue’ layer. At phase 0.9, when the outward motion of the blue layer is the fastest, the inward motion of the red layer is decelerated (the slope changes from positive to negative on Fig. 3) as it is colliding with the rising shock. The outward acceleration stops at phase 0.0, and the red layer resumes its inward acceleration (on a possibly ballistic motion) as the force exerted by the blue layer has vanished (since the acceleration of the blue layer is now directed inwards).
However, the interpretation presented above is very crude as it neglects possible complications coming from optical-depth or geometrical effects. The line formed in an expanding atmosphere will be asymmetric even in the absence of a velocity gradient (e.g., Karp 1975), simply because the projection of the expansion velocity on the line of sight varies across the stellar disk. In the presence of velocity gradients, the problem is further complicated by the fact that different lines of sight across the stellar disk probe different geometrical depths (i.e., layers with different velocities) at any given wavelength. Moreover, in the presence of shocks, the matter gets compressed, leading to a steep increase in the optical depth. If the location of this steep optical-depth rise changes with respect to the velocity field, velocity variations unrelated to the shock acceleration or deceleration may be recorded. Dynamic models including radiative transfer are therefore ultimately needed to correctly interpret the results presented on Fig. 3.
The maximum velocity discontinuity (observed around phase 0.98) amounts to 20 km s-1, translating into 26 km s-1 after correction for limb darkening (Parsons 1972). Similar discontinuities are reported by Hinkle et al. (1997) for the two components of the double CO infrared lines observed in many Mira stars, which form however in different atmospheric layers than the optical lines sampled by the ELODIE mask. Willson et al. (1982) have performed a detailed analysis of the velocity structure of the atmosphere of RT Cyg, based on photographic spectra covering the optical domain as does ELODIE. These authors claim to have observed two shocks, the deeper one having an amplitude of about 30 km s-1, and the upper one about 13 km s-1 (see their Fig. 5). Denoting by and the post- and pre-shock velocities of the deeper shock, and by and the post- and pre-shock velocities of the upper shock, they obtain km s-1, km s-1, km s-1 and km s-1, relative to the inferred COM velocity. However, this structure relies on the ability to distinguish lines formed in regions A and C separated by only 4 km s-1, close to the resolution of the photographic spectrograms used, and moreover, lines formed at B tend to be weak and are not very numerous. Therefore, Willson et al. (1982) acknowledge that a single-shock structure is in principle possible as well. As weak lines are not sampled by the K0 III mask used by ELODIE, the presence of two shocks in the atmosphere of RT Cyg cannot be tested with this mask. The tomographic method, more appropriate to investigate this question as described in Sect. 5, provides however no evidence for a second shock from the mask sampling weak lines (see CCF on first line of Fig. 4).

4.3 X Oph
Quite interestingly, X Oph does not exhibit the same line-doubling phenomenon as RT Cyg. This star is classified as a M5e-M9e Mira star, with a mean period of 328.85 days and a visual amplitude of 3.3 mag () according to the GCVS. Its maximum light was reached on 1999 September, 16 (Mattei 1999, Observations from the AAVSO International Database, private communication). X Oph is a visual binary with a K1 giant companion (of magnitude ; Merrill 1923b) in an orbit of semi-major axis 0.”34 and of period about 500 y (Baize & Petit 1989). According to the AAVSO light curve, the faintest magnitude reached by X Oph during the survey was 7.7, so the presence of the companion did not disturb in any way our measurements.
The sequence of CCFs is presented in Fig. 2. The CCF remained single during the whole monitoring (a conclusion also reached by Hinkle et al. 1984 from infrared CO lines monitored over a large fraction of the light cycle), and the velocity stayed almost constant at 73 km s-1 (it varied between 72.8 and 73.4 km s-1). Nevertheless, Fig. 2 clearly reveals that the contrast of the CCF decreases with advancing phase.
From CO millimeter observations, Groenewegen et al. (1999) derive for X Oph a COM velocity of km s-1 with respect to the local standard of rest, or 73.5 km s-1 with respect to the solar barycentre. This COM velocity is close to the radial velocity derived from the CCF profiles: surprisingly, the photospheric layers probed by the K0 III mask are almost at rest with respect to the COM.
4.4 Discussion
At this point, two important conclusions may be drawn: (i) for the first time, clear evidences have been obtained that the Schwarzschild mechanism operates in at least some LPV stars (such as RT Cyg), (ii) not all LPVs exhibit line doubling around maximum light though. The second conclusion is confirmed by a survey of 75 LPVs observed around maximum light, which reveals that about 48% of the observed stars did not exhibit the line doubling phenomenon with the K0 III mask (Alvarez et al., in preparation). Nevertheless, this result does not necessarily imply that shock waves are not present in the deep atmosphere of those stars. Indeed, Balmer emission lines, which are commonly believed to be formed in the hot wake of the shock, are observed, although not very intense, in the spectra of X Oph (see Sect. 6). The absence of Schwarzschild mechanism may either be due to the combined effects of a weak shock and an insufficient resolving power to resolve the small Doppler shift between the red and blue peaks (that possibility seems however unlikely in the case of X Oph as the width of the CCF does not change around maximum light; see Fig. 2), to optical-depth effects (the shock is either optically thin or propagates in optically-thick layers), or simply to the use of an inadequate template. The latter possibility will be investigated in a forthcoming paper of this series which will also attempt to identify the key stellar parameter(s) governing the appearance of the line doubling and/or the strength of the shock.
5 Tomography
The cross-correlation technique in the optical spectrum opens the possibility of much more detailed studies of pulsating atmospheres. We briefly describe here the method that we are currently developing to perform the tomography of the envelope of LPV stars. A more thorough description will be presented elsewhere (Alvarez et al., in preparation). The method rests on our ability to construct reliable synthetic spectra of late-type giant stars, which has made significant progress in recent years (Plez 1999). The starting point is the ‘depth function’ , derived from models of late-type giant stars, and expressing the geometrical depth corresponding to optical depth 2/3 at the considered wavelength . The different masks are constructed from the collection of lines such that , where is some constant optimized to keep enough lines in any given mask without losing too much resolution in terms of geometrical depth. Each mask should thus probe lines forming at (geometrical) depths in the range in the atmosphere. These masks are then used as templates to correlate with the observed spectra of the LPV stars. This procedure should provide the velocity field as a function of depth in the atmosphere of the LPV stars. One crucial requirement of the method is that the masks constructed from static atmospheric models do not lose their ability to probe a layer of a given (geometrical) depth when applied to a dynamic atmosphere. This point will be discussed in more details in a forthcoming paper.

Fig. 4 displays a sequence of CCFs probing increasing depths in the atmosphere of RT Cyg at four phases. At phase 0.905, it can clearly be seen that the line doubling occurs only for the 3 deepest masks. At a later phase (0.953), the line doubling involves 3 more masks further out, translating the upward motion of the shock. At even later phases (0.000 and 0.147), the line doubling is seen up to the outermost mask. At phase 0.147, it is worth noting that the deepest mask displays a single blue peak, while the outermost mask displays a single red peak (though somewhat asymmetrical). In summary, the Schwarzschild scenario can be observed on both the temporal and spatial variations of the CCFs displayed in Fig. 4, thus clearly revealing the upward motion of the shock wave.
6 The Balmer lines
The Balmer lines are important diagnostics to which the temporal behaviour of the CCF of absorption lines may be compared. It is not the purpose of this paper to discuss thoroughly the different theories concerning the origin of the emission lines. Nevertheless, thanks to the two-month-long monitoring, the possibility is offered to present a high-quality temporal sequence of Balmer lines, which might later on be used to constrain the different existing models.
6.1 RT Cyg
Figure 5 displays the evolution of the H, H, H and H profiles of RT Cyg during the monitoring. The abcissa scale is a velocity scale. Since the COM velocity is not known for RT Cyg, the zero point of the velocity scale has been taken equal to a heliocentric velocity of 110 km s-1 (corresponding to the mean velocity of the red component of the CCF profiles; see Fig. 3). When analyzing Fig. 5, it should thus be remembered that the zero point of the velocity scale has been adjusted so as to correspond to the velocity of the red component of the absorption lines, which is almost certainly different from the stellar COM velocity. The H profile is not shown for phase 0.079 because of the too low signal-to-noise ratio achieved in this order.

The H profile is seen in emission during the whole monitoring, although weakly so on the first frame corresponding to phase 0.806. In the early development of the emission feature, it is obliterated by an absorption feature falling right on top of it. At later phases, a separate red component is very clearly present. Such a structure has been observed in several Mira stars (see Gillet 1988a; Woodsworth 1995). The H and H profiles are rather similar in the first half of the monitoring, but, at the latest phases, the H profile shows no red component but instead a very clear pedestal at the base of the line. The H and H emissions are much more complex in the early stages of the monitoring. Mutilations of the H and H profiles are expected to be less pronounced than in the case of H and H as molecular absorptions are weaker in their spectral domain (Gillet 1988b).
6.2 X Oph
Figure 6 displays the temporal evolution of the Balmer lines of X Oph during the monitoring. The COM velocity has been taken equal to 73.5 km s-1 (see Sect. 4.3). The vertical-axis scale is the same as in the case of RT Cyg to make the comparison with Fig. 5 easier. The H, H and H profiles are not shown for phase 0.857 because of the too low signal-to-noise ratio achieved in the blue orders.

Although H is almost as strong in X Oph as in RT Cyg (but not quite so), H is much weaker (by at least of factor of 2), and H and H are only barely visible after phase 0.991. It is interesting to note that the relative intensities of the Balmer lines are similar in X Oph and RT Cyg. Therefore, it is not surprising that H never gets very strong in X Oph, since a look at RT Cyg shows that, for H to be clearly visible, the intensity of H needs to exceed 20 (relative to the local continuum) which is never the case in X Oph. This may indicate that the same (recombination?) mechanism is operating in both stars to produce the Balmer emission lines and that the variation of the underlying opacity with wavelength is the same as well.
The absence of Schwarzschild mechanism in X Oph and its occurrence in RT Cyg may similarly be related to their respective Balmer line intensities. The CCF profile starts becoming clearly asymmetric at phase 0.884 in RT Cyg (Fig. 2), when the relative intensity of H amounts to 3. As such intensity levels are never reached in X Oph, it is thus not surprising that the CCF remains single, provided of course that the Schwarzschild mechanism and the Balmer line intensities are indeed somehow correlated. Whether or not this is systematically the case remains however to be confirmed on a larger sample. At this point, it may just be concluded that RT Cyg and X Oph differ by the presence/absence of the Schwarzschild mechanism and by the strength of the Balmer lines.
6.3 Comparing the velocities of the Balmer and absorption lines in RT Cyg
The comparison of the H and absorption-line velocities illustrates the respective merits of the competing models accounting for the complex H line profile. Two different models involving a single spherical shock wave have been proposed to explain the origin of the double H emission structure observed in Mira stars (Gillet 1988b). The first one is the so-called ‘geometrical model’ (Willson 1976; Gillet et al. 1985) stating that, while the emission line is produced within the de-excitation zone behind the shock front, the redshifted component is emitted by the shock propagating far above the photosphere in the hemisphere opposite to the observer whereas the blueshifted component is emitted by the shock propagating in the hemisphere facing the observer. In that model, the two emission components should be almost centered on the stellar COM velocity. The second interpretation is the self-reversal model (Bidelman & Ratcliffe 1954; Gillet 1988a) stating that there is a true absorption obliterating the emission line, caused by the presence of cool hydrogen gas above the shock front. In the latter interpretation, the central absorption should have the velocity of the layers lying above the shock. In the framework of the Schwarzschild model, those layers are responsible for the red absorption-line component. As the velocity of those layers approximately corresponds to the adopted zero-point of the velocity scale for the Balmer features, the central absorption should have a velocity close to zero, which indeed appears to be the case, as indicated below in relation with Fig. 8.
An example of H profile obtained during the monitoring (phase 0.953) of RT Cyg is shown in Fig. 7. To evaluate the merits of the above two models333It is worth mentioning that a third interpretation, not considered here, has been proposed by Woodsworth (1995) and involves three emission components., the complex line profile has been fitted by gaussian functions in two different ways. The ‘geometrical model’ requires to fit separately the blue and red emission components (case a on Fig. 7) whereas the self-reversal model requires to fit separately the broad emission line and the central absorption (case b on Fig. 7). Figure 8 displays the velocity structure of the H line as a function of phase, for the two cases. It should also be remembered that there is an atomic or molecular absorption feature unrelated to H falling right on top of it, as indicated by the arrow in Fig. 7. Its velocity is also displayed in Fig. 8 for phases earlier than 0.01, since it is no more visible afterwards. Because these absorption features mutilate the still weak H line during the early stages of the monitoring, the fit of the broad emission feature performed for case b is rather inaccurate and has therefore not been presented on Fig. 8 until phase 0.91 when the fit becomes more reliable.
Figure 8 offers the interesting possibility to compare the evolution of the structure of the H line with the corresponding evolution of the absorption features (Fig. 3). The comparison of these two figures reveals interesting similarities in the framework of case b. First, the velocity of the central absorption feature overlying the broad H line has a velocity similar to that of the red component of the absorption lines, as expected if both features form in the layers just above the shock. Second, the velocity difference between the broad emission line and the overlying absorption feature ( km s-1) is of the same order as the difference between the velocities of the red and blue peaks of the absorption lines. This is again consistent with the hypothesis that the broad H emission and the blue absorption lines both form in the ascending, post-shock layers.
On the contrary, there is no clear correspondence between the absorption-line velocities and the velocities of the red and blue H emission peaks defined in the framework of case a.
At this point, one should mention that the interpretation of the H line profile according to case a or b also results in very different shock-front velocities (Gillet 1988a). The geometrical model (case a) yields rather large shock velocities (of the order of 60 km s-1), whereas the self-reversal model (case b) involves much smaller shock velocities (30 km s-1; Gillet 1988a). On theoretical grounds, Gillet et al. (1989b) have shown that a shock velocity in excess of 60 km s-1 is required for the shock to be strong enough to first photodissociate H2 molecules and then photoionize the resulting hydrogen atoms, to produce the observed Balmer emission lines by recombination. This requirement is consistent with the velocities (50–70 km s-1) deduced from the observations of fluorescent lines in Miras (Willson 1976), and would also favour case a over case b.
In the above discussion, case a faced however the difficulty that there is no clear coincidence between the H and absorption-line velocities, although one would naively expect some if those lines are formed in the vicinity of the same shock. The above conclusion of discrepant velocities has been reached assuming that both H and absorption lines form in a thin layer, so that they can be assigned the velocity of the layer where they form. However, this assumption might not hold true for absorption lines which form over a broader region than H, so that the velocity of the absorption lines result from an average of the velocity field over the line-forming region. The discrepant H and absorption-line velocities observed in the framework of case a may possibly be reconciled when such averaging effects are properly taken into account.
Detailed dynamic models coupled to radiative transfer are thus ultimately needed to answer the question of the origin of the complex H line profile.


7 Conclusion
The origin of double-peaked emission and absorption lines in the complex LPV atmospheres is a long-standing problem. If the shock wave and the associated velocity gradient are generally believed to be at the origin of the complex line profiles of LPV stars (de la Reza 1986; Gillet 1988b; Hinkle et al. 1997), alternative models not resorting to differential atmospheric motions are sometimes invoked. They involve either purely non-LTE effects to account for the double-peaked Balmer emission (Magnan & de Laverny 1997), or a temperature inversion to account for the splitting of the absorption lines (Karp 1975; Gillet et al. 1985).
Thanks to the cross-correlation technique and a daily survey of the Mira star RT Cyg, the role of velocity fields in the formation of genuinely double absorption lines has been undoubtedly confirmed in the framework of the Schwarzschild mechanism. Evidence for the existence of strong shock waves in the outer layers of LPVs becomes compelling, although not all Mira stars exhibit the Schwarzschild scenario, as demonstrated by the observations of X Oph collected in the present paper. The origin of this distinct behaviour will be investigated in the next paper of this series.
A tomographic technique that opens new perspectives for the study of the dynamics of LPVs has been used to visualize the outward motion of the shock wave in the atmosphere of RT Cyg.
The evolution of the H, H, H and H emission-line profiles during 35% (20%) of the cycle of RT Cyg (X Oph) around maximum light has also been discussed. The comparison of this data set with the temporal evolution of the profile of absorption lines offers interesting perspectives to identify the origin of the complex profile of the H emission line.
The present paper had no other ambition than providing a description of the data collected with the ELODIE spectrograph around maximum light for RT Cyg and X Oph. These data may be used as constraints for future detailed models. Firm conclusions on the line-formation mechanisms in Mira variables should thus await the advent of such detailed dynamic models coupling hydrodynamics to radiative transfer.
Acknowledgements.
We are grateful to X. Delfosse, D. Erspamer, A. Gomez, M. Haywood, E. Josselin, M. Mayor, D. Naef, D. Segransan, E. Oblak and S. Udry for performing part of the observations, as well as to the staff of the Haute-Provence Observatory. Ephemeris and light curves provided by the AAVSO International Database were very helpful for planning the monitoring described in the present paper. R.A. benefits of a TMR “Marie Curie” Fellowship at ULB. A.J. is Research Associate from the Fonds National de la Recherche Scientifique (Belgium).References
- (1) Adams W.S., 1941, ApJ 93, 11
- (2) Alvarez R., Mennessier M-O., Barthès D., Luri X., Mattei J.A., 1997, A&A 327, 656
- (3) Baize P., Petit M., 1989, A&AS 77, 497
- (4) Baranne A., Queloz D., Mayor M. et al., 1996, A&AS 119, 373
- (5) Bessell M.S., Scholz M., Wood P.R., 1996, A&A 307, 481
- (6) Bidelman W.P., Ratcliffe A.E., 1954, PASP 66, 255
- (7) Chadid M., Gillet D., 1996, A&A 308, 481
- (8) Fokin A.B., 1992, MNRAS 256, 26
- (9) Fokin A.B., Gillet D., 1994, A&A 290, 875
- (10) Fokin A.B., Gillet D., 1997, A&A 325, 1013
- (11) Gillet D., 1988a, A&A 190, 200
- (12) Gillet D., 1988b, A&A 192, 206
- (13) Gillet D., Maurice E., Bouchet P., Ferlet R., 1985, A&A 148, 155
- (14) Gillet D., Duquennoy A., Bouchet P., Gouiffes C., 1989a, A&A 215, 316
- (15) Gillet D., Lafon J-P., David P., 1989b, A&A 220, 185
- (16) Gillet D., Burki G., Duquennoy A., 1990, A&A 237, 159
- (17) Gillet D., Burki G., Chatel A., Duquennoy A., Lèbre A.,1994, A&A 286, 508
- (18) Groenewegen M.A.T., Baas F., Blommaert J.A.D.L. et al., 1999, A&AS 140, 197
- (19) Hill S.J., 1972, ApJ 178, 793
- (20) Hinkle K.H., Scharlach W.W.G., Hall D.N.B., 1984, ApJ 56, 1
- (21) Hinkle K.H., Lebzelter T., Scharlach W.W.G., 1997, AJ 114, 2686
- (22) Karp A.H., 1975, ApJ 201, 641
- (23) Kholopov P.N., Samus N.N., Frolov M.S. et al., 1988, General Catalogue of Variable Stars, Fourth Edition, Nauka Publ. House, Moscow
- (24) Lebzelter T., Hinkle K.H., Hron J., 1999, A&A 341, 224
- (25) Maehara H., 1968, PASJ 20, 77
- (26) Magnan C., de Laverny P., 1997, MNRAS 286, 920
- (27) Mathias P., Gillet D., Fokin A.B., Cambon T., 1998, A&A 339, 525
- (28) Merrill P.W., 1921, ApJ 53, 185
- (29) Merrill P.W., 1923a, ApJ 58, 215
- (30) Merrill P.W., 1923b, ApJ 57, 251
- (31) Merrill P.W., 1955, PASP 67, 199
- (32) Merrill P.W., Greenstein J.L., 1958, PASP 70, 98
- (33) Parsons S.B., 1972, ApJ 174, 57
- (34) Plez B., 1999. The modelling of M–giant spectra. In: T. Le Bertre, A. Lèbre, C. Waelkens (eds.) AGB Stars (IAU Symp. 191), ASP Conf. Ser., p. 75
- (35) Queloz D., 1995. Echelle spectroscopy with a CCD at low signal-to-noise ratio. In: A.G. Davis Philip, K.A. Janes, A.R. Upgren (eds.) New developments in array technology and applications (IAU Symp. 167), Kluwer, Dordrecht, p. 221
- (36) de la Reza R., 1986. Quasi-thermal models. In: H.R. Johnson, F.R. Querci (eds.) The M-type stars (NASA SP-492), NASA and CNRS, p. 373
- (37) Schwarzschild M., 1952. Shock waves in the atmosphere of pulsating stars. In: P.T. Oosterhoff (ed.) Transactions of the IAU, Vol. VIII, Cambridge University Press, p. 811
- (38) Udry S., Jorissen A., Mayor M., Van Eck S., 1998, A&AS 131, 25
- (39) Willson L.A., 1976, ApJ 205, 172
- (40) Willson L.A., Wallerstein G., Pilachowski C.A., 1982, MNRAS 198, 483
- (41) Woodsworth A.W., 1995, ApJ 444, 396