The Wisconsin H-Alpha Mapper Northern Sky Survey
Abstract
The Wisconsin H-Alpha Mapper (WHAM) has completed a survey in Balmer of the entire Northern sky above declination . This survey provides the first calibrated, velocity-resolved map of the H emission from the Galaxy. With one-degree spatial resolution, 12 km s-1 velocity resolution, and sensitivity to features as faint as 0.1 R (EM 0.2 cm-6 pc), this survey provides the deepest maps of the ionized content of the Galaxy to date. In addition to probing the detailed kinematic structure of the Warm Ionized Medium and the vertical structure of the ionized content in spiral arms, initial results include the discovery of several faint, extended () H ii regions and the first map of the ionized component of an intermediate velocity cloud.
Department of Astronomy, University of Wisconsin–Madison, 475 North Charter St., Madison, WI 53703
1. Introduction
Past studies have shown the Warm Ionized Medium (WIM) to be a significant component of the ISM, especially in the halos of disk galaxies (Reynolds 1993; Hoopes, Walterbos, & Rand 1999; Rand 1996; Rossa & Dettmar 2000; Dettmar 1998). In the Milky Way, the WIM has a mass surface density about one-third that of H I, an ionization power requirement equal to the supernovae rate, and a characteristic scale height of 1 kpc (Reynolds 1993; Haffner, Reynolds, & Tufte 1999). Although the details of how the WIM is ionized and heated are not well understood yet, early-type stars seem to be the biggest contenders for providing the bulk of the ionizing photons. Dove, Shull, & Ferrara (2000); Dove & Shull (1994); and Miller & Cox (1993) have studied how O-star radiation can leak from the plane to ionize the large expanse occupied by the WIM. However, we will show below that B-stars may also be a significant contributer to the halo ionization field. The problem of Lyman continuum propagation through neutral gas is somewhat easier if these more widely distributed stars can contribute.
Aided by modern detector technology, several groups have initiated intensive programs to characterize the global details of the ionized content of galaxies (also called Diffuse Ionized Gas—DIG). In addition to the velocity-resolved all-sky survey described here, three large-area imaging surveys are also in progress. A southern survey with arc-minute resolution has been completed by Gaustad, McCullough, & Van Buren (1996; McCullough, these proceedings). Dennison, Simonetti, & Topasna (1998) have been imaging the northern sky with similar resolution. A high-resolution () survey of the Galactic plane and Magellanic clouds is also underway by Parker & Phillips (1998).
Here we describe the results of the Wisconsin H-Alpha Mapper (WHAM) Northern Sky Survey, the first deep ( R; 1 R = photons cm-2 s-1 ster-1), velocity-resolved survey of the WIM in our Galaxy.
2. The WHAM Survey
The northern portion of the WHAM sky survey contains nearly 37,300 spectra with 12 km s-1 resolution, each representing the spatially integrated emission from a one-degree patch on the sky. The survey covers the northern sky above with a beam spacing of and . Each spectrum covers a 200 km s-1 spectral interval centered near the Local Standard of Rest (LSR). With our spectral resolution, we are able to remove the bright geocoronal H line and several very faint atmospheric lines present in every spectrum. These cleaned spectra allow us to detect very faint extended sources (IHα = 0.1 R; EM cm-6 pc) and will allow us to absolutely calibrate the WHAM survey. More details of the WHAM instrument and the survey strategy can be found in Tufte (1997) and Haffner (1999).
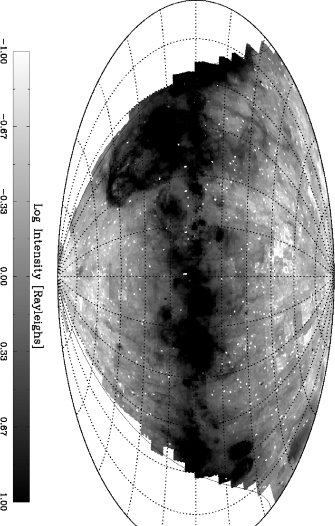
The nearly completed (99%) northern sky survey is displayed in Figure 1. As can been seen, very few regions exist where we do not detect at least 0.1 R of H emission. Much of the intensity variation at high latitudes is real although the final phase of intensity calibrations has not yet been applied to the data presented here. To illustrate the power of this new survey we present two new discoveries here: the first map of the ionized component of an Intermediate Velocity Cloud (IVC) and the detection of several faint, diffuse H ii regions.
3. The Ionized Component of Complex K
Wakker (2000) recently separated out the H i intermediate velocity Complex K (previously classified with Complex C) centered near , . Figure 2 shows an image of the H emission from WHAM and contours of 21 cm emission from the Leiden-Dwingeloo H i survey (Hartmann & Burton 1997) toward Complex K.
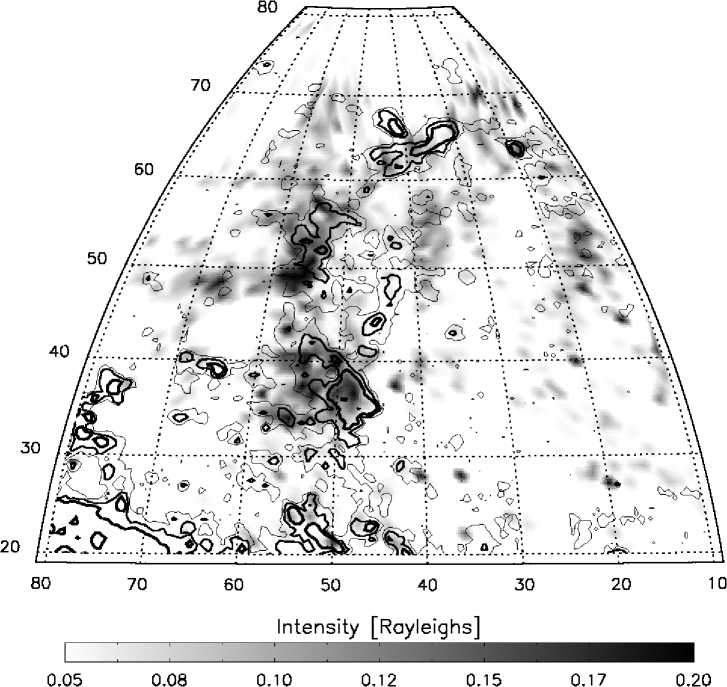
The H boundary matches the cm-2 contour quite closely over most of the cloud; however, the peaks in each emission component do not correspond as well. The H intensity over the face of the cloud only varies by about a factor of 2: 0.1 to 0.2 R or EM 0.2 to 0.4 cm-2 pc. The total over the face of the cloud varies from about 1 to cm-2, resulting in an extinction correction to the observed H flux of at most if all this neutral material is actually between us and the cloud.
As reviewed by Wakker (2000), little absorption line data directly toward Complex K exists at this time and thus little information about its distance. There is a firm upper limit established though since the cloud has been seen in absorption toward nearby M13 (). Carretta, et al. (2000) have recently calculate the distance modulus to M13 to be 14.44 mag, setting an upper limit on the distance of the portion of complex K near M13 at 7.7 kpc.
If the cloud is ionized by an external photoionizing source the incident Lyman continuum flux on the cloud surface can be estimated (see Tufte, Reynolds, & Haffner 1998). Ignoring the complexity of geometry but applying the maximum extinction correction above, we find that the incident flux of ionizing photons, photons cm-2 s-1 for the brightest H regions in Complex K. Bland-Hawthorn & Maloney (1999) have produced a model of the ionizing flux in the Galactic halo. We find that our observed H intensity is consistent with that expected from their model in the direction of Complex K for distances kpc from the sun (Bland-Hawthorn 2000, private communication).
4. Faint, Diffuse H ii Regions
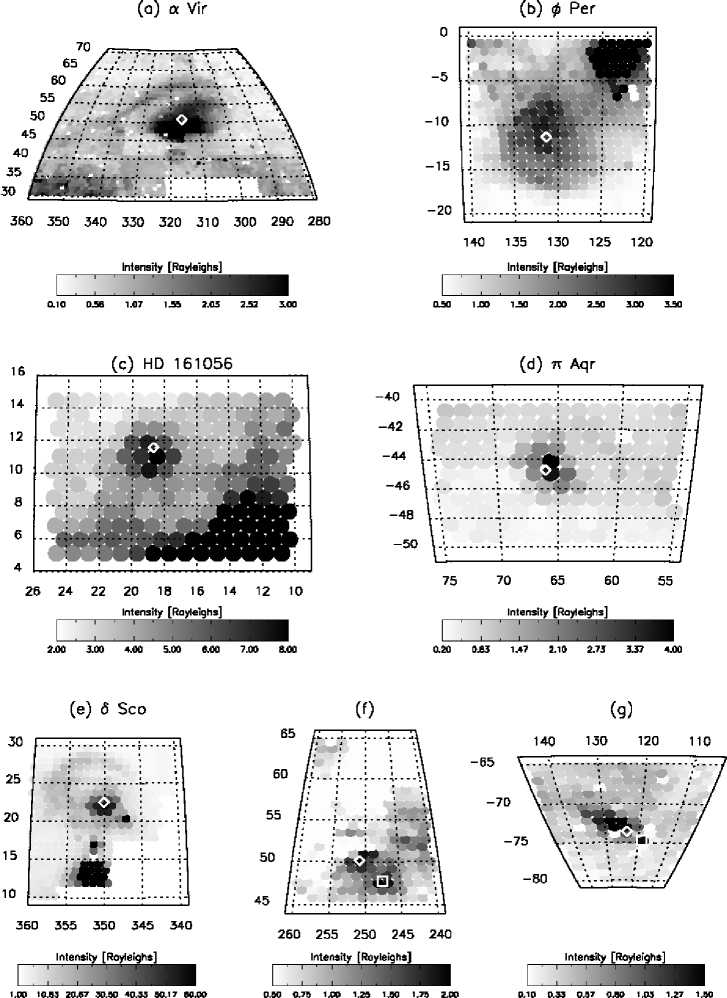
As noted above, the problem of ionizing the WIM layer becomes somewhat easier if O stars in the plane are aided by another, more widely distributed population. Reynolds (1985) mapped a large, low-density H ii region around Vir (Spica), a B1III-IV + B2 V system. In Figure 3, we present a full map of the Spica H ii region as well as several other candidate H ii regions discovered in the WHAM survey.
| Sourcea | Distanceb | Spectral Type | Diameter | |||
| [pc] | [∘/pc] | [photons s-1] | ||||
| (a) Vir | 316.11 | +50.84 | 80 | B1III-IV + B2V | 16c / 22 | |
| (b) Per | 131.32 | 220 | B0.5Ve + sdO | 13 / 50 | ||
| (c) HD 161056 | 18.67 | +11.58 | 427 | B1.5V | 4 / 30 | |
| (d) Aqr | 66.01 | 338 | B1Ve | 2.5 / 30 | ||
| (e) Sco | 350.1 | +22.49 | 123 | B0.2IV | 3d / 13 | |
| (f) PG1047+003 | 250.85 | +50.17 | – | sdB | 1.5 | – |
| (f) WD1034+001 | 247.55 | +47.75 | – | DO | 1.5 | – |
| (g) PHL 6783 | 123.64 | -73.53 | – | sdO | 2 | – |
| (g) NGC 246 | 118.86 | -74.71 | 600: | Op | 2 | – |
The likely sources for these regions are summarized in Table 1. We estimate the physical diameter of each region when the distance to the source is known. In these cases, the final column lists the minimum Lyman continuum luminosity needed to sustain the observed H flux:
| (1) |
where is the distance to the region, is the intensity emitted by the solid angle , is the fraction of photons produced per Lyman continuum photon (0.47 at 8000 K; Martin 1988), and is the extinction correction factor. Background emission from the WIM (estimated from outside the region) is subtracted so that the used in this calculation is (presumably) emission only from the H ii region.
We emphasize that our estimate of is a lower limit for two reasons. First, although many of these regions appear to be circular, we cannot be sure that all the Lyman continuum radiation from the source is absorbed by the local gas forming the H ii region. Second, we do not apply an extinction correction here (i.e. ). An ongoing WHAM survey of H will directly provide the extinction correction in the future.
The H ii region displayed in Figure 3g deserves special mention. Current catalogs list no candidate source near the center of this region. The only two reasonable candidates within a 5∘ radius of the center of the region are PHL 6783 (sdO) and NGC 246 (Op; PN). On the far side of the ionized nebula from these sources ( to 140, to ) sits an H i cloud whose velocity matches the H emission. We interpret this seeming coincidence as evidence that one of these sources (most likely PHL 6783 from the geometry) is ionizing the face of this H i cloud.
However, the picture may be even a bit more interesting. The proper motion of PHL 6783 ( mas yr-1, mas yr-1; mas yr-1, mas yr-1; Høg et al. 2000) indicates that it passed through the peak H of the region approximately years ago. The central star of NGC 246 also has a proper motion ( mas yr-1, mas yr-1; mas yr-1, mas yr-1; Høg et al. 2000) that suggests it was just a degree south of this peak years ago. The H ii region is slightly elongated along these proper motion vectors (both of which also eventually intersect the H i cloud) and is almost directly aligned with that of PHL 6783. With such proper motion vectors, there is a possibility that the H ii region is no longer being actively ionized. In this slightly more complicated scenario, PHL 6783 still seems to be the best candidate for the source since its proper motion vector direction and length are best suited to have recently ionized the region.
5. Summary
WHAM has completed a full spectral survey of the northern sky () in H. Similar to the neutral component, filamentary substructure abounds in the ionized halo of the Galaxy. Exciting results from the faint H sky are abundant and we have presented two specific examples here. We have presented the first ionized map of an HVC or IVC. Complex K contains an ionized component with – R that follows the shape of the neutral gas extremely well. We have also presented several new, faint H ii regions, many of which appear to be ionized by early B stars. In addition, one of these regions is very likely an example of an isolated H i cloud being ionized by a nearby sdO star.
Acknowledgments.
This research has made substantial use of the SIMBAD database, operated at CDS, Strasbourg, France. WHAM is supported by the National Science Foundation through grant AST 96-19424.
References
Bland-Hawthorn, J. & Maloney, P. R. 1999, ApJ, 510, L33
Carretta, E., Gratton, R. G., Clementini, G. & Fusi Pecci, F. 2000, ApJ, 533, 215
Dennison, B., Simonetti, J. H., & Topasna, G. A. 1998, PASA, 15, 147
Dettmar, R.-J. 1998, Berlin Springer Verlag Lecture Notes in Physics, v.506, 506, 527
Dove, J. B. & Shull, J. M. 1994, ApJ, 430, 222
Dove, J. B., Shull, J. M. & Ferrara, A. 2000, ApJ, 531, 846
Fejes, I. 1974, AJ, 79, 25
Gaustad, J., McCullough, P., Van Buren, D. 1996 PASP, 108, 351
Haffner, L. M. 1999, Ph.D. Thesis
Haffner, L. M., Reynolds, R. J. & Tufte, S. L. 1999, ApJ, 523, 223
Hartmann, D. & Burton, W. P. 1997, Atlas of Galactic Neutral Hydrogen (New York: Cambridge Univ. Press)
Høg, E. et al. 2000, A&A, 355, L27
Hoopes, C. G., Walterbos, R. ;. M. & Rand, R. J. 1999, ApJ, 522, 669
Martin, P. G. 1988, ApJS, 66, 125
Miller, W. W. I. & Cox, D. P. 1993, ApJ, 417, 579
Parker, Q. A. & Phillips, S. 1998, PASA, 15, 28
Perryman, M. A. C., et al. 1997, A&A, 323, L49
Rand, R. J. 1996, ApJ, 462, 712
Reynolds, R. J. 1985, AJ, 90, 92
Reynolds, R. J. 1993, in AIP Conf. Proc. 278, Back to the Galaxy, ed. S. S. Holt & F. Verter (New York: AIP), 156
Rossa, J. & Dettmar, R.-J. 2000, A&A, 359, 433
Tufte, S. L. 1997, Ph.D. Thesis
Tufte, S. L., Reynolds, R. J. & Haffner, L. M. 1998, ApJ, 504, 773
Wakker, B. P. 2000, ApJ, in press