The Sunyaev-Zeldovich MITO Project
Abstract
Compton scattering of the cosmic microwave background radiation by electrons in the hot gas in clusters of galaxies - the Sunyaev-Zeldovich (S-Z) effect - has long been recognized as a uniquely important feature, rich in cosmological and astrophysical information. We briefly describe the effect, and emphasize the need for detailed S-Z and X-ray measurements of nearby clusters in order to use the effect as a precise cosmological probe. This is the goal of the MITO project, whose first stage consisted of observations of the S-Z effect in the Coma cluster. We report the results of these observations.
keywords:
Compton scattering , clusters of galaxies , cosmological parameters, , , , , , ,
1 Introduction
The Sunyaev-Zeldovich (S-Z) effect arises from Compton scattering of the cosmic microwave background (CMB) radiation by electrons in the hot gas in clusters of galaxies (for reviews, see Rephaeli, 1995 and Birkinshaw, 1999). The fact that the effect is essentially independent of redshift makes it an extremely valuable cosmological probe. Interest in this effect heightened particularly when high quality images of the effect were obtained with interferometric arrays equipped with sensitive receivers. More than twenty clusters have already been mapped by the BIMA and OVRO arrays (Carlstrom et al., 1999). Together with the much improved X-ray spectral and spatial measurements of clusters, achieved with the Chandra and XXM satellites, it seems quite likely that we will soon be much closer to realizing the full potential of the effect as an indispensable cosmological probe.
Multi-frequency S-Z measurements, combined with high quality spectral and spatial X-ray measurements, will likely yield exact values determination of the cluster baryon fraction, , the peculiar velocity, the cluster angular diameter distance, , and of the Hubble constant, . These quantities can be accurately determined only if we have a precise description of the intracluster (IC) gas temperature and density profiles, and by a much improved control of systematic errors. In spite of the major progress expected from measurements of clusters with the new Chandra and XXM satellites, the substantial uncertainties in modeling the gas thermal and spatial distributions strongly favor use of nearby clusters for which our knowledge of these distributions is optimal.
In this paper we describe the Sunyaev-Zeldovich effect, and report preliminary results of observations of the Coma cluster with the MITO experiment.
2 Theory: the thermal and the kinematic S-Z effect
The original description of the effect (Sunyaev & Zeldovich 1972) was based on a non-relativistic treatment, but an exact description necessitates a relativistic treatment (Rephaeli, 1995). In the non-relativistic (first order) limit, the effect consists of two distinct components which can be calculated separately.
The thermal component of the S-Z effect arises from the thermal motion of the electrons: the energy transfer from the hot gas to the radiation produces a distortion of the CMB spectrum resulting in a frequency shift toward the Wien side of the spectrum. Thus, it will be a decrement in brightness at low frequencies and an increment in brightness at high frequencies. In a non-relativistic treatment, the CMB intensity change along the line of sight is given by (Zeldovich and Sunyaev, 1968)
| (1) |
where , is the CMB temperature, expresses the spectral dependence, is the Comptonization parameter, and
| (2) |
The spectral form of the thermal component is expressed in the function
| (3) |
which vanishes at the crossover frequency GHz) for (see Fig.1). The spatial dependence is provided by the Comptonization parameter,
| (4) |
where the integral is calculated over a line of sight through the cluster, and are the electron density and temperature, and is the Thomson cross section. Finally, the thermodynamic temperature change due to the scattering is
| (5) |
Electron velocities in the hot IC gas are very high, thus necessitating an exact relativistic treatment (Rephaeli, 1995). Use of the relativistically correct expression for the intensity change is essential at high frequencies, especially when the effect is used as a cosmological probe.
The kinematic component, due to the cluster velocity of the IC plasma with respect to the CMB rest frame, produces an additional kinematic intensity change. Scattered photons suffer a Doppler shift dependent on the angle of their scattering relative to the bulk velocity. The resulting CMB brightness change is
| (6) |
where is the line of sight component of the peculiar velocity, and is the cluster optical depth given by
| (7) |
The spectral character of the kinematic effect is given by the function
| (8) |
Finally, the expression of the temperature change due to the kinematic component is
| (9) |
which is frequency independent.
Observational separation between the thermal and kinematic effects is realistically feasible only at millimeter wavelengths, close to the crossover frequency, as can be seen in Fig.1.
3 Combined analysis of S-Z and X-ray measurements
Basic parameters which characterize the state of IC gas are the electron number density, , and the gas temperature, . Clearly, the scattering optical depth and the Comptonization parameter depend on these parameters. Also the cluster X-ray spectral surface brightness can be expressed as a function of gas density and temperature profiles
| (10) |
where z is the redshift of the cluster and is the spectral emissivity of the gas at an energy E. The factor arises from the assumption that the emissivity is isotropic, while the factor takes account of the cosmological transformations of spectral surface brightness and energy.
The X-ray satellites ROSAT and ASCA have observed a large number of clusters with high signal-to-noise ratios in order to determine the gas thermal and spatial distributions: the spectrum of emission can be used to determine the gas temperature, while the angular distribution of X-ray emission can be used to determine the density profile. The prediction, however, can not be very accurate, since there is no unique inversion of equation (10), necessitating use of a parameterized model to fit the X-ray data. The density and temperature distributions are commonly described by the isothermal model (Cavaliere, Fusco-Femiano, 1976, 1978). In this simplified description the isothermal gas is assumed to be spherically distributed
| (11) |
where is the gas core radius. Deviations from this model have been noted, especially in cluster outer regions. For a recent discussion on the influence of the shape and the finite extension of a cluster on both the X-ray surface brightness and the S-Z effect see Puy et al., 2000 and references therein.
Combining measurements of the X-ray emissivity
and of the thermal S-Z effect , a substantial
part of the indeterminacy inherent in the X-ray analysis of IC gas
properties can be removed. This is very important, since the
accuracy in the determination of the appropriate model describing
IC gas has important ramifications on the accuracy in the
determination of the Hubble constant, . This cosmological
parameter can be estimated comparing the theoretical expression
of the angular diameter distance, , to a cluster, with its
measured value. In fact, assuming spherical symmetry and using
the cluster’s angular size, the absolute distance to a cluster
can be calculated without recourse to the cosmic distance ladder.
To yield this result, we need only to know the emission of the IC
gas, which is provided by the X-ray surface brightness, and its
absorption, which is provided by the thermal S-Z effect
(Holzapfel et al., 1997). This observational value must be
compared with the theoretic expression for given by (Goobar
and Perlmutter, 1995)
| (12) |
where and are the mass density and the cosmological constant density parameters respectively, and is the curvature parameter. For , is defined as and ; for , and ; and for , and .
4 Observing nearby clusters
The S-Z effect, as just discussed, can be used as a distance scale indicator. Even though the S-Z effect is independent of distance, the quality of observational data favors observations of nearby clusters for use of the effect as a cosmological probe. The main advantage of observing distant clusters in the mm region is the reduced contamination from the primary CMB anisotropy; however, the quality of X-ray spectral and spatial data is significantly lower (due to geometric dimming, and limited spatial resolution) than that available for nearby clusters. Non accurate clusters X-ray images cause a large uncertainty in determining the parameters of the isothermal model, and thus inaccurate values of the Hubble constant. The large systematic errors that affect X-ray data can be limited observing nearby clusters for which better X-ray maps are available. This allows to model more accurately the structure of IC gas. Obviously, to resolve the S-Z effect in nearby clusters, all the problems relative to the detection of millimetric signals must be solved , first of all the atmospheric noise but also the foreground confusion caused by other astrophysical sources.
In the review of Birkinshaw (Birkinshaw, 1999) there is a complete list (since 1999) of the experiments realized in order to detect the S-Z effect toward nearby and distant clusters of galaxies. For each experiment, the relative measured CMB temperature change is reported. In the following section we describe the new MITO experiment and project, whose main goal is the measurement of the S-Z effect in nearby clusters, beginning with the Coma cluster.
5 MITO: Millimetric and Infrared Testagrigia Observatory
MITO is a ground-based observatory located at 3480 m a.s.l., on the top of the Testa Grigia mountain, in Val d’Aosta, Italy (M. De Petris et al.,1996). Its observational range is the mm and submm region of the spectrum, and its present target is the study of the thermal S-Z effect on a sample of nearby clusters of galaxies in order to provide good estimates of and of .
In the frequency range where the S-Z distortion makes its transition from a decrement to an increment, the atmosphere is not very transparent and its contribution must be, therefore, limited. The most important features of a good mm-site are then a high atmospheric transmission and low atmospheric fluctuations. During the last winter observational campaigns at MITO, low values of the precipitable water vapor (pwv) content were computed, showing atmospheric conditions as good as other important sites around the world (see Fig.2 and Table 1).
The instrument
The CMB temperature decrement is only at a level of few hundreds microkelvin even when measured toward clusters with very large and hot IC gas, thus observations of the S-Z effect require a highly sensitive instrument with small and well understood systematic errors. MITO observations are performed with a 2.6 m aplanatic Cassegrain telescope (see Table 2) studied for mm-differential observations. An electromechanical system allows sky modulation in order to reduce fluctuations in the atmospheric emission, while baffling techniques are used to reject spurious signals due to Narcissus effect. At the telescope focal plane is located FotoMITO, a 4-channels single pixel photometer (17 arcmin FWHM). The channels are centered at 2.1 mm,1.4 mm, 1.1 mm and 0.85 mm, matching the atmospheric transmission windows, to accurately measure the spectral signature of the thermal S-Z effect. The detectors are standard composite bolometers, cooled down to 290 mK by a two-stage cycle fridge. The calibrations have been made not only with laboratory sources but also with standard sky calibrators such as planets and HII regions. The measured values for the optical responsivity are reported in Table 3 together with channel characteristics.
Observations of the COMA cluster: preliminary results
Criteria generally followed to select clusters of galaxies for the S-Z signal detection at MITO are: good visibility (,) , large and large angular size (>5 arcmin). A list of nearby clusters proposed for MITO observations is shown in Table 4; the physical parameters are deduced from X-ray data.
Coma cluster (Abell 1656, z = 0.0235) has been the first target in the MITO cosmological project, selected for its good visibility, the high observational efficiency and the high-quality of the existing X-ray measurements. Coma is the richest nearby cluster, with relatively dense and hot IC gas, and only a small degree of apparent ellipticity. In an initial study, we have investigated the efficiency of detecting the S-Z effect as a function of cluster size, field of view, and beamthrow. Moreover, the correlation between the signal morphology and the cluster gas physical parameters has been computed using the isothermal model, and then assuming a circular symmetry on the sky. During the last winter campaign we have collected about 80 drift scans, each 10 minutes long, with a 3-field sky modulation in order to integrate the source and then to improve the signal-to-noise ratio. The residual atmospheric fluctuations have been reduced applying a linear fit removal, a gaussian filter and further decorrelation. A preliminary data analysis leads us a value of the Comptonization parameter along the line of sight through the center of the cluster equal to
Obviously, this estimation is a function of the cosmological parameters involved in theoretical calculations (in particular this value corresponds to ), and this implies a wide range of variability of the effective thermal S-Z signal. However, we find that with a higher value of the Hubble constant, our result better agrees with the expected value of based on the X-ray data. The full analysis procedure and final results will be described in detail in future publications.
The first detection of the S-Z effect dates back to 1972. Parijnskij claimed a detection toward Coma with a temperature decrement of in the radio region. After this first attempt several efforts have been made to improve the accuracy of measurements. A list of all the Coma measurements, with relative results, is reported in Table 5.
6 Conclusions
The actual status of analysis suggests that to improve the accuracy in the Hubble constant determination, using the S-Z effect as a distance scale indicator, we have, first of all, to improve the quality of the X-ray observations and then to reduce systematic errors. For this purpose it will be essential in the near future to develop sensitive new S-Z experiments with these spectral and spatial characteristics: telescope and optical elements whose effective beamsize is few arcminute (so as to resolve the S-Z effect in nearby clusters), equipped with a bolometer array capable of simultaneous observations at several frequencies, both in the R-J and Wien sides. These capabilities are now going to be achieved in the development of both ground-based systems and stratospheric balloons.
References
- [1] Birkinshaw M., 1999, Phys. Rep., 310, 97
- [2] Birkinshaw M., Gull S.F., Northover N.J.E., 1981, MNRAS, 197, 571
- [3] Briel U.G., Henry J.P., Böhringer H., 1992, A&A , 259, L31
- [4] Carlstrom J.E., Mohr J.J., Reese E.D., Holder G.P., et al., 1999, AAS Meeting 194
- [5] Cavaliere A., Fusco-Femiano R., 1976, A&A, 49, 137
- [6] Cavaliere A., Fusco-Femiano R., 1978, A&A, 70, 677
- [7] De Petris M., Gervasi M., Liberati F. 1996, Appl.Opt., 28, 1785
- [8] De Petris M., Aquilini E., Canonico M., D’Addio L., et al., 1996, New Astronomy, 1, 121
- [9] De Petris M., Mainella G., Nerozzi A., de Bernardis P., et al.,1999, New Astron.Rev., 43, 297
- [10] Goobar A., Perlmutter S., 1995, ApJ, 450, 14
- [11] Herbig T., Lawrence C.R., Readhead A.C.S., Gulkins S., 1995, ApJ, 449, L5
- [12] Holzapfel W.L., Wilbanks T.M., Ade P.A.R., Church S.E., et al., 1997, ApJ, 479, 17
- [13] Lake G., Partridge R.B., 1980, ApJ, 237, 378
- [14] Lane A.P., 1998, Proceeding of the ASP Conference Series, 141, 289
- [15] Parijnskij Yu.N., 1973, Sov. Astr., 16, 1048
- [16] Puy D., et al., 2000, A&A in press (astro-ph/0009114)
- [17] Rephaeli Y., 1995a, ApJ, 445, 33
- [18] Rephaeli Y., 1995b, ARA&A, 33, 541
- [19] Rudnick L., 1978, ApJ, 223, 37
- [20] Sarazin C.L., 1988, X-ray emission from clusters of galaxies, Cambridge University Press
- [21] Silverberg R.F., Cheng E.S., et al., 1997, ApJ, 485, 22
- [22] Sunyaev R.A., Zeldovich Ya.B., 1972, Comments Astrophys.Space Phys., 4, 173
- [23] Sunyaev R.A., Zeldovich Ya.B., 1980, ARA&A, 18, 537
- [24] Zeldovich Ya.B., Sunyaev R.A., 1968, Ap&SS, 4, 301
Table 1
| Dome C-Antarctica (summer) | 0.38 |
|---|---|
| South Pole-Antarctica (winter) | 0.19 |
| Mauna Kea-Hawai (winter) | 1.05 |
| Atacama-Chile (winter) | 0.68 |
Table 2
| primary mirror diameter | 2600 mm |
|---|---|
| primary vertex curvature radius | 2494.54 mm |
| primary conic constant | -1.009 |
| primary f/# | 0.48 |
| secondary mirror diameter | 410 mm |
| subreflector vertex curvature radius | 539.78 mm |
| subreflector conic constant | -1.908 |
| vertex interdistance | 1018.7 mm |
| minimum detector f/# | 4.07 |
| effective focal length | 8151 mm |
| focal scale ratio | 25"/mm |
Table 3
| Ch1 | Ch2 | Ch3 | Ch4 | |
| wavelength† (m) | 2000 | 1430 | 1110 | 895 |
| frequency† (GHz) | 150 | 209 | 270 | 335 |
| wavenumber† (cm-1) | 5.0 | 6.9 | 9.0 | 11.2 |
| h/KT | 2.64 | 3.69 | 4.75 | 5.89 |
| bandwidth (FWHM %) | 21 | 14 | 12 | 10 |
| noise (nV/Hz1/2) @3Hz | 10 | 11 | 8 | 27 |
| optical responsivity () |
(† effective values for flat source)
Table 4
| A401 | 0.0737 | 2.37 | 1.08 | |||
| A426 | 0.0179 | 1.16 | ||||
| A478 | 0.0881 | 2.14 | ||||
| A1367 | 0.0214 | 1.0 | 0.13 | |||
| A1656 111Briel et al., 1992 | 0.0231 | 1.51 | ||||
| A1795 | 0.0631 | 1.12 | ||||
| A2029 | 0.0765 | 3.8 | 0.9 | |||
| A2142 | 0.0899 | 3.0 | ||||
| A2163 | 0.2030 | 9.0 | 5.57 | |||
| A2199 | 0.0999 | 0.17 | ||||
| A2255 | 0.0808 | 3.0 | 1.21 | |||
| A2256 | 0.0581 | 1.23 | ||||
| A2319 | 0.0559 | 4.0 | 1.50 |
Table 5
| Reference | ||||||
| 40.0 | 7.5 | 0.7 | P.111Parijnskij, 1973 | |||
| 20.0 | 15.0 | 0.4 | 2.2 | R.222Rudnick, 1978 | ||
| 9.0 | 31.4 | 1.0 | 3.6 | 9 | L.& P.333Lake and Partridge, 1980 | |
| 28.3 | 10.6 | 1.1 | 4.5 | 15 | B. et al.444Birkinshaw et al., 1980 | |
| 9.4 | 32 | 5.7 | 7.35 | 22.16 | H. et al.555Herbig et al., 1995 | |
| 2.1 | 143 | 30.0 | 28 | 666see Birkinshaw, 1999 | S. et al.777Silverberg et al., 1997 | |
| 1.4 | 214 | 30.0 | ||||
| 1.1 | 273 | 32.7 | ||||
| 0.85 | 353 | 35.3 |
Figure 1
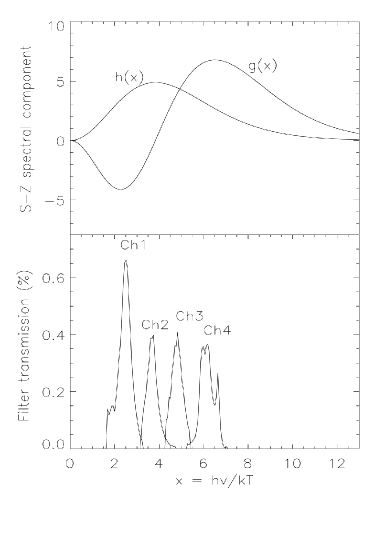
Figure 2
