Radio Properties of REX BL Lacs and Galaxies
Abstract
Detailed VLA observations have been gathered for a number of sources classified as either BL Lacs or galaxies, derived from the REX survey. We focus in particular on the sources identified by us, for which we have in hand homogeneous optical data, to study in more detail than allowed by the NVSS the radio properties of these sources in the framework of AGN unified models.
1Osservatorio Astronomico di Brera, Milano, Italy
2Observatório Astronómico de Lisboa, Lisboa, Portugal
3Istituto di Radioastronomia, Bologna, Italy
4Institute for Astronomy, Honolulu, HI
5Università degli Studi di Milano, Milano, Italy
1. Introduction
The REX survey (Radio Emitting X-ray sources; see Maccacaro et al. 1998, Caccianiga et al. 1999 for details of the survey) is based on pointed ROSAT/PSPC observations and NVSS (NRAO VLA Sky Survey, Condon et al. 1998) data. About 500 of the REX sources have an optical identification obtained working down from the highest X-ray fluxes, in order to have larger and larger completely identified subsamples (see Caccianiga et al., these proceedings for the first results on the Xray–Bright-REX sample of BL Lacs).
| ID | New | Literature | Total |
|---|---|---|---|
| AGN | 96 | 138 | 234 |
| BL+cand. | 40 | 32 | 72 |
| Galaxies | 55 | 121 | 176 |
AGN and BL Lacs are the most common counterparts, followed by galaxies, either isolated or in clusters. The objects without emission lines are classified according to the amount of the CaII discontinuity in our optical spectral data. Values larger than 40% define galaxies. BL Lacs are defined as having a CaII discontinuity smaller than 25%, while objects with CaII discontinuity between 25% and 40% are defined as BL Lac candidates. Most of the galaxy classification from the literature are instead based on the optical extended morphology. In Table 1 we list the updated identification breakdown.
2. Testing unified models
Unified models (see Urry & Padovani 1995 for a review) imply that both radio and optical appearance are governed by the proximity of the line of sight to the radio axis, which is supposed to correspond also to the rotation axis of the accretion disk.
We want to test if the angle to the line of sight is really the primary parameter on which the transition between galaxies and BL Lacs rests. To do so we concentrate on the subsample of non-emission line objects (i.e galaxies, BL Lacs and candidates), in particular those that have been observed by us, since for those objects we have homogeneous optical data. In the radio band, we expect a transition from an extended steep-spectrum source to a dominant flat-spectrum core due to the Doppler boosted foreground jet. In the optical band the direction with respect to the line of sight should be measured by a CaII absorption less and less prominent as the angle decreases, due to the increasing dominance of the non-thermal (synchrotron) component.
We have thus performed VLA observations at two frequencies (20 and 6 cm) in two different configurations. Forty-one objects have been observed in the most resolved configuration (A) and a subset of 35 in B configuration. The objects are almost equally divided in Galaxies (11), BL Lac candidates (12) and “bona-fide” BL Lacs (18), according, as said before, to the measure of the CaII depression. The resolution of these observations ranges from to , depending on the VLA configuration and observing frequency. At the redshift of the observed sample (z ) we are therefore probing structures of the order of a few kpc.
2.1. Core dominance


One of the best indicators of the orientation of the beamed radiation with respect to the line of sight in the radio band is the so-called “core dominance”, , defined as the ratio between the core flux () and the extended flux. In practice, the core flux is defined as the peak of the emission, while the extended flux is the difference between the total integrated flux () and the peak flux:
We compute the core dominance at both 6cm and 20cm for the A configuration data. The first frequency gives the best resolution available in our data, however in many literature papers – from the VLA and comparable size telescopes – the 20cm data are used.
In Figure 1 we plot the distribution of the core dominance at the two frequencies for the different subsamples and for the total sample. Mean values are also reported in the figure. We can compare them with values found in the literature (Morganti et al. 1997; Laurent-Muehleisen et al. 1993) for analogous samples of objects. We have: logR=–1.6 (for a sample of classical FRI); logR=0.04 (for a sample of FRI galaxies, with an extension to fainter objects from the B2 survey); logR=0.05 (Steep Spectrum Quasars); logR=0.5 (1Jy BL Lacs); logR=1.28 (Flat Spectrum Quasars); logR=1.3 (EMSS and HEAO 1 LASS BL Lacs). The fact that different values of are found for the same objects by using the data sets at the two frequencies implies that caution should be taken when comparing different resolution data.

We can explore a larger sample by using catalog data, in particular the FIRST and NVSS data, although not simultaneous, to compute the core dominance for a subset of REX galaxies, BL Lacs and candidates that have not been observed by us at the VLA. We derive somewhat lower values of , since we include in this set also some of the well-known nearby objects. In any case, in this larger subsample there is a trend between isolated galaxies, galaxies in clusters, and BL Lacs (logR = –0.04; 0.28; 0.86, respectively), possibly due to an environment effect because the denser environment in a cluster could constrain the radio emitting gas. However, the overlap in the distribution is large, and the radio galaxies in the REX are definitely more core-dominated than classical FRI.
If and the CaII depression are indicators of orientation, then we expect to find a strong correlation between the two. We plot such function in Figure 2. As evident from the figure, the trend in with CaII break is very marginal (regression coefficient = –0.4) and also the slope of the regression fit is very flat: we obtain –0.01 (thin line) or –0.02 (thick line) by including or excluding the objects in which the CaII depression is not visible in the spectrum, that are set at 0.
2.2. Radio Morphology
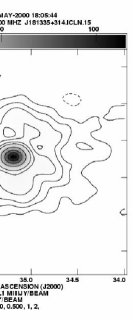
We expect a more complex radio morphology for objects that preferentially lie in the plane of the sky. It was therefore a bit of a surprise to find that most of the resolved objects are classified as BL Lacs or candidates, and not as galaxies. Actually only 10% of the objects have been detected with an extended structure in the most resolved configuration, and so the number of objects under consideration is very small. Furthermore, one of the resolved object, 1REXJ181335+3144, is consistent with the picture of being the core of a BL Lac jet pointed at us, surrounded by a very faint halo, due to the lobe seen in projection (see Figure 3).
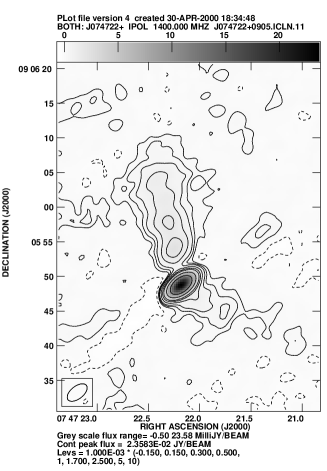
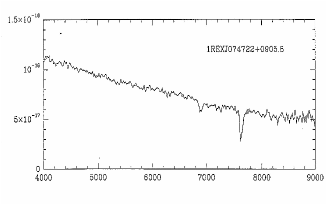
The most striking and unexpected morphology comes from the object shown in Figure 4. This object, 1REXJ074722+0905, as can be seen from the featureless optical continuum, is classified as a BL Lac, with no redshift determination. The prominent structure observed is long. The radio spectral index (defined by ) is –0.6 for the total source, and –0.3 for the core, implying that the extended part is indeed steeper. The extent was already suggested by the NVSS data (with a restoring beam of ), where the source, although described by a single Gaussian component, has an integrated flux about 10% larger than the peak flux. Similar morphologies have been found for a few 1Jy BL Lacs (Cassaro et al. 1999), in particular for 1147+245, for which no emission or absorption lines are seen in the spectrum as in 1REXJ074722+0905. The other 1Jy objects with extended radio structure show both absorption and narrow emission lines in the optical spectrum.
3. Conclusions
From the REX survey we have extracted a number of BL Lacs and galaxies, to study their radio properties in the context of Unified Models. Our results seem to imply that objects classified spectroscopically as galaxies, i.e. that do not have emission lines and have a large predominance of stellar light, as measured form the CaII absorption, are not the same objects that are defined as classical radio galaxies, i.e. with a large radio structure of jets and lobes in the plane of the sky. The resolved morphology contrasts with the BL Lac classification from the optical spectrum in at least one striking case.
The two measures of orientation: core domninance and CaII depression, from the radio and optical band respectively, seem to be only weakly correlated, suggesting that a revision of the unifying models, in which not only the orientation contributes to change one class into the other, might be necessary.
Acknowledgments.
It is a pleasure to thank Greg Taylor for his precious help in reducing the VLA data. This work has received partial financial support from the Italian Space Agency (ASI) and the Italian MURST under grant COFIN98-02-32.
References
Caccianiga, A., et al. 1999, ApJ, 513, 51
Cassaro, P., Stanghellini, C., Bondi, M., Dallacasa, D., Della Ceca, R., and Zappalà, R.A., 1999, A&AS, 139, 601.
Condon, J.J., et al., 1998, AJ, 115, 1693.
Laurent-Muehleisen, S.A., Kollgaard, R.I., Moellenbrock, G.A., Feigelson, E.D., 1993, AJ, 106, 875.
Maccacaro, T., et al. 1998, Astron. Nachr. 319, 15
Morganti, R., Oosterloo, T.A., Reynolds, J.E., Tadhunter, C.N., Migenes, V., 1997, MNRAS, 284, 541.
Urry, C.M. & Padovani, P., 1995, PASP, 107, 803.