The outer-halo globular cluster NGC 6229.
IV. Variable stars
Abstract
We present time-series , photometry of NGC 6229, obtained with the purpose of providing the first extensive CCD variability study of this cluster. As a result, we were able to obtain periods for all NGC 6229 variables, with the exception of five stars from the Borissova et al. (1997) candidate list located very close to the cluster center. Two variable stars suspected by Carney, Fullton, & Trammell (1991) are first-overtone RR Lyrae (RRc) stars, whereas seven of the 12 candidates from Borissova et al. (1997) are confirmed variables—three of them being fundamental RR Lyrae (RRab) pulsators, two first-overtone pulsators, one eclipsing binary (most likely an Algol system) and one bright star whose variability status could not be satisfactorily determined. A new image subtraction method (ISM) suggested by Alard (1999) has been employed which, together with the Welch & Stetson (1993) technique, has allowed us to discover twelve new RR Lyrae variables in the cluster, for which ephemerides are provided. Ten of these are RRab’s, whereas the other two are RRc’s. As originally suggested by Mayer (1961), NGC 6229 is clearly an Oosterhoff type I globular cluster. We also confirm that V8 is a Population II Cepheid of the W Virginis type, and suspect that this is the case for V22 as well.
The physical properties of the NGC 6229 RR Lyrae population are compared against those of M3 (NGC 5272) using several different methods, including a standard period-shift analysis. Possible differences between these two clusters are discussed.
keywords:
stars: fundamental parameters – stars: horizontal branch – stars: Population II – stars: variables: other – Galaxy: globular clusters: individual: NGC 62291 Introduction
In previous papers of this series, we have carried out extensive analyses of the colour-magnitude diagram (CMD) of the outer-halo globular cluster (GC) NGC 6229 (C1645+476). Borissova et al. (1997, hereafter BCSS97) presented the first CMD for the crowded core of the cluster, finding the horizontal-branch (HB) morphology of NGC 6229 to be bimodal, containing a prominent blue tail with at least one ‘gap’. Catelan et al. (1998) carried out a detailed theoretical and statistical analysis of HB bimodality and ‘gaps’ (in NGC 6229 and other GCs). Borissova et al. (1999) obtained the first deep CMD of NGC 6229 clearly identifying the main-sequence turnoff of the cluster, and found its metallicity and age to be very similar to those of M5 (NGC 5904); the possible presence of ‘extreme’ HB stars was also highlighted.
The purpose of the present paper, the fourth in our NGC 6229 series, is to provide the first detailed CCD investigation of the variable star population in this very distant GC.
Using unpublished data obtained by H. Shapley, Davis (1917) reported on the discovery of the first variable star in NGC 6229—the variable currently known as V8. She called attention to the brightness of the variable in comparison with other non-variable stars in the cluster, claiming it to be the second brightest NGC 6229 star when at its maximum. Indeed, Baade (1945) would later rediscover this star and assign it a ‘long-period Cepheid’ status. Baade’s was the first extensive variability study to be published for NGC 6229. It was based on 46 photographic plates obtained in the years 1932-1935 at the Mount Wilson Observatory. By intercomparison of 11 pairs of plates with a blink-comparator, he discovered 20 new variable stars, all ‘of the cluster type’ (i.e., RR Lyrae stars). Sawyer (1953) later extended the list of known variable stars in NGC 6229 to 22 with the report of a (bright) variable star (V22) very close to the cluster core.
None of these papers reported periods for the variables. Mayer (1961) used Baade’s (1945) data to provide periods for 10 of the RR Lyrae variables. Mannino (1960) published extensive photometry for 16 among the 22 known NGC 6229 variables—and, using both his 92 plates (from Asiago, obtained over the years 1956-1957-1958) and Baade’s 46 plates, provided periods for 12 of these stars, assuming that the periods stayed constant between the epochs of his and Baade’s observations. We note that, as a rule, in Sawyer Hogg’s (1973) catalogue Mannino’s periods were adopted, those from Mayer being used only for variables V6, V7, and V17, for which Mannino did not give periods: for V6 and V7, Mannino did not obtain any new data, whereas for V17, and also V3, V4, and V21, he was simply unable to derive representative periods. Therefore, Sawyer Hogg’s catalogue, and also its recent update (Clement 1997), contain periods for all 22 variables except V3, V4, V11, V12, V18, V21, and V22.
More recently, Carney, Fullton, & Trammell (1991, hereafter CFT91), in their CCD analysis of the CMD of NGC 6229, provided single-frame magnitudes and colours for most of Baade’s (1945) variables. In addition to this, they identified two additional stars as likely variables (see also Searle & Zinn 1978), besides four other stars for which there was some evidence for photometric variability. Finally, BCSS97, using the Kadla & Gerashchenko (1982) method and a wavelet transform technique to allow CCD photometry in the very dense core of this GC, provided a list containing an additional 12 RR Lyrae variable candidates.
In the present paper, we will provide the first CCD light curves for all previously known or suspected/confirmed variables in NGC 6229.111For V3, which is outside our observed field, we shall determine the period and variability class on the basis of the data published by Mannino (1960). Besides, using a new and very powerful ‘image subtraction method’ (ISM) developed by Alard (1999)—the isis package—we will also provide light curves for twelve new variables discovered in the course of the present investigation.
We begin in the next section by describing our observations and data reduction techniques. In Section 3, the light curves and the variables’ main parameters (periods, colours, magnitudes, amplitudes), as obtained using both daophot and isis, are provided. In Section 4, Blazhko stars are identified. In Section 5, the Bailey (period-amplitude) diagram is discussed. In Section 6, Fourier decomposition of the light curves is used to derive the stellar physical parameters, following methods developed by Simon and Clement (RRc stars) and by Kovács and Jurcsik (RRab stars). In Section 7, the nature of a few particularly noteworthy cluster variables is discussed. Finally, our concluding remarks are presented in Section 8.
2 Observations and data reduction
2.1 Observations
Time-series photometry was obtained during the interval 1997 June 28 - 1999 September 26 with the 2m Ritchey-Chrétien telescope of the Bulgarian National Astronomical Observatory ‘Rozhen’ with a Photometrics CCD camera. The scale at the Cassegrain-focus CCD was and the observing area was , centered on the cluster centre.
Approximately 200 and frames were obtained, with exposure times ranging from 120 to 300 sec. The seeing during these observations was between and .
2.2 Data reduction: daophot
All frames were reduced using daophot (Stetson 1993) and transformed to the standard system independently. In the cases when the seeing was not stable the data were discarded. The data reduction and absolute photometric calibration of the frames are the same as those obtained and used for the construction of the deep CMD of NGC 6229 (Borissova et al. 1999). The internal error of each measurement for the stars in NGC 6229 depends on the seeing and crowding conditions and is on average mag for mag and mag. For more details on the error and completeness analysis, see BCSS97 and Borissova et al. (1999). A comparison with the photometry of CFT91 for the non-variable stars in the magnitude interval mag shows that the two datasets are in good agreement, although in some frames we cannot exclude systematic zero point differences, though not larger than 0.02–0.03 mag. When possible, datapoints from the photometry lists of CFT91 and BCSS97 were included in the present investigation.
In order to search for new variables in the studied field of NGC 6229, we applied the Welch & Stetson (1993) method. Since we have observations made nearly simultaneously in two passbands ( and ) and in several different epochs separated at least by a month, we can calculate the Welch & Stetson variability index ‘’ for all stars. As a result, two previously unknown variable stars—V37 and V38—were detected. They are both fundamental RR Lyrae pulsators (see below).
2.3 Data reduction: isis
Alard (1999) and Alard & Lupton (1998) presented a new ISM (‘isis’) aimed at obtaining better light curves in crowded fields such as GC cores. The capabilities of the method have recently been demonstrated by Olech et al. (1999) in a study of variable stars in the core of M5.
In order to improve the quality of the light curves of the known variables in NGC 6229 and to search for new variables, all our CCD frames were re-reduced using Alard’s (1999) code. Ours is one of the very first applications of the method in a study of stellar variability in GCs.
Twenty-nine of our RR Lyrae stars have magnitudes measured using both the standard daophot package (which places them in the standard Johnson system) and the non-standard isis package (which is only capable of providing relative fluxes, measured in ADU). We have used the and magnitudes for such stars in order to try to obtain transformation equations linking standard magnitudes and isis fluxes. As far as we are aware, such a discussion has not been presented in the literature so far, the isis results usually being reported in ADU only (see, e.g., Olech et al. 1999 in the case of M5).
Unfortunately, for most of our stars, the transformations appear to be affected by some non-linearity. More specifically, the brightest point in the light curves, as obtained in the standard system, usually appears fainter than that calculated from the ISM fluxes. If, as a first approximation, we use a linear transformation of the form (where represents ISM magnitudes in or ), the coefficient turns out to be 0.00007 and 0.00014 for the and filters, respectively, and appears to be fairly uniform for our RR Lyrae sample. The zero-point coefficients , however, do seem to vary slightly from star to star, so that we cannot convert the ISM fluxes into their Johnson-equivalent magnitudes in an entirely consistent way. In the present paper, for the RR Lyrae stars which were measured only with isis, approximate ISM-based and magnitudes were obtained using the value stated above; the adopted was taken from the standard magnitude measured in the reference frames.
These problems notwithstanding, our analysis clearly indicates that isis is an extremely powerful tool to detect new variables and determine their periods, particularly in very crowded fields. Indeed, applying the method to NGC 6229, all known variables in our observed field (which excludes only V3) were rediscovered, and light curves of as many as ten previously unknown variables were obtained. We label these new discoveries V39–V48 in what follows.
3 Periods and light curves
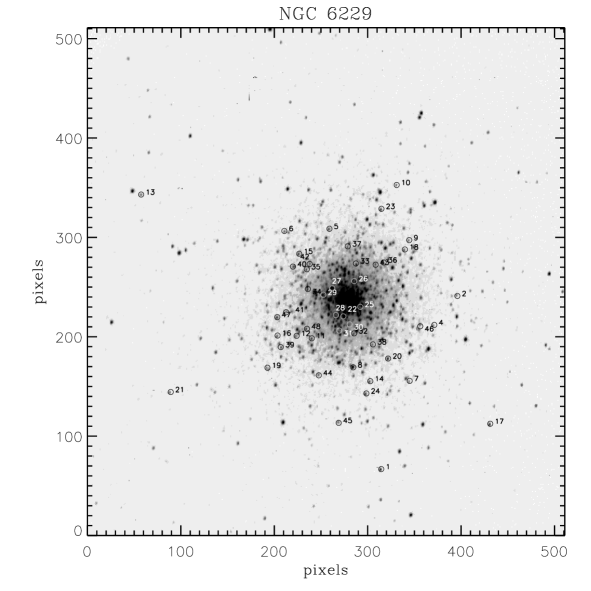
Our ‘target list’ contains 50 variable and possible variable stars based on Baade (1945), Sawyer (1953), CFT91, BCSS97 and the present work (see Sect. 2). We have reanalysed the periods of all Baade stars and determined the periods of suspected ones using a least-squares periodogram analysis by means of the phase dispersion minimization (PDM) task available in iraf and a period-finding program based on Lafler & Kinman’s (1965) ‘theta’ statistic. We obtained new light curves and re-derived the periods for 20 variable stars listed in Sawyer Hogg’s (1973) catalogue, and also the first light curves for RR Lyrae candidates No. 155 and No. 88 from CFT91 and 3, 7, 8, 9, 10, 11 and 12 from BCSS97. We have not detected any significant variability (at a level ) for the stars No. 4, No. 105 and No. 134 suspected by CFT91. A finding chart for the NGC 6229 variables is provided in Fig. 1.
The and RR Lyrae light curves obtained with daophot are displayed in Fig. 2 and Fig. 3, respectively.


| Name | Type | Period | |||||||||
| () | () | (d) | |||||||||
| V1 | RRab | 0.5857029 | 18.23 | 17.89 | 0.36 | 0.34 | 0.38 | 1.35 | 1.06 | ||
| V2 | RRab | 0.5552525 | 18.41 | 18.06 | 0.38 | 0.35 | 0.38 | 1.20 | 1.00 | ||
| V3 | RRab222Data from Mannino (1960). | 0.575218 | |||||||||
| V4 | RRab333Blazhko variable (see text). | 0.5662155 | 18.44 | 18.09 | 0.38 | 0.35 | 0.39 | 1.15 | 0.75 | ||
| V5 | RRabb | 0.53358874 | 18.51 | 18.14 | 0.43 | 0.37 | 0.40 | 1.30 | 0.95 | ||
| V6 | RRabb | 0.559340 | 18.46 | 18.09 | 0.44 | 0.37 | 0.41 | 1.15 | 0.82 | ||
| V7 | RRabb | 0.501600 | 18.42 | 18.05 | 0.42 | 0.37 | 0.44 | 1.13 | 1.05 | ||
| V8 | W Vir | 14.840457 | 16.29 | 15.53 | 0.79 | 0.76 | 0.78 | 1.05 | 0.77 | ||
| V9 | RRab | 0.542844 | 18.36 | 17.93 | 0.40 | 0.43 | 0.39 | 1.00 | 0.82 | ||
| V10 | RRab | 0.554745 | 18.56 | 18.16 | 0.43 | 0.40 | 0.44 | 0.92 | 0.90 | ||
| V11 | RRab | 0.563226 | 18.57 | 18.16 | 0.43 | 0.41 | 0.43 | 1.17 | 0.94 | ||
| V12 | RRab | 0.490825 | 18.37 | 18.01 | 0.36 | 0.36 | 0.35 | 1.68 | 1.30 | ||
| V13 | RRab | 0.547345 | 18.47 | 18.07 | 0.42 | 0.40 | 0.44 | 1.09 | 0.99 | ||
| V14 | RRab | 0.46592798 | 18.27 | 17.91 | 0.43 | 0.36 | 0.43 | 1.38 | 1.10 | ||
| V15 | RRc | 0.2713766 | 18.37 | 18.14 | 0.25 | 0.23 | 0.28 | 0.67 | 0.56 | ||
| V16 | RRc | 0.32274493 | 18.32 | 18.06 | 0.28 | 0.26 | 0.23 | 0.63 | 0.48 | ||
| V17 | RRc | 0.325193 | 18.16 | 17.94 | 0.22 | 0.22 | 0.22 | 0.61 | 0.47 | ||
| V18 | RRabb | 0.579080 | 18.55 | 18.15 | 0.43 | 0.40 | 0.42 | 0.90 | 0.65 | ||
| V19 | RRab | 0.475948 | 18.30 | 17.97 | 0.37 | 0.33 | 0.36 | 1.42 | 1.35 | ||
| V20 | RRabb | 0.465963 | 18.53 | 18.16 | 0.40 | 0.37 | 0.41 | 1.60 | 1.30 | ||
| V21 | RRab | 0.564440 | 18.38 | 17.99 | 0.39 | 0.39 | 0.46 | 1.00 | 0.83 | ||
| V22 | W Vir?444See Sect. 7.2. | 15.8373 |
Using the same statistical approach—the PDM task and Lafler-Kinman’s ‘theta’ statistic—we analyzed relative ISM fluxes of all variables. In general, we recovered the same periods obtained with daophot, but in some cases we were able to improve the derived periods significantly. The light curves in ISM relative fluxes, as obtained from the and data for the RR Lyrae stars using isis, are displayed in Fig. 4 and Fig. 5, respectively.
The quality of the light curves, particularly for the variable stars in the inner regions of NGC 6229, is noticeably better in the isis than in the daophot case (compare, e.g., V36 in Fig. 2 and Fig. 4). However, even with isis we could not obtain representative light curves for candidates numbered 1, 2, 4, 5 and 6 by BCSS97. All these stars are less than 0.3 arcmin from the cluster centre (see Fig. 1) and cannot be resolved on our moderate quality CCD material for this very distant and fairly dense GC. However, with the exception of BCSS97–1, a few of our best ISM-subtracted images do show signs of photometric variability for these stars, which thus remain likely variable candidates. Follow-up studies are clearly needed to verify these stars’ variability status.
| Name | CFT91 | Type | Period | |||||||||
|---|---|---|---|---|---|---|---|---|---|---|---|---|
| name | () | () | (d) | |||||||||
| V23 | No. 88 | RRc | 0.397702 | 18.23 | 17.91 | 0.33 | 0.32 | 0.31 | 0.47 | 0.42 | ||
| V24 | No. 155 | RRc | 0.3034368 | 18.33 | 18.07 | 0.27 | 0.26 | 0.27 | 0.60 | 0.46 |

In Figs. 2–5, the variable stars are plotted in order of increasing period to illustrate the changes in the light curves with period. The difference in light curve shape for stars with periods greater than compared with those with shorter period is obvious. Nine variables (V15, V16, V17, V23, V24, V32, V36, V44, V47) can be classified as RRc stars (i.e., first overtone pulsators). The light curves of the remaining 29 variables are more asymmetric and have larger amplitudes, and these are undoubtedly RRab Lyrae stars.
| Name | BCSS97 | Type | Period | |||||||||
|---|---|---|---|---|---|---|---|---|---|---|---|---|
| name | () | () | (d) | |||||||||
| V27 | 3 | ? | 1.13827 | 17.13 | 16.78 | 0.37 | 0.35 | 0.38 | 0.82 | 0.79 | ||
| V31 | 7 | Algol? | 0.698893 | 17.62 | 17.39 | 0.26 | 0.23 | 0.24 | 1.14 | 1.00 | ||
| V32 | 8 | RRc555Field variable? See Sect. 7.1. | 0.376498 | 18.58 | 18.27 | 0.34 | 0.31 | 0.38 | 0.45 | 0.43 | ||
| V33 | 9 | RRab666Blazhko variable (see text). | 0.517568 | 18.52 | 18.03 | 0.43 | 0.49 | 0.48 | 1.29 | 1.06 | ||
| V34 | 10 | RRabb | 0.555426 | 18.24 | 17.92 | 0.32 | 0.32 | 0.29 | 1.04 | 0.94 | ||
| V35 | 11 | RRabb | 0.634493 | 18.60 | 18.16 | 0.45 | 0.44 | 0.45 | 0.40 | 0.32 | ||
| V36 | 12 | RRc | 0.264131 | 18.33 | 18.07 | 0.26 | 0.26 | 0.27 | 0.47 | 0.40 |
Table 1 contains the list of variable stars discovered by Davis (1917), Baade (1945), and Sawyer (1953). Column (1) lists the star number from Sawyer Hogg’s (1973) catalogue, and column (2) gives the variability type of the star. Stars identified as Blazhko variables are noted. In columns (3) and (4), we give the and coordinates (in arcsec) in the Sawyer Hogg (1973) system. Column (5) provides the period in days. Columns (6) and (7) give the intensity-mean magnitudes in and , respectively; those values were obtained by directly averaging over the pulsation cycle in intensity. Likewise, columns (8) and (9) provide the intensity-mean colours (obtained by directly averaging over the colour curves in intensity units) and [simply obtained by subtracting the values in column (7) from those in column (6)]. Column (10) gives the magnitude-weighted mean color, , of the stars. Finally, columns (11) and (12) provide the estimated amplitudes in and , respectively.
In order to derive the mean magnitudes and colours, the and light curves were fitted by smooth curves (e.g., Carretta et al. 1998). The smoothing was performed on the light curves in intensity units using polynomials of various orders. For each star, the ISM light curves were also taken in consideration, but only in the sense that all points in the and light curves which clearly deviate from their corresponding ones in the ISM light curves were simply rejected.
| Name | Type | Period | |||||||||
| () | () | (d) | |||||||||
| V37 | RRab777Blazhko variable (see text). | 0.519216 | 18.32 | 17.96 | 0.38 | 0.36 | 0.43 | 1.17 | 0.92 | ||
| V38 | RRaba | 0.522193 | 18.52 | 18.10 | 0.43 | 0.42 | 0.47 | 1.55 | 1.05 | ||
| V39 | RRab | 0.499279 | 18.4: | 18.2: | 0.2: | 0.8: | 0.8: | ||||
| V40 | RRaba | 0.591399 | 18.7: | 18.3: | 0.4: | 0.6: | 0.6: | ||||
| V41 | RRaba | 0.634668 | 18.7: | 18.3: | 0.4: | 0.3: | 0.3: | ||||
| V42 | RRab | 0.621752 | 18.9: | 18.4: | 0.5: | 0.5: | 0.5: | ||||
| V43 | RRab | 0.567657 | 18.5: | 18.1: | 0.4: | 1.3: | 1.1: | ||||
| V44 | RRc | 0.357335 | 18.6: | 18.3: | 0.3: | 0.5: | 0.5: | ||||
| V45 | RRab | 0.640064 | 18.6: | 18.2: | 0.4: | 0.5: | 0.4: | ||||
| V46 | RRaba | 0.638804 | 18.5: | 18.0: | 0.5: | 0.2: | 0.2: | ||||
| V47 | RRc | 0.333933 | 18.1: | 17.8: | 0.3: | 0.6: | 0.5: | ||||
| V48 | RRaba | 0.516412 | 18.2: | 17.9: | 0.3: | 0.5: | 0.4: |
We employed Layden’s (1998) ‘light-curve templates’ technique to assist us in deriving the RRab amplitudes. Layden only provided templates in the band. In order to derive the amplitudes, we utilized his templates as well, given the similarity in shape of the normalized light curves. We tested the accuracy of the procedure by applying the templates to a sample of RRab stars with very well-defined light curves from the literature, encompassing a wide variety of light curve shapes. The stars included are V9 in 47 Tuc; V3, V7, V10 and V13 in M2 (NGC 7089); V8 and V28 in M5; V4, V5 and V8 in M92 (NGC 6341); and the field star SW Draconis. The data were obtained from the following sources. 47 Tuc: Carney, Storm, & Williams (1993); M2: Lee & Carney (1999); M5: Storm, Carney, & Beck (1991); M92: Carney et al. (1992); SW Dra: Jones et al. (1987). As a rule, we found that the amplitudes of these stars were successfully reproduced using the normalized templates from Layden. The mean difference between the values tabulated in the quoted papers and those derived using the template approach is essentially negligible, mag (standard deviation). However, we recommend that the templates are not used to infer mean magnitudes and colours, since there is a noticeable difference in shape between normalized and light curves at intermediate phases, . In Figs. 2 and 3, we overplot the best-fitting light curves obtained from Layden’s templates on data for the RRab stars with ‘regular’ light curves (see below).
The entries in Tables 2, 3 and 4 have essentially the same meaning as in Table 1, though the following should be noted. In Tables 2 and 3, new ‘V’ numbers, starting from the last entry in Sawyer Hogg’s (1973) catalogue, are assigned in order of discovery. For ease of reference, cross-identification with the numbers given in CFT91 and BCSS97 is also provided. Not listed are the BCSS97 candidates 1, 2, 4, 5, and 6; however, for future reference, we assign to these likely variable stars the numbers V25, V26, V28, V29, and V30, respectively.
Specifically in regard to the new variable stars (V39–V48) that we have identified using isis (Table 4), estimates of amplitudes inferred from the minimum and maximum values of the relative fluxes are given (see Sect. 2.3 for a discussion). For these stars, ‘mean’ and magnitudes and colours are given for reference purposes only, and are based solely on our best image pair. All these uncertain values are marked with a colon in Table 4 and must not be used except with the purpose of assessing the variability type. In any case, it is interesting to note that the RRab stars discovered using isis tend to have smaller amplitudes and longer periods than the bulk of the NGC 6229 RRab variables.
To check the above derived ephemerides, the intensity-mean magnitudes as a function of are overplotted on the CMD of NGC 6229 in Fig. 6. As pointed out by Preston (1961) and Sandage (1990), is the most appropriate colour to characterise the temperature of an ‘equivalent static star’. The NGC 6229 ridgelines are from Borissova et al. (1999); for the red HB, it represents the lower envelope of the distribution.
Filled squares denote the RRc stars, and open circles correspond to RRab stars. The filled circles represent the known Population II Cepheid in the cluster (V8), as well as V27 and V31—whose variability status we will discuss in more detail below.
The mean and magnitudes for all RR Lyrae stars (except V32, which may be a field variable, and in any case is an outlier; see below) for which we have reliable daophot light curves are mag and mag, respectively—where the standard deviation of the mean is given. The latter value is in good agreement with the HB level ( mag) obtained by Borissova et al. (1999; see their Fig. 6) as an estimate of the lower envelope of the non-variable red HB stars’ distribution in the NGC 6229 CMD. The mean colour of the RRc stars (except V32 and the ISM stars for which we do not have reliable daophot photometry) is mag, whereas mag for the RRab’s.
Figure 6 suggests that there is some overlap between the RRab’s and non-variable red HB stars in NGC 6229. However, part of this effect appears to be due to the fact that the red HB ‘ridgeline’ in Fig. 6 of Borissova et al. (1999) was indeed extended towards bluer colours than would be appropriate for a detailed comparison with RR Lyrae colours such as the one we are presently carrying out; a star-by-star analysis shows that the overlap is indeed relatively small. In order to determine the blue and red edges of the instability strip, we followed a procedure similar to that of Walker (1994). Accordingly, the blue edge of the instability strip comes from an average between the two bluest variables and the two reddest non-variables on the blue HB, giving mag. The red edge is similarly derived by averaging over the five reddest variables and the five bluest among the non variables on the red HB, which gives mag. Also, a ‘boundary’ between the RRc and RRab variables can be placed at mag; there is little, if any, overlap between RRc’s and RRab’s in NGC 6229. A reddening value mag was assumed (Harris 1996).
The periods of RRc stars are between and , with a mean value . The periods of RRab stars are between and , with a mean value . In addition, the fraction of c-type RR Lyrae variables is . All these values are in excellent agreement with NGC 6229’s classification as an Oosterhoff type I (OoI) GC, as first suggested by Mayer (1961; see also Castellani & Quarta 1987).
4 ‘Anomalous’ stars, Blazhko variables and period changes
RR Lyrae stars in GCs, particularly those pulsating in the fundamental mode (i.e., RRab’s), often show non-repeating light curves, which is characteristic of the Blazhko effect (e.g., Smith 1995). To identify possible Blazhko variables, we used the method derived by Jurcsik & Kovács (1996), which allows one to identify variables with ‘anomalous’ light curves (often because of the Blazhko effect) from analysis of their Fourier decomposition parameters. In this method, a ‘deviation parameter’ is introduced which measures the extent to which any given Fourier parameter ‘predicted’ from empirical interrelations among the several other Fourier parameters (such relations being based on a large calibrating sample of RRab stars, mostly in the field) match the actual value of the Fourier parameter for the star. Jurcsik & Kovács argue that if the deviation in any of the Fourier parameters can be characterised by , the star has a ‘peculiar’ light curve. More recently, Walker & Kovács (2000) have favoured a more restrictive criterion, .
Fourier decompositions of the light curves were carried out following Simon & Teays (1982). Fourier decomposition amplitudes to and phase differences to were explicitly calculated for use with the Kovács & Kanbur (1998) relations. This was done independently using both standard magnitudes (derived from daophot) or ISM relative fluxes (derived from isis; see Sect. 2). We excluded from our analysis stars which have prominent ‘gaps’ in phase at the maximum of the light curve—cf. V10 and V39 in Figs. 3 and 4. We note that the method has been calibrated using light curves derived for standard magnitudes only (Jurcsik & Kovács 1996; Kovács & Kanbur 1998), so that the approach is not strictly applicable to identify ‘anomalous’ stars using our ISM light curves. However, since the Fourier phases and the Fourier amplitudes (except ) do not appear to vary dramatically from one case to the other—in spite of some small differences—we shall assume that the calibrating equations remain valid in the case of isis-based ‘ magnitudes’ as well.
From this analysis we identified 15 stars with which can accordingly be classified as variables with ‘peculiar’ light curves: V4, V5, V6, V7, V18, V20, V33, V34, V35, V37, V38, V40, V41, V46 and V48. For some of these stars, as previously stated, light curves are available from Baade (1945) and Mannino (1960), thus allowing us to directly check for the possible presence of amplitude and/or period changes. To achieve this goal, Baade’s photographic (ph) magnitudes were transformed to the Johnson filter using 15 comparison stars from Baade’s Table 6, whereas Mannino’s were placed by Mannino himself on Baade’s system. The periods of these variables were re-derived following the same approach as for our CCD data (see Sect. 3 above).
Comparison between the periods that we derived from Baade’s (1945) and Mannino’s (1960) data and those listed in Sawyer Hogg’s (1973) catalogue reveals differences which are generally less than . Since the estimated errors of our period determination are , we will consider these differences within the (combined) errors and thus consider the periods listed by Sawyer Hogg for these 15 stars as being satisfactory at (error of period determination). As previously stated, these periods were determined by Mannino and by Mayer (1961).
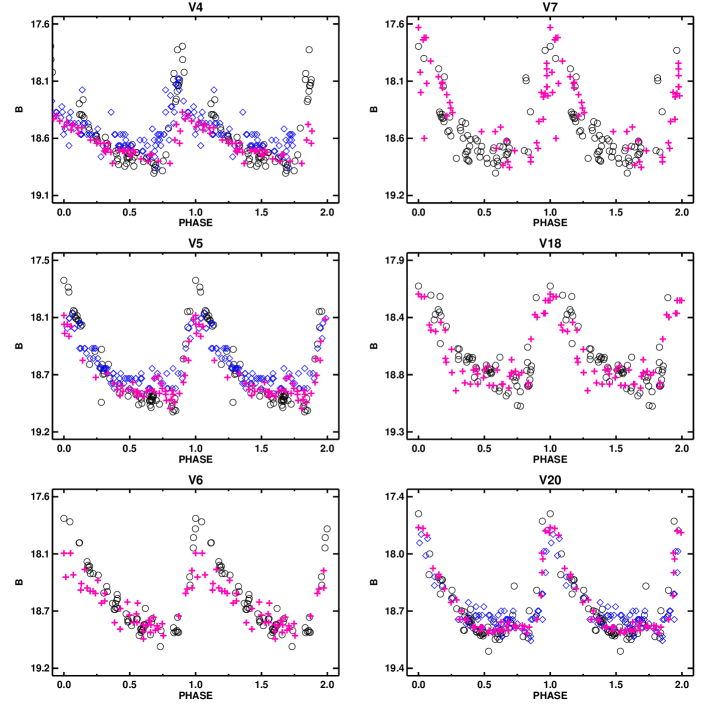
Light curves for the ‘anomalous’ variables V4, V5, V6, V7, V18 and V20 are shown in Fig. 7. Baade’s (1945) data are overplotted with plus signs, and Mannino’s data with lozenges. Except for V7—no data available from Mannino (1960)—the amplitude changes for all these stars are obvious; they are clearly Blazhko variables. In Table 5, we quantify the change in amplitudes as derived from Baade’s and Mannino’s photographic data and our CCD material. The error range of amplitude values obtained as a combination of photometric errors, period determination and standard fit of the light curves is not larger than mag; hence the amplitude changes appear to be significant at . Interestingly, all amplitudes are found to be increasing.
For classification purposes, in Tables 1–4 we have assumed that all RRab variables with are Blazhko variables (cf. Jurcsik & Kovács 1996, especially their Sect. 4.2). However, the possibility cannot be excluded that there are Blazhko stars whose values never become larger than , especially if the amplitude modulation is not too strong (Jurcsik 2000). In fact, we note that the RRab Lyrae V34 in M3 is a Blazhko variable (Carretta et al. 1998; Clement 1997 and references therein), whereas Kaluzny et al. (1998) have recently obtained from their light curve for this star. Conversely, it is well known that there are stars with which are not Blazhko variables (see Table 8 in Jurcsik & Kovács 1996).
| Name | |||||
|---|---|---|---|---|---|
| (Baade 1945) | (Mannino 1960) | (this work) | (Baade–this work) | (Mannino–this work) | |
| V4 | 0.53 | 0.70 | 1.15 | ||
| V5 | 0.70 | 0.79 | 1.30 | ||
| V6 | 0.68 | 1.15 | |||
| V18 | 0.66 | 0.90 | |||
| V20 | 1.14 | 1.14 | 1.60 |
In general, comparison between the periods listed in Sawyer Hogg’s (1973) catalogue and those derived from our CCD data shows that most of them agree to within . Possible significant period changes are found for only two variables: V7 (RRab) and V17 (RRc). For V7 (V17), Sawyer Hogg lists a period of (). Using Baade’s (1945) data we obtain (), whereas the period obtained from our CCD data is (). No significant improvement is found for V17 using Mannino’s (1960) data, due to its poor quality—Mannino himself was unable to find a period for this star. The calculated difference for V7 and V17 are and , respectively. Unfortunately, the reality of these period changes cannot be considered definite, since we do not have enough data to construct residuals and determine the type and rate of period changes. It should be of interest to assemble all the datasets available for this cluster (cf. Davis 1917; Baade 1945; Sawyer 1953; Mannino 1960; and the present work) in order to study the period change rates in NGC 6229, given the constraints that these can provide on stellar evolution, particularly on the HB phase (Smith 1995 and references therein). This will be the subject of a future paper.
5 The Bailey diagram revisited
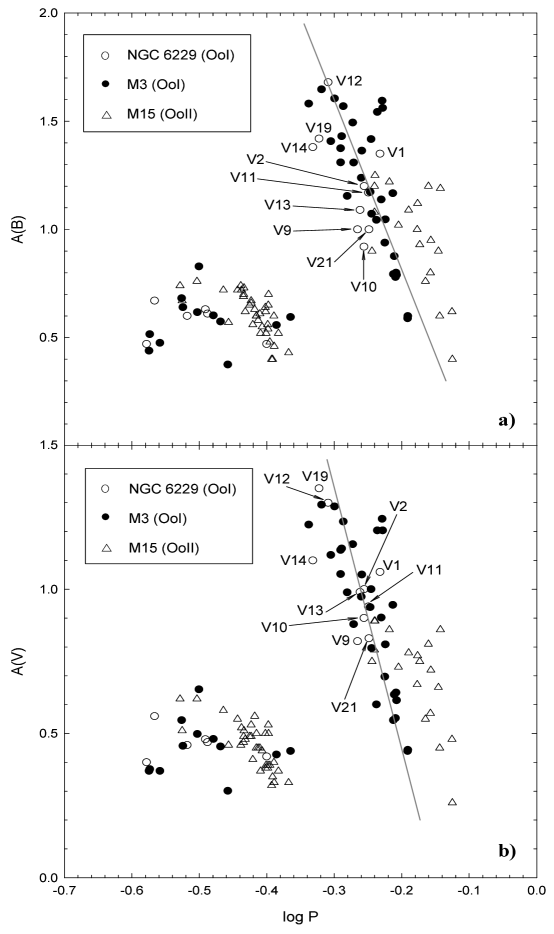
In Fig. 8, the Bailey diagram is plotted. Individual stars are identified for ease of reference. Panel a) shows the period- amplitude distribution, whereas panel b) corresponds to the period- amplitude distribution. RRc variables (short periods and low amplitudes) stand out clearly from their RRab counterparts in this diagram. NGC 6229 variables from Tables 1, 2, and 3 are shown as open circles. Only RRab stars with are displayed; the only exception is V10, for which we have not computed a value (cf. Sect. 4). Comparison between our light curves and those based on the data from Baade (1945) and Mannino (1960) does not show any sign of amplitude variations at the mag level, which suggests that V10 is not a Blazhko variable.
Also plotted are M3 stars (data from Carretta et al. 1998) and M15 (NGC 7078) variables (data from Bingham et al. 1984, as selected by Catelan 1998). As well known, these GCs are typical representatives of the OoI and OoII classes, respectively. M3 stars are shown as solid circles, whereas open triangles indicate the M15 variables. As was done in the case of M15 by Catelan, we have removed all M3 stars that Carretta et al. explicitly note to be (possible) Blazhko variables, as well as M3 variables identified as showing the Blazhko effect in Clement’s (1997) catalogue. In addition, we cross-checked the Carretta et al. and Kaluzny et al. (1998) lists to identify possible stars in common between the two studies with large values. None was found. As already mentioned though, we found that V34, which is a Blazhko variable according to Carretta et al. and Clement’s catalogue, has a very small value—which might have led one to conclude that it has a ‘normal’ light curve. V34 was also excluded from Fig. 8.
It is immediately clear that there is a period shift (at fixed amplitude) between NGC 6229 and M3 RRab variables, in the sense that M3 stars have longer periods than their NGC 6229 counterparts. This is more easily noticed when we overplot the lines that best fit the M3 data, obtained following the ‘OLS bisector’ method as appropriate in this case (cf. Isobe et al. 1990):
Most NGC 6229 RRab stars with regular light curves fall below these best-fitting M3 lines, indicating shorter RRab periods at a given amplitude than is the case for M3. Surprisingly, the size of the resulting period shifts is not the same when the and amplitudes are considered. In the former case, one finds a mean period shift for the 10 RRab stars (in the sense NGC 6229 minus M3) of (standard error of the mean); in the latter, one has instead . Given the slopes of the M3 period-amplitude relations, such a difference could be accounted for if the amplitudes were too large by mag, or if the amplitudes were too small by mag (or some combination thereof). We believe that better data will be necessary before the cause of this difference can be fully explained. We shall assume that the mean between the two values, , is a good indicator of the actual period shift between the two clusters.
Fundamental-mode blue amplitudes and temperatures appear to be closely related (Sandage 1981a, 1981b; Jones et al. 1992; Catelan 1998; Sandquist 2000). Therefore, period shifts at constant blue amplitude can be interpreted as period shifts at (approximately) constant temperature. From the period-mean density relation (van Albada & Baker 1971), it thus follows that the detected period shift must be due to luminosity and/or mass differences between M3 and NGC 6229 variables. Assuming similar masses for the variables in the two clusters, this implies that the M3 variables might be brighter than their NGC 6229 counterparts by mag. It is worth noting that such luminosity differences at a fixed metallicity, if indeed present, can only be caused by variations in ‘second-parameter’ candidates other than age or mass loss on the red giant branch, with possible implications for our understanding of the ‘HB bimodality’ phenomenon (e.g., Catelan, Sweigart, & Borissova 1998). On the other hand, the period shift could also, at least in principle, be due to a mass difference between the RR Lyrae variables in the two GCs. At a fixed luminosity, a mass difference , in the sense that M3 variables are less massive, would be required in this case.
We recall, from Borissova et al. (1999), that NGC 6229 appears to have virtually the same metallicity as M5. On the other hand, it is quite well established that M5 is more metal-rich than M3 by dex (see Jurcsik 1995 and references therein). Therefore, contrary to Clement & Shelton (1999), our results suggest that there is no universal, metallicity-independent ‘OoI line’ in the period-amplitude diagram. However, we cannot exclude some systematic effect due to our relatively small number of RRab stars with regular light curves and/or to uncertainties in the derived amplitudes. Better data for NGC 6229 are needed before this issue can be settled with certainty. We mention, in passing, that Kaluzny et al. (2000) have recently claimed that the period- amplitude diagram is indeed a function of metallicity, based on their M5 analysis.
6 Physical properties of RR Lyrae stars from their Fourier parameters
6.1 RRc stars
Simon & Clement (1993) used light curves of RRc stars obtained from hydrodynamic pulsation models to derive equations to calculate mass, luminosity, temperature and a ‘helium parameter’ as a function of the Fourier phase difference and period. From their equations (2), (3), (6) and (7), we computed these quantities using the Fourier decomposition parameters obtained from our CCD light curves. They are given in Table 6. Note that the ‘helium parameter’ does not provide a good description of the helium abundance (Simon & Clement 1993).
| Name | Mass | |||||||
|---|---|---|---|---|---|---|---|---|
| () | (K) | |||||||
| V15 | 18.14 | 0.249 | 3.512 | 0.512 | 1.62 | 7526 | 0.30 | 0.04 |
| V16 | 18.02 | 0.178 | 3.077 | 0.625 | 1.72 | 7297 | 0.26 | 0.26 |
| V17 | 17.96 | 0.212 | 3.120 | 0.620 | 1.72 | 7294 | 0.26 | 0.07 |
| V23 | 17.93 | 0.175 | 4.146 | 0.532 | 1.75 | 7178 | 0.26 | 0.03 |
| V24 | 18.08 | 0.206 | 3.239 | 0.581 | 1.68 | 7379 | 0.28 | 0.04 |
| V32 | 18.21 | 0.076 | 3.513 | 0.602 | 1.76 | 7188 | 0.25 | 0.17 |
| Name | Mass | ||||||
|---|---|---|---|---|---|---|---|
| () | (K) | ||||||
| V15 | 0.184 | 3.499 | 0.514 | 1.62 | 7524 | 0.30 | 0.03 |
| V16 | 0.140 | 3.499 | 0.562 | 1.70 | 7337 | 0.28 | 0.04 |
| V17 | 0.175 | 3.564 | 0.555 | 1.70 | 7335 | 0.28 | 0.02 |
| V23 | 0.192 | 3.512 | 0.624 | 1.79 | 7119 | 0.25 | 0.04 |
| V24 | 0.158 | 3.832 | 0.500 | 1.65 | 7435 | 0.30 | 0.03 |
| V32 | 0.076 | 3.320 | 0.637 | 1.78 | 7158 | 0.25 | 0.08 |
| V36 | 0.152 | 3.649 | 0.487 | 1.60 | 7569 | 0.31 | 0.04 |
| V44 | 0.168 | 3.171 | 0.644 | 1.76 | 7199 | 0.26 | 0.03 |
| V47 | 0.205 | 3.611 | 0.555 | 1.70 | 7312 | 0.28 | 0.03 |
We exclude from our analysis V36 due to its irregular light curve and hence large error. V16 is another variable with an irregular light curve and relatively large .
Excluding V32 (see below), the unweighted mean values and standard deviations of the mass , luminosity , effective temperature and ‘helium parameter’ are: , , K and , respectively. For comparison purposes, we find, from the latest VandenBerg et al. (2000) -enhanced zero-age HB (ZAHB) models, at K, the following values: for (NGC 6229 metallicity in the Zinn & West 1984 scale; cf. Borissova et al. 1999), , ; for (NGC 6229 metallicity in the Carretta & Gratton 1997 scale; cf. Borissova et al. 1999), , . As can be seen, the Simon & Clement (1993) method favours the ‘long’ Pop. II distance scale, providing higher HB luminosities than those predicted by VandenBerg et al. (2000).
The same analysis was carried out using the ISM (isis) light curves, and the results are presented in Table 7. Note the remarkable decrease in for V16 and V32 from Table 6 to Table 7. We were also able to successfully analyse V36 with the ISM light curves, obtaining a relatively small . The unweighted mean values and standard deviations of the mass , luminosity , effective temperature and ‘helium parameter’ are: , , K and , respectively. As can be seen, the isis values are in good agreement with those obtained using the standard light curves.
How does this compare with M3? For this GC, Kaluzny et al. (1998) have found the following mean values: ; ; K. This suggests masses lower in NGC 6229 than in M3 by (in the opposite sense to that required to account for the detected period shift between the two clusters), and luminosities lower in NGC 6229 than in M3 by mag (as needed to account for the period shift between these clusters). One should note, however, that this method may need further testing and calibration, given the empirical results recently presented by Kovács (1998).
| Name | [Fe/H] | |||||||
|---|---|---|---|---|---|---|---|---|
| (K) | ||||||||
| V1 | 17.934 | 0.400 | 4.949 | 1.182 | 0.72 | 6438 | 0.09 | |
| V2 | 18.078 | 0.371 | 4.800 | 1.189 | 0.76 | 6431 | 0.08 | |
| V9 | 18.029 | 0.273 | 5.037 | 1.119 | 0.85 | 6493 | 0.15 | |
| V11 | 18.181 | 0.288 | 4.994 | 1.279 | 0.81 | 6478 | 0.09 | |
| V12 | 18.043 | 0.369 | 4.483 | 4.591 | 0.78 | 6444 | 0.10 | |
| V13 | 18.106 | 0.293 | 4.858 | 1.373 | 0.82 | 6410 | 0.07 | |
| V14 | 17.926 | 0.360 | 4.688 | 0.787 | 0.88 | 6595 | 0.09 | |
| V19 | 18.067 | 0.452 | 4.883 | 1.005 | 0.84 | 6654 | 0.08 | |
| V21 | 18.025 | 0.248 | 5.392 | 1.328 | 0.87 | 6355 | 0.11 |
| Name | [Fe/H] | ([Fe/H]) | ||
|---|---|---|---|---|
| V1 | 0.73 | 6370 | 0.09 | |
| V2 | 0.77 | 6423 | 0.08 | |
| V5 | 0.81 | 6462 | 0.13 | |
| V6 | 0.79 | 6308 | 0.12 | |
| V7 | 0.83 | 6380 | 0.16 | |
| V9 | 0.81 | 6376 | 0.15 | |
| V11 | 0.83 | 6437 | 0.09 | |
| V12 | 0.79 | 6431 | 0.10 | |
| V13 | 0.83 | 6427 | 0.07 | |
| V14 | 0.89 | 6525 | 0.09 | |
| V19 | 0.82 | 6446 | 0.08 | |
| V20 | 0.81 | 6553 | 0.19 | |
| V21 | 0.87 | 6372 | 0.11 | |
| V33 | 0.85 | 6025 | 0.09 | |
| V34 | 0.81 | 6356 | 0.13 | |
| V38 | 0.84 | 6487 | 0.18 | |
| V40 | 0.84 | 6227 | 0.15 | |
| V42 | 0.81 | 6379 | 0.17 | |
| V43 | 0.74 | 6344 | 0.13 | |
| V45 | 0.85 | 6322 | 0.12 |
6.2 RRab stars
Jurcsik & Kovács (1996), Kovács & Jurcsik (1996, 1997) and Kovács & Kanbur (1998) obtained empirical formulae relating the stellar metallicities, absolute magnitudes and temperatures to Fourier decomposition parameters for RRab stars with ‘regular’ light curves. The only model-dependent ingredients in their calibrations are the zero point of the HB luminosity scale (adopted from Baade-Wesselink studies) and the colour-temperature transformations (obtained from static model atmospheres).
The physical parameters of NGC 6229 RRab Lyrae variables obtained from this method are given in Table 8. The unweighted mean value (and corresponding standard deviation) of [Fe/H] derived from is dex. Note that this value is in the Jurcsik (1995) scale. Likewise, the mean absolute magnitudes and temperatures are mag and K. Again, similar values are obtained from the ISM light curves: dex, mag and K. The faint HB level is a reflection of the adoption of the Baade-Wesselink luminosity zero point in the calibration of this method (see Jurcsik & Kovács 1999 for a recent discussion).
Comparison with the mean absolute magnitude of the RRab Lyrae in M3 recently obtained by Kaluzny et al. (1998) using the same approach, mag, is again suggestive of a slightly fainter HB level in NGC 6229 than in M3, as required in order to account for a period shift between the RRab variables in the two clusters. For an analysis of possible problems related to this method, the reader is refered to Kolláth, Buchler, & Feuchtinger (2000) and Jurcsik & Kovács (1999).
7 Comments on individual stars
V3: Although data (of low quality) have been provided for this star by Baade (1945) and by Mannino (1960), no period has been published to date. We note that our CCD investigation does not provide help in resolving the situation, since V3 is not in our observed field. However, we have investigated Mannino’s data and found that it was possible to fold his observations with a period . Fig. 9 shows the first light curve for this star, which is clearly an RRab Lyrae variable. Due to its distance from the cluster centre and poor quality of the light curve, V3 was not considered when deriving mean cluster properties.
V12: CFT91 noted that this RRab star, in comparison with the other NGC 6229 variables, ‘seems to be much too bright and too blue’. They suspected that this could be due to crowding, hence blending.
Careful inspection of our images does reveal that V12 has a very close ‘companion’. This is the main reason why the ISM light curves for this star (Figs. 4 and 5) are significantly better than their daophot counterparts (Figs. 2 and 3): isis encountered no difficulty at removing this close companion. Note that, unlike in CFT91, the mean magnitudes and colours for this star (Table 1) do not deviate substantially from the remainder of the sample.
7.1 RR Lyrae variables

V32: This RRc star is the faintest overtone variable in the NGC 6229 CMD (Fig. 6). V32, at mag, is almost 0.2 mag fainter than the lower envelope of the red HB of the cluster. On the other hand, the Fourier decomposition analysis suggests that V32 is one of the two intrinsically brightest RRc variables in the NGC 6229 field (cf. Tables 6 and 7). In spite of V32’s proximity to the cluster centre (Fig. 1), these properties suggest that V32 may be a non-member. Accordingly, all average values reported in this paper do not take V32 into account.
7.2 Population II Cepheids
V8: As previously stated, Davis (1917) found V8 to be one of the brightest stars in NGC 6229, and Baade (1945) classified it as a ‘long-period Cepheid’. Mannino (1960) obtained a period , thus assigning to it W Virginis status. The period we estimate from our new CCD data is slightly shorter: . The period, amplitude and light curves (Fig. 10) are all consistent with its classification as a W Vir variable. In comparison with the typical colours of W Vir stars in GCs, V8, with mag, seems to be among the reddest: from Harris (1985), one might have expected a colour mag given this star’s period, whereas from Nemec, Nemec, & Lutz (1994) a colour mag would seem more appropriate. Using the distance modulus from Harris (1996) and given that mag, its absolute magnitude is found to be mag, which places it among the fundamental Pop. II variables in the Nemec et al. classification scheme.

V22: No light curve has ever been published for V22, which is located very close to the core of the cluster according to the coordinates provided by Sawyer (1953). To the best of our knowledge, no follow-up observations were carried out for this star since Sawyer reported on its discovery, although Sawyer Hogg’s (1953) catalogue mentions that this variable is ‘probably slow’ (i.e., has a long period).
In order to assess the variability type and attempt to determine a period for this star, we have used exclusively our 10 best and shortest (exposure times 60 sec) ISM-subtracted frames, since we expected that any star that could be found by Sawyer (1953) at the very core of the cluster using her photographic material had to be very bright, and hence probably only seen by Sawyer on her frames obtained with the shortest exposures. This expectation was also reinforced by Sawyer’s remark that the star’s ‘magnitude indicates that its period may be greater than a day’.
The ISM method revealed no variable star at the position reported by Sawyer Hogg (1973). However, relatively close to her coordinates, at and , a very bright variable star was found. We suggest that this is probably a rediscovery of Sawyer’s (1953) V22, and that the previous coordinates for this star were incorrect.
Since we also have daophot magnitudes measured on our short (60 sec) frames, we attempted to derive a transformation between ISM relative fluxes and standard , magnitudes for this star. We found that it was necessary to multiply the V22 ISM fluxes by 0.00002 and 0.0000046 in order to obtain magnitudes in and , respectively. Note that these coefficients are different from those obtained for the RR Lyrae variables in Section 2.3. One possible reason for such a difference is related to the sky subtraction in this extremely crowded region of the cluster (see Fig. 1). Using , magnitudes thus derived, light curves are shown in Fig. 10. As can be seen, a period gives an acceptable light curve for the star, suggesting that it is a W Vir variable.
The derived photometric parameters for this star are very uncertain, but they allow us to constrain the variability status of V22. The colour of the star is mag, making it the reddest among all known NGC 6229 variables. From Harris (1985), one would expect a colour mag given this star’s period, assuming it to be a W Vir variable, whereas from Nemec et al. (1994) a colour mag would seem more appropriate. Using the distance modulus from Harris (1996), V22’s absolute magnitude is found to be mag. This would place V22 among the overtone Pop. II Cepheids, following the Nemec et al. classification scheme. Note, however, that McNamara (1995) has questioned the reality of the subdivision of Pop. II Cepheids into fundamental and overtone pulsators by Nemec et al. (1994).
In summary, we confirm that V8 and V22 are most likely W Vir variables, but more data are needed, especially in the case of V22, to verify their colours.
7.3 Other variable stars
Two additional stars, V27 and V31, have average magnitudes placing them above the HB level of NGC 6229 (see Fig. 6). These bright variables were both discovered by BCSS97.

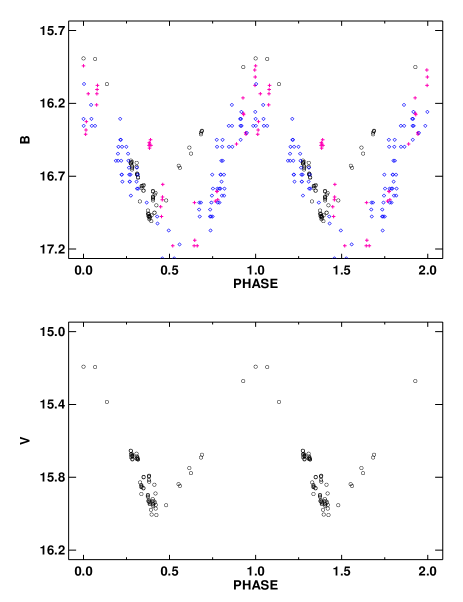
V27: V27 has a period . The light curves of V27 in the relative ISM fluxes are presented in Fig. 12. V27 has period, colour and luminosity appropriate for its classification as a Pop. II Cepheid of the BL Herculis type. However, the light curve is not well defined, and we regard the derived period uncertain, as well as its BL Her classification.
V31: From the analysis of daophot magnitudes, V31 has a period . A different period is derived on the basis of the ISM fluxes; in this case, we find . V31 appears to lie on an extension of the BL Her period-colour relation (Nemec et al. 1994) towards bluer colours, and its luminosity would be consistent with this interpretation. V31 might also be classified as an ‘AHB1’ star (Diethelm 1983).
This having been stated, we emphasize that the light curve (Fig. 13) does not obviously resemble either those of BL Her or of AHB1 stars (cf. Diethelm 1983). In fact, the light curve remarkably resembles that of an eclipsing binary. V31 might be a contact binary (W UMa star). We have compared the properties of V31 against those of W UMa-type binaries in GCs from Rucinski (2000). Judging from Rucinski’s eq. (1) (a period-colour-luminosity relation), the period and colour of the star are inconsistent with its classification as a cluster W UMa star: V31’s implied absolute magnitude, mag, corresponds to an apparent magnitude of mag, adopting a distance modulus mag (Harris 1996). This is mag fainter than V31, which has mag (cf. Table 3). Alternatively, the star might be a field W UMa variable. However, V31 is very close to the cluster centre, making it an unlikely (but not impossible) field variable. In addition, the colour and amplitude of the star, compared against the results compiled by Rucinski, appear to militate against the very classificaion of V31 as a W UMa star. In particular, it is clear from Rucinski’s Table 2 that the bluest W UMa stars (with colours similar to V31’s) tend to have much smaller amplitudes than is the case with V31. The star also lies outside the domain of W UMa variables as shown in Rucinski’s Fig. 6 (period-colour plane). Therefore, we suggest that this star is instead a short-period detached or semi-detached (most likely an Algol, but possibly a Lyrae) foreground eclipsing binary. This classification is certainly consistent with the star’s light curve, as shown in Fig. 13, where the unequally deep eclipses stand out, and there is an indication of a period during which the light may be constant; accordingly, the Algol ‘template’ from Layden & Sarajedini (2000), kindly provided by A. Layden, seems to provide a good fit to the star’s light curve (Fig. 13).

However, as in the case of V27, we consider the periods and light curves of V31 preliminary. Additional data are needed to determine its variability status and ephemerides with greater confidence.
8 Summary
In the present paper, we have presented the first extensive CCD investigation of the variable star population in the outer-halo GC NGC 6229. With the exception of five variable stars from the candidate list presented by BCSS97, we were able to derive periods and light curves for 36 previously known/suspected variables in the field of the cluster, as well as for 12 newly discovered variables. Most of the new discoveries we owe to an application of the new ISM method developed by Alard (1999) and Alard & Lupton (1998), which does appear to be a very powerful tool to search for new variables and determine their periods, especially in crowded regions such as the cores of GCs.
The confirmed variable-star population in NGC 6229 is mostly comprised of RRab stars, several of which present the Blazhko effect. Less numerous, but also well represented, are the RRc stars. The mean periods of the fundamental RR Lyrae pulsators, as well as their relative incidence in comparison with first-overtone RR Lyrae variables, clearly classify NGC 6229 as an OoI cluster, as originally suggested by Mayer (1961).
We have found that the period-amplitude distribution of NGC 6229 RRab variables with ‘regular’ light curves may deviate from that of M3, a very well-known OoI globular. The period shift is in the sense that NGC 6229 variables have shorter periods than their M3 counterparts at a given amplitude. Given that NGC 6229 appears to have the same metallicity as M5 (Borissova et al. 1999), which in turn is well known to be dex more metal-rich than M3, this might indicate that the period-amplitude diagram is not solely a function of Oosterhoff type as recently suggested, but also of metallicity—a conclusion also reached by Kaluzny et al. (2000) in the case of M5. However, we caution that the size of the period shift was not consistent when or amplitudes were employed, so that systematic effects cannot be ruled out at this point. Better data will be necessary before this problem can be conclusively solved.
We have employed Fourier decompositions of the RRc and RRab light curves in an effort to determine their physical parameters (Simon & Clement 1993; Kovács & Jurcsik 1996, 1997); the results were compared with those for other clusters (as published in the literature), and placed in the context of our period-shift discussion.
Finally, we have found that NGC 6229 may contain up to two Pop. II Cepheids of the W Vir type, as well as an eclipsing binary (most likely a foreground Algol system) and an additional bright variable for which we were unable to reliably determine the variability type.
Acknowledgements
The authors are grateful to C. Alard, B.W. Carney, C. Clement, J. Jurcsik, L.K. Fullton, A.C. Layden, A. Olech and R.T. Rood for very helpful discussions, information, and/or kindly supplied data. This research was supported in part by the Bulgarian National Science Foundation grant with the Bulgarian Ministry of Education and Sciences. Support for M.C. was provided by NASA through Hubble Fellowship grant HF–01105.01–98A awarded by the Space Telescope Science Institute, which is operated by the Association of Universities for Research in Astronomy, Inc., for NASA under contract NAS 5-26555.
References
- [] Alard C., 1999, A&A, 343, 10
- [] Alard C., Lupton R.H., 1998, ApJ, 503, 325
- [] Baade W., 1945, ApJ, 102, 17
- [] Bingham E.A., Cacciari C., Dickens R.J., Fusi Pecci F., 1984, MNRAS, 209, 765
- [] Borissova J., Catelan M., Ferraro F.R., Spassova N., Buonanno R., Iannicola G., Sweigart A.V., 1999, A&A, 343, 813
- [] Borissova J., Catelan M., Spassova N., Sweigart A.V., 1997, AJ, 113, 692 (BCSS97)
- [] Carney B.W., Fullton L.K., Trammell S.R., 1991, AJ, 101, 1699 (CFT91)
- [] Carney B.W., Storm J., Trammell S.R., Jones R.V., 1992, PASP, 104, 44
- [] Carney B.W., Storm J., Williams C., 1993, PASP, 105, 294
- [] Carreta E., Cacciari C., Ferraro F.R., Fusi Pecci F., Tessicini G., 1998, MNRAS, 298, 1005
- [] Carreta E., Gratton R.G., 1997, A&AS, 121, 95
- [] Castellani V., Quarta M.L., 1987, A&AS, 71, 1
- [] Catelan M., 1998, ApJ, 495, L81
- [] Catelan M., Borissova J., Sweigart A.V., Spassova N., 1998, ApJ, 494, 265
- [] Catelan M., Sweigart A.V., Borissova J., 1998, in A Half Century of Stellar Pulsation Interpretations, eds. P.A. Bradley & J.A. Guzik (San Francisco: ASP), ASP Conf. Ser., 135, 41
-
[]
Clement C., 1997, AAS Newsl., 84, 15
(http://www.astro.utoronto.ca/cclement/cat/clusters.html) - [] Clement C., Shelton I., 1999, ApJ, 515, L85
- [] Davis H., 1917, PASP, 29, 260
- [] Diethelm R., 1983, A&A, 124, 108
- [] Harris H.C., 1985, in Cepheids: Theory and observations, IAU Colloq. 82, ed. B.F. Madore (Cambridge: Cambridge University Press), p. 232
- [] Harris W.E., 1996, AJ, 112, 1487
- [] Isobe T., Feigelson E.D., Akritas M.G., Babu G.J., 1990, ApJ, 364, 104
- [] Jones R.V., Carney B.W., Latham D.W., Kurucz R.L., 1987, ApJ, 314, 605
- [] Jones R.V., Carney B.W., Storm J., Latham D.W., 1992, ApJ, 386, 646
- [] Jurcsik J., 1995, AcA, 45, 653
- [] Jurcsik J., 2000, private communication
- [] Jurcsik J., Kovács G., 1996, A&A, 312, 111
- [] Jurcsik J., Kovács G., 1999, New AR, 43, 463
- [] Kadla Z., Gerashchenko A., 1982, Izv. Main A. O. of the Academy of Sc. USSR (Pulkovo), 199, 86
- [] Kaluzny J., Hilditch R.W., Clement C., Rucinski S.M., 1998, MNRAS, 296, 347
- [] Kaluzny J., Olech A., Thompson I., Pych W., Krzeminsi W., Schwarzenberg-Czerny A., 2000, A&AS, 143, 215
- [] Kolláth Z., Buchler J.R., Feuchtinger M., 2000, ApJ, 540, 468
- [] Kovács G., 1998, MSAIt, 69, 49
- [] Kovács G., Jurcsik J., 1996, ApJ, 466, L17
- [] Kovács G., Jurcsik J., 1997, A&A, 322, 218
- [] Kovács G., Kanbur S., 1998, MNRAS, 295, 834
- [] Lafler J., Kinman T., 1965, ApJS, 11, 216
- [] Lee J.-W., Carney B.W., 1999, AJ, 117, 2868
- [] Layden A.C., 1998, AJ, 115, 193
- [] Layden A.C., Sarajedini A., 2000, AJ, 119, 1760
- [] McNamara D.H., 1995, AJ, 109, 2134
- [] Mannino G., 1960, Pubbl. dell’Oss. astr. univ. Bologna, Vol. VII, N. 13
- [] Mayer P., 1961, BAICz, 12, 167
- [] Nemec J.M., Nemec A.F.L., Lutz T.E., 1994, AJ, 108, 222
- [] Olech A., Woźniak P.R., Alard C., Kaluzny J., Thompson I.B., 1999, MNRAS, 310, 759
- [] Preston G.W., 1961, ApJ, 133, 29
- [] Rucinski S.M., 2000, AJ, 120, 319
- [] Sandage A., 1981a, ApJ, 244, L23
- [] Sandage A., 1981b, ApJ, 248, 161
- [] Sandage A., 1990, ApJ, 350, 603
- [] Sandquist E.L., 2000, MNRAS, 313, 571
- [] Sawyer H.B., 1953, JRASC, 47, 229
- [] Sawyer Hogg H., 1973, Publ. David Dunlap Obs., 3, No. 6
- [] Simon N.R., Clement C.M., 1993, ApJ, 410, 526
- [] Simon N.R., Teays T., 1982, ApJ, 261, 586
- [] Searle L., Zinn R., 1978, ApJ, 225, 357
- [] Smith H.A., 1995, RR Lyrae Stars. Cambridge University Press, Cambridge
- [] Stetson P.B., 1993, User’s Manual for daophot ii
- [] Storm J., Carney B.W., Beck J.A., 1991, PASP, 103, 1264
- [] van Albada T.S., Baker N., 1971, ApJ, 169, 311
- [] VandenBerg D.A., Swenson F.J., Rogers F.J., Iglesias C.A., Alexander D.R., 2000, ApJ, 532, 430
- [] Walker A., 1994, AJ, 108, 555
- [] Walker A., 1998, AJ, 116, 220
- [] Walker A.R., Kovács G., 2000, in The Impact of Large-Scale Surveys on Stellar Pulsations, eds. L. Szabados & D. Kurtz (San Francisco: ASP), ASP Conf. Ser., 203, 268
- [] Welch D.L., Stetson P.B., 1993, AJ, 105, 1813
- [] Zinn R., West M., 1984, ApJS, 55, 45