Band Spectroscopy of Ultraluminous Infrared Galaxies: The 2 Jy Sample
Abstract
We present near-infrared spectroscopy for a complete sample of 33 ultraluminous infrared galaxies at a resolution of . Most of the wavelength range from 1.80–2.20 m in the rest frame is covered, including the Pa and Br hydrogen recombination lines, and the molecular hydrogen vibration-rotation 1–0 S(1) and S(3) lines. Other species, such as He I, [Fe II], and [Si VI] appear in the spectra as well, in addition to a number of weaker molecular hydrogen lines. Nuclear extractions for each of the individual galaxies are presented here, along with spectra of secondary nuclei, where available. The Pa emission is seen to be highly concentrated on the nuclei, typically with very little emision extending beyond a radius of 1 kpc.
This survey was carried out primarily to search for signatures of active nuclei via velocity-broadened hydrogen recombination or the presence of the [Si VI] coronal line. These signatures are rare in the present sample, occurring in only two of the 33 galaxies. The extinction to the hydrogen recombination lines is investigated via the PaBr line ratio. It is found that visual extinctions to the nuclei in excess of 10 magnitudes are relatively common among ULIRGs, and that visual extinctions greater than 25 mag are necessary to conceal a QSO emitting half the total bolometric luminosity. The ionized hydrogen regions in many ULIRGs are sufficiently obscured that dust-enshrouded active galactic nuclei would remain hidden at 2 m at the current level of sensitivity. The vibration-rotation lines of molecular hydrogen appear to be predominantly thermal in origin, with effective temperatures generally around 2200 K. The relative nuclear velocities between double nucleus ULIRGs are investigated, through which it is inferred that the maximum deprojected velocity difference is km s-1. This figure is lower than the velocities predicted by physical models of strong interactions/mergers of large, gas-rich galaxies.
1 Introduction
Understanding the nature of the ultimate power source in ultraluminous infrared galaxies (ULIRGs) has been a primary driver for numerous scientific investigations ever since the discovery in the 1980’s that ULIRGs represent the most luminous class of galaxies in the local universe. With total power outputs comparable to those of quasars, characterizing the source of power is of fundamental importance in understanding the composition and evolution of normal galaxies. ULIRGs are found to share the common trait that virtually all have recently or are currently experiencing major encounters with other galaxies (Murphy et al., 1996; Clements et al., 1996; Sanders et al., 1988; Carico et al., 1990). Encounters like these may play a significant role in the process of building normal galaxies. With the discovery of faint sources at sub-millimeter wavelengths having characteristic spectral energy distributions like that typically found in ULIRGs (e.g., Arp 220) and redshifts , the importance of understanding these systems and their role in the evolution of normal galaxies has been heightened.
The present survey was designed to look for near-infrared spectral signatures of obscured active galactic nuclei (AGN) in ULIRGs, either by the presence of velocity-broadened Pa emission or by the appearance of the high excitation [Si VI] coronal line. A summary of the conclusions of this survey, along with a median ULIRG near-infrared spectrum, are presented in Murphy et al. (1999). Only two of the 33 sample galaxies show clear indications for AGN activity, with the rest appearing to be dominated by star formation processes. Either the AGN phenomenon is relatively rare among ULIRGs, or the extinction at 2 m is still too high to permit a proper assessment. Mid infrared studies (e.g., Genzel et al., 1998; Rigopoulou et al., 1999) favor the former conclusion, though it is found in this study that the extinction at 2 m may often be greater than four magnitudes, resulting in over one magnitude of extinction at mid-infrared wavelengths.
This paper presents the individual nuclear spectra for the sample galaxies, for both the primary and secondary nuclei where possible. Two-dimensional spectra are also presented to give a qualitative view of the line emission distributions typically found in ULIRGs. Some discussion of extinction measures, molecular hydrogen excitation mechanisms, and a summary of typical line ratios found in ULIRGs is included, as is a discussion of the velocity differences found among double nucleus systems.
2 The Sample
The sample of 33 ULIRGs in this survey originates from the 2Jy sample of IRAS (Infrared Astronomical Satellite) galaxies defined by Strauss et al. (1990, 1992). The galaxies in the present sample are chosen to meet the following criteria:
-
1.
60 m flux density, (60 m) 1.94 Jy
-
2.
Moderate or high quality IRAS flux measurements at 60 and 100 m (as defined in the IRAS PSC, Explanatory Supp., 1988)
-
3.
(60 m)(12 m)(25 m), where () is the IRAS flux density
-
4.
Far-infrared luminosity
-
5.
Absolute Galactic latitude,
-
6.
Declination,
-
7.
Redshift,
The first six conditions are those used to define the northern 2 Jy ULIRG sample in Murphy et al. (1996), such that the current sample is a subset of this work. The seventh condition places both the Pa and Br lines in the band atmospheric window. The far-infrared luminosity is computed from the IRAS flux densities by the following conversion:
(IRAS PSC, Explanatory Supp., 1988, p. X-13) where represents the luminosity distance to the source in Mpc.
Due to the redshift constraint, the current sample approximately represents a complete volume-limited sample, because even the galaxies with the minimum 60 m flux density are luminous enough to meet the sample criteria at all allowed redshifts. At the outer redshift limit of the survey, corresponding to a luminosity distance of 455 Mpc using km s-1 Mpc-1 and (as is assumed throughout), the minimum 60 m flux density of 1.94 Jy by itself accounts for of the total far-infrared luminosity. To make up the remaining necessary for sample inclusion, the 100 m flux density needs only be greater than 1.25 Jy, implying a maximum (60 m)(100 m) ratio of 1.55. ULIRGs very rarely have 60 m to 100 m flux density ratios this high, such that the volume limit imposed by the upper redshift cutoff is more stringent than the flux density cutoff, resulting in a sample that is mostly volume-limited rather than flux-limited. Taking the 64 ULIRGs defined in the northern 2 Jy sample of Murphy et al. (1996), one finds an average (60 m)(100 m) ratio of , with a median value of 0.86 and a maximum of 1.64 (in IRAS 085723915), which is the only ratio exceeding the maximum of 1.55 compatible with the volume-limited case. The ULIRG from the northern 2 Jy sample with the second highest ratio is IRAS 052460103, with (60 m)(100 m). Both of these galaxies are contained in the present sample. The redshift limit excludes many of the highest luminosity ULIRGs, as these are most likely found at larger distances. For instance, Mrk 1014—a quasar and a ULIRG—would be a member of the sample if not for the upper redshift limit.
Of the 35 ULIRGs in the redshift survey of Strauss et al. (1992) satisfying the above conditions, two are not included here for the following reasons. The spectra of IRAS 213963623 show this galaxy to be at a redshift of , rather than the previously reported . IRAS 192970406 was free of any discernible lines, which may be the result of improper pointing, producing the spectrum of a nearby star in the very crowded field. Therefore the entire sample contains 33 galaxies, and is very nearly complete in the volume-limited sense. A list of the sample galaxies appears in Table 1.
| Galaxy Name | SeparationaaNuclear separation is given where applicable. S denotes a single nucleus. Numbers in parentheses denote a double nucleus system for which only the primary nucleus spectrum is presented, generally because the separation exceeds the slit length. | ||
|---|---|---|---|
| (km s-1) | () | (arcsec) | |
| IRAS 002624251 | 29205 | 12.08 | S |
| IRAS 015215224 | 23959 | 11.95 | 5.5 |
| IRAS 042321436 | 23640 | 11.99 | S |
| IRAS 052460103bbGalaxies with “warm” infrared colors: (25 m)(60 m). | 29105 | 12.05 | 6.0 |
| IRAS 080305243 | 24946 | 11.97 | S |
| IRAS 083112459bbGalaxies with “warm” infrared colors: (25 m)(60 m). | 30167 | 12.40 | S |
| IRAS 083445105 | 28999 | 11.94 | S |
| IRAS 085723915b,cb,cfootnotemark: | 17491 | 12.08 | 5.6 |
| IRAS 090611248 | 22014 | 11.97 | 5.6 |
| IRAS 091111007 | 16247 | 11.98 | (37) |
| IRAS 095834714 | 25748 | 11.98 | 25.5 |
| IRAS 100354852 | 19449 | 11.93 | 9.8 |
| IRAS 101901322 | 22898 | 11.98 | 4.0 |
| IRAS 104944424 | 27671 | 12.15 | S |
| IRAS 110950238 | 31936 | 12.20 | S |
| IRAS 121120305ccContained in the Bright Galaxy Sample (BGS) of Soifer et al. (1987). | 22009 | 12.27 | 2.9 |
| IRAS 143481447ccContained in the Bright Galaxy Sample (BGS) of Soifer et al. (1987). | 24798 | 12.28 | 3.3 |
| IRAS 143521954 | 26938 | 11.95 | S |
| IRAS 143945332 | 31401 | 12.04 | (28) |
| IRAS 152451019 | 22629 | 11.96 | 2.6 |
| IRAS 152503609ccContained in the Bright Galaxy Sample (BGS) of Soifer et al. (1987). | 16515 | 11.99 | S |
| IRAS 154620450 | 30060 | 12.16 | S |
| IRAS 164875447 | 31110 | 12.12 | 3.1 |
| IRAS 170285817 | 31805 | 12.11 | 13.0 |
| IRAS 184703233 | 23520 | 12.02 | (7.0) |
| IRAS 194580944 | 29983 | 12.36 | S |
| IRAS 200460623 | 25286 | 12.02 | S |
| IRAS 200870308 | 31613 | 12.39 | S |
| IRAS 204141651 | 26061 | 12.19 | S |
| IRAS 215040628 | 23343 | 11.94 | S |
| IRAS 224911808ccContained in the Bright Galaxy Sample (BGS) of Soifer et al. (1987). | 23264 | 12.12 | 1.6 |
| IRAS 233272913 | 32225 | 12.03 | 12.5 |
| IRAS 233653604 | 19305 | 12.13 | S |
3 Observations and Data Reduction
Observations were conducted using the Palomar longslit infrared spectrograph (Larkin et al., 1996), operating on the 200-inch Hale Telescope and employing a 256256 HgCdTe (NICMOS 3) array. Observations were made over a time period beginning in 1995 July, and ending in 1997 December. Each object was observed in three grating settings, with each spanning m at a scale of m pixel-1. Typical slit widths of 3.75 pixels, or 0625, resulted in spectra with resolutions of , corresponding to 300 km s-1. The grating settings were chosen to cover the Pa line at 1.8751 m, the suite of Br, H2 1–0 S(3), and [Si VI] lines centered at 1.954 m, and the H2 1–0 S(1) and Br lines centered at 2.14 m. The slit was generally rotated such that spectra of both primary and secondary nuclei were obtained simultaneously when possible, or otherwise to coincide with the major axis of the galaxy, where evident.
Observational details are provided for each source in Table 2. Individual exposure times were 300 s, with total integration times generally around 1800 s. In all cases, the galaxy was dithered between two positions on the slit, generally apart, with a smaller scale dither pattern employed about these points to eliminate the effects of static bad pixels. In this way, the sky integrations were obtained simultaneously, with the effective sky position alternating by to either side. Wavelength calibration was provided either by the atmospheric OH airglow spectrum, or by arc lamp spectra for the H2 1–0 S(1)Br grating settings, where the OH lines become unavailable. Wavelengths reported here are in air units, with the OH wavelength data coming from Oliva & Origlia (1992). Atmospheric transmission variations as a function of wavelength were compensated via observations of the nearly featureless spectra of G dwarf stars at similar airmass, and similar telescope pointing, when possible. The G star observations were performed either immediately prior to or following each galaxy observation. Stellar types and airmasses of the calibrators are listed for each object in Table 2. The light from the calibrator star was made to uniformly fill the slit aperture by chopping the telescope secondary mirror in a triangle-wave pattern. As such, the atmospheric calibrators perform the dual function of operating as the flat field for the spectral observations. Details about the treatment of the spectral calibration appear below. The calibration star observation for IRAS 121120305 was compromised beyond repair, so the spectra for this galaxy were divided by an atmospheric template.
Each spectrum is reduced pair-wise in the following manner. Pairs containing spectra at the two opposite slit positions are subtracted, with cosmic rays and static bad pixels interpolated. The data are divided by the G star spectrum and multiplied by a Planck function, described in more detail below. A wavelength reference image is produced using either a median combination of the data frames to produce an OH airglow spectrum, or by using a combination of noble gas arc lamp spectra. The wavelength calibration image is spatially and spectrally rectified onto a rectilinear grid using predetermined maps of the distortion in each of these directions. A cubic function of fixed cubic coefficient and zero quadratic coefficient (determined empirically to fit the distortion well) is fit to the wavelength reference, providing a mapping from pixel coordinates to linear wavelength coordinates. This mapping is combined with the predetermined distortion maps, and then applied in a single interpolation to the data frames. Once rectified, the pairs are combined into a single spectrum, using Gaussian centroids for the spatial registration, or known pixel offsets for galaxies having diffuse or faint continua. This process removes any residual sky subtraction signal, as one effectively subtracts the simultaneous sky at the alternate slit position in the process. The noise at each pixel in the two-dimensional spectrum is computed along with the spectral data by quadrature combination of read noise and Poisson shot noise based on signal level for each pixel. Pixel replacement, atmospheric calibrator division, and interpolation in the data frames are also properly treated in the noise frames throughout the process. The same extractions applied to the spectral data are performed on the noise image, producing a one-dimensional noise array along with the extracted spectrum.
The seeing at the time of observation was assessed by taking short guided exposures—typically 10 s—of nearby field stars through the wide-open slit of the spectrograph, with the spectrograph operating in imaging mode. In this way, the point spread function (PSF) of the telescope-plus-atmosphere during the spectral observations could be estimated. These PSF exposures were typically taken 3–4 times during an observation, usually at the beginnings and ends of the 30–40 minute intervals spent at each grating setting. The full-width at half-maximum (FWHM) along the slit direction was measured for each PSF image, and the nuclear extractions of the spectra were based on this measurement. In each case, the PSF FWHM was rounded up to an integral number of pixels, and extractions matching these integer widths were performed. The centers of these apertures were not constrained, however, such that fractional pixels were summed in the production of the nuclear spectra. The widths of the extractions, in arcseconds, are listed in Table 2.
| Galaxy | Grating | Date | Integration | Slit | Atmos. | Obj./Cal. | Extraction |
|---|---|---|---|---|---|---|---|
| Setting | (sec) | P.A. | Calib. | Airmass | (′′) | ||
| IRAS 002624251 | Pa: | 3 Jan 1996 | 1800 | G1.5V | 1.02/1.05 | 1.5 | |
| [Si VI]: | 1800 | 1.11/1.04 | 1.7 | ||||
| HBr: | 1800 | 1.05/1.05 | 1.5 | ||||
| IRAS 015215224 | Pa: | 2 Jan 1996 | 1800 | G5Vb | 1.06/1.09 | 2.0 | |
| [Si VI]: | 1800 | 1.06/1.08 | 1.8 | ||||
| HBr: | 1800 | 1.07/1.08 | 1.7 | ||||
| IRAS 042321436 | Pa: | 26 Nov 1996 | 1800 | G0V | 1.07/1.04 | 0.7 | |
| [Si VI]: | 1800 | 1.07/1.06 | 0.8 | ||||
| HBr: | 1800 | 1.06/1.06 | 0.7 | ||||
| IRAS 052460103 | Pa: | 5 Dec 1996 | 1200 | G1V | 1.19/1.18 | 0.8 | |
| [Si VI]: | 1800 | 1.21/1.21 | 0.8 | ||||
| HBr: | 1800 | 1.18/1.17 | 0.7 | ||||
| IRAS 080305243 | Pa: | 31 Dec 1995 | 1800 | G5V | 1.07/1.07 | 1.5 | |
| [Si VI]: | 1800 | 1.07/1.06 | 1.3 | ||||
| HBr: | 1800 | 1.06/1.07 | 1.3 | ||||
| IRAS 083112459 | Pa: | 8 Apr 1996 | 1800 | G3V | 1.91/1.99 | 1.7 | |
| [Si VI]: | 1800 | 1.92/1.82 | 1.7 | ||||
| HBr: | 1200 | 1.94/1.93 | 1.0 | ||||
| IRAS 083445105 | Pa: | 3 Jan 1996 | 1800 | G0V | 1.09/1.10 | 1.7 | |
| [Si VI]: | 1800 | 1.05/1.09 | 1.5 | ||||
| HBr: | 1800 | 1.07/1.09 | 1.5 | ||||
| IRAS 085723915 | Pa: | 25 Nov 1996 | 2400 | G0V | 1.01/1.01 | 0.8 | |
| [Si VI]: | 1200 | 1.03/1.02 | 0.7 | ||||
| HBr: | 1800 | 1.01/1.01 | 0.7 | ||||
| IRAS 090611248 | Pa: | 28 Nov 1996 | 1800 | G0V | 1.49/1.51 | 1.5 | |
| [Si VI]: | 1800 | 1.47/1.43 | 2.0 | ||||
| HBr: | 1800 | 1.45/1.46 | 1.8 | ||||
| IRAS 091111007 | Pa: | 11 Feb 1997 | 1800 | G2V | 1.39/1.45 | 1.7 | |
| [Si VI]: | 1200 | 1.42/1.39 | 1.5 | ||||
| HBr: | 1800 | 1.39/1.41 | 1.7 | ||||
| IRAS 095834714 | Pa: | 3 Jan 1996 | 1800 | 565 | G0V | 1.03/1.03 | 1.5 |
| [Si VI]: | 1800 | 565 | 1.03/1.04 | 1.2 | |||
| HBr: | 31 Dec 1995 | 1800 | 1.04/1.03 | 0.8 | |||
| IRAS 100354852 | Pa: | 22 Feb 1997 | 1200 | G0V | 1.04/1.05 | 1.0 | |
| [Si VI]: | 23 May 1997 | 1800 | G1V | 1.21/1.15 | 0.8 | ||
| HBr: | 1800 | F9V | 1.09/1.06 | 0.7 | |||
| IRAS 101901322 | Pa: | 22 May 1997 | 1800 | G0V | 1.15/1.16 | 1.0 | |
| [Si VI]: | 1800 | G1V | 1.26/1.23 | 1.2 | |||
| HBr: | 1800 | G0V | 1.44/1.42 | 1.0 | |||
| IRAS 104944424 | Pa: | 22 Feb 1997 | 1800 | G2V | 1.03/1.02 | 1.0 | |
| [Si VI]: | 1200 | G0Vs | 1.15/1.10 | 0.8 | |||
| HBr: | 1800 | 1.09/1.10 | 0.7 | ||||
| IRAS 110950238 | Pa: | 6 May 1996 | 1800 | G1V | 1.24/1.26 | 1.0 | |
| [Si VI]: | 1800 | 1.29/1.31 | 1.0 | ||||
| HBr: | 1800 | 1.25/1.29 | 0.8 | ||||
| IRAS 121120305 | Pa: | 5 May 1996 | 1800 | 1.09/ | 1.0 | ||
| [Si VI]: | 1800 | 1.05/ | 0.8 | ||||
| HBr: | 1800 | 1.07/ | 1.0 | ||||
| IRAS 143481447 | Pa: | 5 May 1996 | 1800 | G1V | 1.51/1.47 | 1.0 | |
| [Si VI]: | 1800 | G4V | 1.72/1.68 | 1.0 | |||
| HBr: | 1800 | 1.59/1.62 | 1.0 | ||||
| IRAS 143521954 | Pa: | 6 May 1996 | 1800 | G3V | 1.70/1.73 | 1.2 | |
| [Si VI]: | 1800 | G0V | 1.71/1.79 | 0.8 | |||
| HBr: | 1800 | G3V | 1.68/1.72 | 0.8 | |||
| IRAS 143945332 | Pa: | 5 May 1996 | 1800 | G1V | 1.34/1.30 | 0.8 | |
| [Si VI]: | 6 May 1996 | 1800 | 1.51/1.50 | 0.8 | |||
| HBr: | 1800 | 1.36/1.32 | 0.7 | ||||
| IRAS 152451019 | Pa: | 22 May 1997 | 1800 | G8V | 1.11/1.12 | 1.2 | |
| [Si VI]: | 1800 | 1.09/1.11 | 1.0 | ||||
| HBr: | 1800 | 1.10/1.10 | 1.0 | ||||
| IRAS 152503609 | Pa: | 21 May 1997 | 1800 | G2V | 1.03/1.01 | 1.0 | |
| [Si VI]: | 2400 | 1.01/1.02 | 1.0 | ||||
| HBr: | 1800 | 1.00/1.01 | 0.7 | ||||
| IRAS 154620450 | Pa: | 7 Apr 1996 | 1800 | G2.5V | 1.32/1.35 | 1.0 | |
| [Si VI]: | 8 Apr 1996 | 1800 | 1.41/1.36 | 0.8 | |||
| HBr: | 7 Apr 1996 | 1800 | 1.39/1.37 | 1.0 | |||
| IRAS 164875447 | Pa: | 21 May 1997 | 1800 | G5V | 1.08/1.11 | 0.7 | |
| [Si VI]: | 1800 | 1.11/1.12 | 0.8 | ||||
| HBr: | 1800 | G0Va | 1.17/1.20 | 0.7 | |||
| IRAS 170285817 | Pa: | 22 May 1997 | 1800 | G2V | 1.14/1.13 | 0.8 | |
| [Si VI]: | 1800 | 1.18/1.14 | 1.0 | ||||
| HBr: | 1800 | G0Va | 1.24/1.26 | 0.7 | |||
| IRAS 184703233 | Pa: | 31 Jul 1996 | 1800 | G8V | 1.05/1.00 | 0.8 | |
| [Si VI]: | 1800 | 1.00/1.00 | 1.0 | ||||
| HBr: | 1800 | 1.01/1.00 | 1.0 | ||||
| IRAS 194580944 | Pa: | 2 Aug 1996 | 1800 | F5V+G0V | 1.09/1.09 | 0.7 | |
| [Si VI]: | 1200 | 1.09/1.12 | 0.7 | ||||
| HBr: | 1800 | 1.09/1.09 | 0.7 | ||||
| IRAS 200460623 | Pa: | 12 Aug 1997 | 1800 | G2V | 1.37/1.40 | 1.0 | |
| [Si VI]: | 1200 | G1V | 1.31/1.27 | 1.0 | |||
| HBr: | 1200 | 1.31/1.27 | 1.0 | ||||
| IRAS 200870308 | Pa: | 11 Aug 1997 | 1800 | G1V | 1.36/1.35 | 1.0 | |
| [Si VI]: | 1800 | G0V | 1.51/1.43 | 0.8 | |||
| HBr: | 12 Aug 1997 | 1800 | G1V | 1.39/1.43 | 1.3 | ||
| IRAS 204141651 | Pa: | 1 Aug 1996 | 1800 | G2V | 1.56/1.56 | 1.0 | |
| [Si VI]: | 1200 | G1V | 1.71/1.70 | 0.8 | |||
| HBr: | 1800 | G2V | 1.62/1.56 | 0.8 | |||
| IRAS 215040628 | Pa: | 3 Aug 1996 | 1800 | G0V | 1.30/1.33 | 0.8 | |
| [Si VI]: | 1200 | G8V | 1.54/1.62 | 2.0 | |||
| HBr: | 1800 | G0V | 1.34/1.33 | 0.7 | |||
| IRAS 224911808 | Pa: | 2 Aug 1996 | 1800 | G8V | 1.62/1.61 | 1.0 | |
| [Si VI]: | 1800 | 1.63/1.62 | 1.2 | ||||
| HBr: | 1800 | 1.60/1.61 | 1.0 | ||||
| IRAS 233272913 | Pa: | 11 Aug 1997 | 1800 | G1.5V | 1.00/1.01 | 1.0 | |
| [Si VI]: | 1200 | 1.03/1.01 | 0.7 | ||||
| HBr: | 10 Jul 1995 | 1200 | G0V | 1.00/1.00 | 0.8 | ||
| IRAS 233653604 | Pa: | 26 Nov 1996 | 1800 | G1.5V | 1.01/1.01 | 0.8 | |
| [Si VI]: | 28 Nov 1996 | 1800 | G2V | 1.00/1.01 | 2.0 | ||
| HBr: | 26 Nov 1996 | 1800 | G1.5V | 1.03/1.02 | 0.8 |
The most significant stellar absorption feature present in the 2 m window for the atmospheric calibrator stars is the Br line at 2.1655 m. While a template stellar spectrum may be adequate for removal of this line, we instead interpolated over the line in the two-dimensional G star calibration/flat-field spectrum before dividing the galaxy data by the calibrator data. Multiplying the corrected galaxy spectrum by a Planck blackbody function with a temperature matching that of the calibrator rectifies the spectrum to a proper representation in flux density. To remove the effects of the weaker absorption lines in the atmospheric calibrator, the galaxy spectrum was multiplied by a normalized solar spectrum, smoothed and re-binned to the same resolution. For the long wavelength grating setting covering the H2 1–0 S(1) and Br lines, the CO band structure becomes significant when using late-type G stars for the atmospheric calibration. When the atmospheric calibrator was of type G4–G8, a linear combination of G3 V and K0 V template spectra from Kleinmann & Hall (1986) was used instead of the solar spectrum. Again, this template was smoothed and re-binned to match the individual galaxy spectra.
4 Results
The chief results from this spectroscopic survey—that AGN appear to be rare among ULIRGs—has been reported previously in Murphy et al. (1999). In the present paper we focus attention on the range of observed properties rather than on the collected sample as a whole.

![[Uncaptioned image]](/html/astro-ph/0010077/assets/x2.png)
Figure 1: continued
![[Uncaptioned image]](/html/astro-ph/0010077/assets/x3.png)
Figure 1: continued
![[Uncaptioned image]](/html/astro-ph/0010077/assets/x4.png)
Figure 1: continued
![[Uncaptioned image]](/html/astro-ph/0010077/assets/x5.png)
Figure 1: continued
![[Uncaptioned image]](/html/astro-ph/0010077/assets/x6.png)
Figure 1: continued
![[Uncaptioned image]](/html/astro-ph/0010077/assets/x7.png)
Figure 1: continued
![[Uncaptioned image]](/html/astro-ph/0010077/assets/x8.png)
Figure 1: continued
![[Uncaptioned image]](/html/astro-ph/0010077/assets/x9.png)
Figure 1: continued
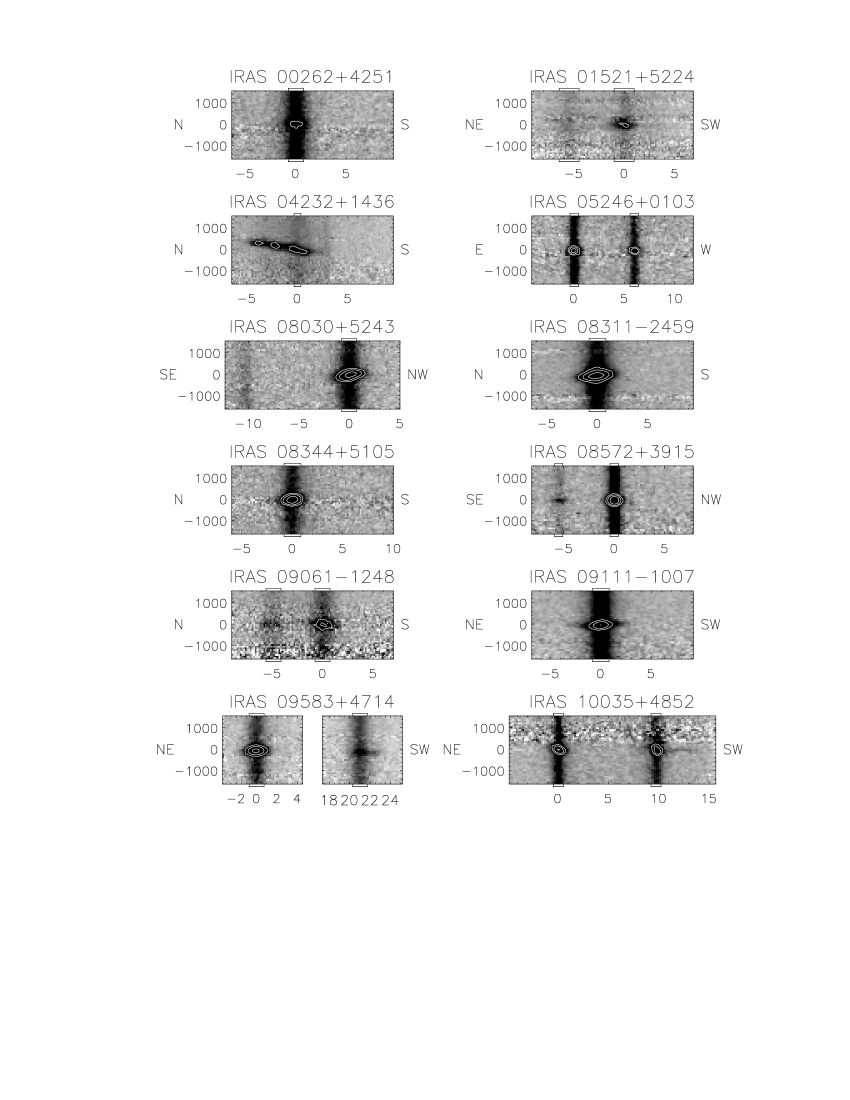
Figure 1 presents spectral extractions for the primary nuclei in the 33 sample galaxies, with aperture sizes indicated in Table 2. Each plot is fixed in the rest frame, with the observed wavelength scale indicated at bottom. Annotations mark the locations of every common emission line, though in any individual spectrum only the lines with reasonable detections are labeled. The location of the tick marks is based on the observed redshift of the Pa line, as is the rest wavelength scale at top. Each spectrum is composed of three independent spectral datasets. For each of the three spectral ranges, a best linear fit to the line-free continuum is assessed for the purpose of determining an overall average slope for the spectrum. The individual spectra are then scaled to lie on a common linear “backbone” defined by the average slope, and combined in a noise-weighted manner across the overlap region around 1.92 m. The vertical scale is normalized such that the continuum is at one unit of flux density at 2.155 m, corresponding to the middle of the bandpass.

![[Uncaptioned image]](/html/astro-ph/0010077/assets/x11.png)
Figure 2: continued
![[Uncaptioned image]](/html/astro-ph/0010077/assets/x12.png)
Figure 2: continued
![[Uncaptioned image]](/html/astro-ph/0010077/assets/x13.png)
Figure 2: continued
Figure 2 contains spectra of the secondary nuclei in the 14 sample galaxies with a nearby galactic companion, employing the same wavelength scale used for Figure 1. Annotations and scalings are the same as for Figure 1, though some of the weaker lines are not marked by default in this set. The tick marks denoting line positions are based on the redshift of the Pa line in the primary nucleus, so that velocity displacements between the two nuclei are more easily seen. The numerical flux density scale for each is identical to that for the corresponding spectrum in Figure 1, allowing direct comparison of the relative levels for each. The relative scaling of the three individual spectra determined for Figure 1 are used in Figure 2 as well.
The choice of primary versus secondary nucleus is based solely on the continuum level, with the brighter nucleus designated as the primary. The only exception is IRAS 224911808, for which the primary nucleus is identified with the dominant line-emitting, yet weaker continuum nucleus to the east. The western nucleus is 30% brighter, but lacks the strong H2 emission that is associated with every other primary ULIRG nucleus. Comparison of Figures 1 and 2 indicate that the primary nuclei, besides being the brightest continuum sources, also exhibit apparently stronger line emission. Yet despite the weaker line strengths, the secondary nuclei often do show appreciable line emission activity, appearing relatively similar to the primary nuclei. If the observed Pa line strength is proportional to star formation rates—and therefore total luminosity—then even though the dominant luminosity can be associated with one nucleus, the lesser nucleus still contributes a substantial fraction of the total luminosity. It must be realized, however, that the high levels of extinction present in ULIRGs could easily lead one to misjudge the identity of the primary source of infrared luminosity based simply on apparent line strengths.
Table 3 presents the line measurements from the primary nuclear data shown in Figure 1 and Table 4 presents the same data for the secondary nuclear spectra of Figure 2. For each galaxy, the continuum slope and measured Pa FWHM are given, as well as equivalent width, FWHM, and velocity centroid of each significant line. In this context, weaker hydrogen recombination and molecular hydrogen vibration-rotation lines are excluded from the table as their properties follow from those of the stronger lines. The continuum slope, , is reported as the power-law index, where . The equivalent linear slope, with , where m, is . The measured line properties reported in Tables 3 and 4 are obtained by the procedures detailed in Appendix A.
| Galaxy | Continuum | Pa FWHMbbStrictly formal measure of the full-width at half-maximum of the Pa line, deconvolved by the instrumental resolution. | RowsccFor each galaxy, the following measures are provided for selected lines: equivalent width (EW) is given in nanometers; FWHM as estimated via line flux and peak amplitude (see text), deconvolved by the instrumental resolution; first moment centroid of the line, expressed as recessional velocity () for Pa, and velocity offsets from Pa for all other lines. The first moment measure looses accuracy for weak lines depending on the spectral range summed, and therefore is of limited use here. | He I | Pa | H2 S(3) | Si VI | Fe II | H2 S(1) | Br |
|---|---|---|---|---|---|---|---|---|---|---|
| SlopeaaSlope expressed as power-law index, , where . | (km s-1) | 1.8689 | 1.8751 | 1.9570 | 1.9629 | 1.9670 | 2.1213 | 2.1655 | ||
| IRAS 002624251 | 331 | |||||||||
| EW | 0.1 | 0.15 | 0.14 | 0.088 | 0.24 | |||||
| FWHM | 420240 | 36627 | 48042 | 260160 | 38056 | |||||
| 78 | 18 | 29 | 63 | 27 | ||||||
| IRAS 015215224S | 394 | |||||||||
| EW | 0.44 | 0.14 | 0.36 | 0.49 | ||||||
| FWHM | 35623 | 17096 | 290120 | 0110 | ||||||
| 16 | 46 | 34 | 76 | |||||||
| IRAS 042321436 | 183 | |||||||||
| EW | 0.25 | 0.15 | 0.16 | 0.26 | ||||||
| FWHM | 21818 | 19570 | 20351 | 220100 | ||||||
| 15 | 33 | 26 | 46 | |||||||
| IRAS 052460103E | 110 | |||||||||
| EW | 0.13 | 0.19 | 0.26 | 0.2 | 0.14 | 0.24 | ||||
| FWHM | 49778 | 190.19.6 | 57577 | 310260 | 16140 | 210210 | ||||
| 51 | 22 | 47 | 55 | 38 | 110 | |||||
| IRAS 080305243 | 322 | |||||||||
| EW | 0.13 | 0.16 | 0.11 | 0.1 | 0.22 | 0.28 | ||||
| FWHM | 340160 | 326.26.8 | 33177 | 091 | 270130 | 380110 | ||||
| 71 | 12 | 34 | 87 | 31 | 44 | |||||
| IRAS 083112459 | 314 | |||||||||
| EW | 0.29 | 0.15 | 0.088 | 0.078 | 0.092 | 0.25 | ||||
| FWHM | 47710 | 50141 | 70852 | 360130 | 35127 | 470170 | ||||
| 16 | 26 | 20 | 45 | 21 | 34 | |||||
| IRAS 083445105 | 287 | |||||||||
| EW | 0.13 | 0.26 | 0.13 | 0.27 | 0.36 | |||||
| FWHM | 60110 | 30013 | 19640 | 310100 | 310140 | |||||
| 39 | 12 | 28 | 30 | 35 | ||||||
| IRAS 085723915N | 340 | |||||||||
| EW | 0.13 | 0.1 | 0.062 | 0.027 | 0.072 | |||||
| FWHM | 440110 | 334.88 | 13945 | 13530 | 27162 | |||||
| 53 | 19 | 37 | 31 | 37 | ||||||
| IRAS 090611248S | 371 | |||||||||
| EW | 0.5 | 0.25 | 0.092 | 0.19 | 0.13 | 0.23 | ||||
| FWHM | 240280 | 32024 | 42199 | 100240 | 26658 | 260110 | ||||
| 120 | 13 | 26 | 96 | 23 | 45 | |||||
| IRAS 091111007 | 223 | |||||||||
| EW | 0.11 | 0.1 | 0.033 | 0.052 | 0.035 | 0.062 | ||||
| FWHM | 290210 | 24613 | 18927 | 31091 | 16425 | 16866 | ||||
| 99 | 12 | 17 | 51 | 20 | 26 | |||||
| IRAS 095834714NE | 247 | |||||||||
| EW | 0.11 | 0.2 | 0.22 | 0.25 | 0.25 | |||||
| FWHM | 063 | 263.66.1 | 41174 | 38459 | 25698 | |||||
| 24 | 12 | 25 | 28 | 38 | ||||||
| IRAS 100354852NE | 237 | |||||||||
| EW | 0.049 | 0.19 | 0.13 | 0.11 | 0.089 | 0.15 | ||||
| FWHM | 061 | 25412 | 31543 | 0240 | 25618 | 20171 | ||||
| 29 | 17 | 35 | 170 | 28 | 44 | |||||
| IRAS 101901322E | 445 | |||||||||
| EW | 0.13 | 0.081 | 0.072 | 0.096 | 0.11 | |||||
| FWHM | 43716 | 41272 | 0130 | 33665 | 32091 | |||||
| 19 | 37 | 140 | 32 | 34 | ||||||
| IRAS 104944424 | 430 | |||||||||
| EW | 0.11 | 0.12 | 0.072 | 0.11 | 0.16 | |||||
| FWHM | 510160 | 404.27.1 | 37738 | 42765 | 36475 | |||||
| 34 | 16 | 29 | 29 | 31 | ||||||
| IRAS 110950238 | 269 | |||||||||
| EW | 0.3 | 0.39 | 0.25 | 0.61 | 1 | |||||
| FWHM | 360180 | 28612 | 35049 | 24143 | 0100 | |||||
| 64 | 18 | 26 | 35 | 130 | ||||||
| IRAS 121120305SW | 159 | |||||||||
| EW | 0.61 | 0.39 | 0.086 | 0.14 | 0.071 | 0.15 | ||||
| FWHM | 380340 | 30321 | 29563 | 220290 | 031 | 18553 | ||||
| 140 | 21 | 42 | 190 | 30 | 33 | |||||
| IRAS 143481447SW | 227 | |||||||||
| EW | 0.15 | 0.19 | 0.12 | 0.083 | 0.14 | 0.2 | ||||
| FWHM | 550120 | 236.88.4 | 45035 | 120210 | 33436 | 12780 | ||||
| 43 | 22 | 35 | 110 | 30 | 40 | |||||
| IRAS 143521954 | 192 | |||||||||
| EW | 0.089 | 0.23 | 0.11 | 0.15 | 0.26 | |||||
| FWHM | 25855 | 205.34.9 | 19358 | 24348 | 16646 | |||||
| 33 | 17 | 37 | 34 | 32 | ||||||
| IRAS 143945332 | 363 | |||||||||
| EW | 0.064 | 0.13 | 0.097 | 0.08 | 0.16 | 0.27 | ||||
| FWHM | 55877 | 381.88.7 | 49022 | 160280 | 42633 | 370110 | ||||
| 33 | 21 | 31 | 170 | 33 | 47 | |||||
| IRAS 152451019E | 283 | |||||||||
| EW | 0.069 | 0.14 | 0.067 | 0.078 | 0.088 | 0.13 | ||||
| FWHM | 075 | 294.67.3 | 30746 | 300210 | 24750 | 30451 | ||||
| 39 | 16 | 30 | 67 | 27 | 25 | |||||
| IRAS 152503609 | 57 | |||||||||
| EW | 0.23 | 0.16 | 0.14 | 0.1 | 0.059 | 0.077 | ||||
| FWHM | 0180 | 147.89.9 | 32388 | 400180 | 22319 | 20434 | ||||
| 200 | 17 | 35 | 60 | 32 | 33 | |||||
| IRAS 154620450 | 285 | |||||||||
| EW | 0.085 | 0.029 | 0.024 | 0.06 | ||||||
| FWHM | 53515 | 29753 | 10243 | 360110 | ||||||
| 24 | 40 | 32 | 44 | |||||||
| IRAS 164875447W | 347 | |||||||||
| EW | 0.18 | 0.34 | 0.29 | 0.39 | 0.89 | |||||
| FWHM | 500140 | 332.39.1 | 37436 | 26554 | 230140 | |||||
| 40 | 23 | 33 | 30 | 78 | ||||||
| IRAS 170285817W | 339 | |||||||||
| EW | 0.097 | 0.13 | 0.078 | 0.13 | 0.14 | 0.25 | ||||
| FWHM | 320130 | 315.68.7 | 25048 | 140170 | 30174 | 33694 | ||||
| 46 | 24 | 33 | 130 | 39 | 45 | |||||
| IRAS 184703233 | 228 | |||||||||
| EW | 0.4 | 0.44 | 0.16 | 0.16 | 0.17 | 0.25 | ||||
| FWHM | 200120 | 258.26.9 | 30568 | 200300 | 31949 | 24950 | ||||
| 51 | 21 | 44 | 120 | 34 | 30 | |||||
| IRAS 194580944 | 269 | |||||||||
| EW | 0.086 | 0.075 | 0.13 | 0.089 | 0.29 | |||||
| FWHM | 390180 | 272.95.1 | 32484 | 23750 | 150110 | |||||
| 58 | 35 | 59 | 47 | 53 | ||||||
| IRAS 200460623 | 244 | |||||||||
| EW | 0.21 | 0.2 | 0.2 | 0.44 | 1 | |||||
| FWHM | 24727 | 190100 | 0140 | 088 | 310170 | |||||
| 14 | 43 | 140 | 60 | 80 | ||||||
| IRAS 200870308 | 595 | |||||||||
| EW | 0.093 | 0.14 | 0.067 | 0.15 | 0.24 | |||||
| FWHM | 270150 | 57423 | 47549 | 570110 | 280280 | |||||
| 48 | 20 | 33 | 30 | 97 | ||||||
| IRAS 204141651 | 515 | |||||||||
| EW | 0.16 | 0.21 | 0.16 | 0.17 | 0.63 | |||||
| FWHM | 400190 | 48820 | 28782 | 460120 | 170180 | |||||
| 71 | 25 | 49 | 46 | 92 | ||||||
| IRAS 215040628 | 256 | |||||||||
| EW | 0.14 | 0.14 | 0.14 | 0.099 | 0.13 | |||||
| FWHM | 230100 | 260.85.6 | 250130 | 31043 | 14440 | |||||
| 52 | 26 | 44 | 43 | 41 | ||||||
| IRAS 224911808E | 128 | |||||||||
| EW | 0.38 | 0.23 | 0.37 | 0.83 | ||||||
| FWHM | 13118 | 052 | 30260 | 430350 | ||||||
| 24 | 41 | 33 | 77 | |||||||
| IRAS 233272913S | 151 | |||||||||
| EW | 0.11 | 0.12 | 0.26 | 0.36 | ||||||
| FWHM | 170130 | 1939 | 110120 | 210120 | ||||||
| 76 | 18 | 77 | 51 | |||||||
| IRAS 233653604 | 186 | |||||||||
| EW | 0.083 | 0.079 | 0.057 | 0.094 | ||||||
| FWHM | 191.15 | 24545 | 21922 | 21639 | ||||||
| 17 | 24 | 25 | 28 |
| Galaxy | SlopeaaBased on PaBr line ratio. | Pa FWHMbbGiven only for definite thermal/fluorescent mixtures (with errors) and for likely mixtures (when both of the observed 2–1 lines are above the rotation temperature prediction). The vibration temperature assumes an ortho-to-para ratio of 2:1 in the 2–1 transition states. | RowsccClassified as consistent with purely thermal, definite mixture of thermal and fluorescence, or possible mixture of the two (with asterisk). | He I | Pa | H2 S(3) | Fe II | H2 S(1) | Br |
|---|---|---|---|---|---|---|---|---|---|
| IRAS 015215224N | 403 | ||||||||
| EW | 0.6 | ||||||||
| FWHM | 190230 | ||||||||
| 170 | |||||||||
| IRAS 052460103W | 54 | ||||||||
| EW | 0.16 | 0.31 | 0.29 | ||||||
| FWHM | 0140 | 7219 | 60100 | ||||||
| 120 | 23 | 77 | |||||||
| IRAS 085723915S | |||||||||
| EW | 0.21 | ||||||||
| FWHM | 019 | ||||||||
| 22 | |||||||||
| IRAS 090611248N | |||||||||
| EW | 0.59 | 0.29 | 0.39 | ||||||
| FWHM | 25276 | 0170 | 25395 | ||||||
| 30 | 140 | 61 | |||||||
| IRAS 095834714SW | 186 | ||||||||
| EW | 0.16 | 0.19 | |||||||
| FWHM | 24641 | 320180 | |||||||
| 31 | 76 | ||||||||
| IRAS 100354852SW | 424 | ||||||||
| EW | 0.23 | 0.54 | 0.13 | 0.14 | 0.17 | ||||
| FWHM | 50160 | 43031 | 320110 | 29247 | 21267 | ||||
| 130 | 31 | 54 | 42 | 48 | |||||
| IRAS 101901322W | 265 | ||||||||
| EW | 0.14 | 0.092 | 0.11 | 0.13 | 0.18 | ||||
| FWHM | 27126 | 40110 | 0150 | 6389 | 150120 | ||||
| 21 | 64 | 170 | 56 | 68 | |||||
| IRAS 121120305NE | 196 | ||||||||
| EW | 0.52 | 0.13 | 0.2 | 0.39 | |||||
| FWHM | 27119 | 40127 | 36649 | 27878 | |||||
| 20 | 36 | 30 | 36 | ||||||
| IRAS 143481447NE | 283 | ||||||||
| EW | 0.3 | 0.35 | 0.15 | 0.25 | 0.5 | ||||
| FWHM | 450160 | 27214 | 21863 | 27476 | 0120 | ||||
| 64 | 23 | 35 | 36 | 100 | |||||
| IRAS 152451019W | 426 | ||||||||
| EW | 0.38 | 0.19 | 0.24 | ||||||
| FWHM | 31070 | 40674 | 7854 | ||||||
| 31 | 42 | 41 | |||||||
| IRAS 170285817E | 0 | ||||||||
| EW | 0.76 | ||||||||
| FWHM | 9733 | ||||||||
| 32 | |||||||||
| IRAS 224911808W | 86 | ||||||||
| EW | 0.38 | 0.2 | 0.21 | ||||||
| FWHM | 0140 | 023 | 099 | ||||||
| 100 | 23 | 160 |
Note. — See notes to Table 3 for details.
Figure 3 presents the two-dimensional spectra around the Pa line for each of the sample galaxies. In each, the horizontal axis origin is located at the center of the primary nucleus. The apertures corresponding to the extractions displayed in Figures 1 and 2 are indicated at the top and bottom of each panel. Annotations to the left and right of each panel denote the sense of the slit orientation, the exact position angles for which are listed in Table 2. The two-dimensional spectrum for IRAS 095834714 has been split into two panels, though the horizontal scale reflects the real separation between the two nuclear components.
4.1 Hydrogen Recombination & Extinction
The band spectra of the galaxies in this sample are dominated by the Pa line, which is the strongest line accessible to search for signs of broad emission. Only in two of the sample galaxies, IRAS 083112459 and IRAS 154620450, is any such emission apparent. Both of these galaxies are optically classified as Seyfert galaxies, so it seems that obscured AGN in ULIRGs are either extremely rare, or suffer a few magnitudes of extinction even at near-infrared wavelengths, as was also suggested by Goldader et al. (1995). A few galaxies, such as IRAS 143481447 and IRAS 143945332 have excess emission on the blue side of the Pa line, but in both cases there appears to be emission from He I contributing significantly to this flux, and no appreciable emission on the red side of the narrow Pa profile. Furthermore, the H2 lines in IRAS 143945332 have an asymmetric blue shape more typical of wind or outflow phenomena than of velocity-broadening due to an AGN. IRAS 200870308 has some hint of broad emission at the base of the Pa line, though not significantly elevated out of the noise, and again confused by He I. As seen in Figure 3, the moderate 600 km s-1 width of the narrow portion of the Pa profile in IRAS 200870308 can be attributed to a steep rotation gradient on the nucleus. The apparent broad base on the Pa line in the southwestern nucleus of IRAS 121120305 may be spurious, as this is the one galaxy in the sample whose spectra were not calibrated by a G star observation, but rather by a template atmospheric spectrum. The excess blue emission happens to be coincident with the significant CO2 atmospheric absorption at 2.00–2.02 m, so that a slight error in estimated column depth results in a large localized continuum offset in the corrected spectrum.
![[Uncaptioned image]](/html/astro-ph/0010077/assets/x15.png)
Figure 3: continued
![[Uncaptioned image]](/html/astro-ph/0010077/assets/x16.png)
Figure 3: continued
The two-dimensional spectra of Pa in Figure 3 demonstrate that the atomic recombination line emission in ULIRGs is almost always dominated by a nuclear component. Several ULIRGs show off-nuclear emission at lower levels, and a couple of sources appear to be primarily characterized by diffuse line emission—namely IRAS 042321436 and IRAS 200460623. When two nuclei are present, the secondary nucleus generally shows emission in Pa as well. Exceptions to this are IRAS 164875447 and IRAS 233272913. The extra continuum object seen in the panel with IRAS 080305243 is a nearby star.
The fraction of the total line emission that is unresolved can be estimated for each ULIRG by computing the flux contribution from a Gaussian spatial profile having the width of the estimated seeing and sharing the maximum amplitude of the spatial line emission distribution. Comparing this flux with the measured flux provides an upper limit to the fraction of light contained within an unresolved core. Most of the primary ULIRG nuclei are consistent with being unresolved, with a median seeing of 10 and a median physical resolution of 1.4 kpc. The scatter in the estimated fraction of unresolved flux is at the 20% level, mostly due to uncertainty in the seeing estimate. Only 8 of the 33 ULIRGs have estimated unresolved contributions lower than 80%, such that the majority of ULIRGs contain most—if not all—of their Pa emission within the central 1 kpc radius. Only three ULIRGs in the sample (IRAS 042321436, IRAS 184703233, and IRAS 200460623) have less than 50% of their Pa flux in an unresolved core.
The sample was chosen to allow coverage of both the Pa and Br emission lines so that a comparison between these lines could be made in order to assess extinction to the line emitting source. Table 5 lists the inferred visual extinction values for the sample galaxies. These estimates assume an intrinsic ratio for PaBr of 12.1 (Osterbrock, 1989, Case B with cm-3 and K), and and (interpolated from the extinction law of Rieke & Lebofsky, 1985).
Though there exists very little leverage in wavelength between Pa and Br, some ULIRGs are apparently obscured enough to show definite reddening across this short range. Typical 1 errors on the extinction estimates are around 5 magnitudes, though the actual errors could be larger if disparate aperture sizes were used in the spectral extractions. Indeed, each of the four ULIRGs with extinctions more negative than 1 have aperture differences between the Pa and Br spectra of at least 50%. Almost half of the ULIRGs have estimated extinctions greater than the 1 limit, and 11 have at least 2 extinction estimates—typically corresponding to mag, with many in the range of mag.
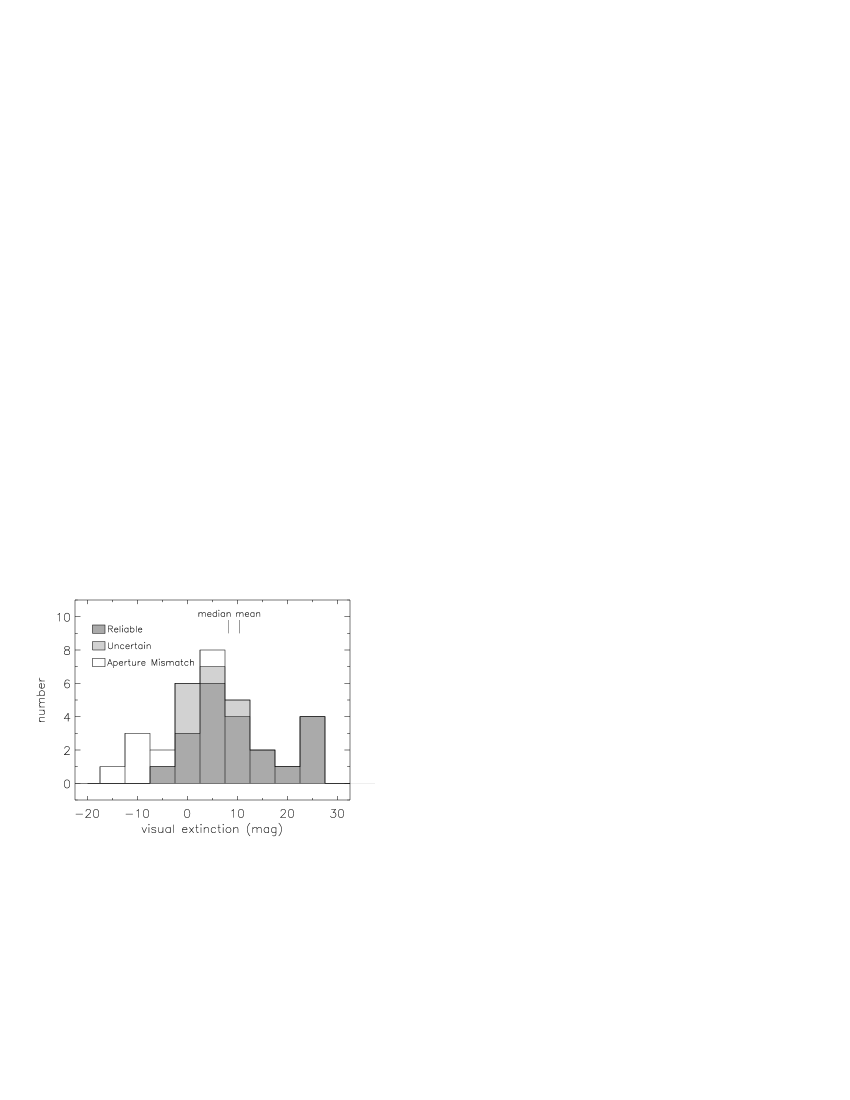
Figure 4 presents the extinction measurements in histogram form. Different shading represents varying levels of confidence in the measurement. Higher extinction estimates are allowed greater variance in classifying their reliability, provided they are significantly different from zero extinction. Counting only the 22 ULIRGs with reliable extinction measures, the median visual extinction of mag corresponds to an extinction at Pa of approximately one magnitude. This is a lower limit to the nuclear extinction because we can only estimate extinction to the gas we actually detect at 2 m, which very likely is peripheral to the nuclear region. Nonetheless, one magnitude of extinction at Pa would not readily hide the presence of a central AGN. The very large visual extinctions of 25 mag seen in some ULIRGs translate to almost 4 mag of extinction at Pa, which almost certainly would hide an AGN from view with the currently achieved signal-to-noise ratio in the ULIRG spectra.
| Galaxy | ExtinctionaaBased on PaBr line ratio. | H2 Line Parameters | ||
|---|---|---|---|---|
| bbGiven only for definite thermal/fluorescent mixtures (with errors) and for likely mixtures (when both of the observed 2–1 lines are above the rotation temperature prediction). The vibration temperature assumes an ortho-to-para ratio of 2:1 in the 2–1 transition states. | H2 Excitation | |||
| () | (K) | (K) | MechanismccClassified as consistent with purely thermal, definite mixture of thermal and fluorescence, or possible mixture of the two (with asterisk). | |
| IRAS 002624251 | mixture | |||
| IRAS 015215224 | 5000 | thermal | ||
| IRAS 042321436 | thermal | |||
| IRAS 052460103 | thermal | |||
| IRAS 080305243 | thermal | |||
| IRAS 083112459 | ddApertures for the Pa and Br spectral extractions differ by at least 50%. | thermal | ||
| IRAS 083445105 | mixture | |||
| IRAS 085723915 | mixture | |||
| IRAS 090611248 | 3500 | thermal | ||
| IRAS 091111007 | 2700 | thermal | ||
| IRAS 095834714 | ddApertures for the Pa and Br spectral extractions differ by at least 50%. | thermal | ||
| IRAS 100354852 | ddApertures for the Pa and Br spectral extractions differ by at least 50%. | thermal | ||
| IRAS 101901322 | thermal | |||
| IRAS 104944424 | ddApertures for the Pa and Br spectral extractions differ by at least 50%. | 3500 | thermal | |
| IRAS 110950238 | mixture | |||
| IRAS 121120305 | 5000 | thermal | ||
| IRAS 143481447 | thermal | |||
| IRAS 143521954 | thermal | |||
| IRAS 143945332 | 2800 | thermal | ||
| IRAS 152451019 | thermal | |||
| IRAS 152503609 | ddApertures for the Pa and Br spectral extractions differ by at least 50%. | mixture | ||
| IRAS 154620450 | thermal | |||
| IRAS 164875447 | thermal | |||
| IRAS 170285817 | thermal | |||
| IRAS 184703233 | thermal | |||
| IRAS 194580944 | thermal | |||
| IRAS 200460623 | thermal | |||
| IRAS 200870308 | thermal | |||
| IRAS 204141651 | thermal | |||
| IRAS 215040628 | thermal | |||
| IRAS 224911808 | thermal | |||
| IRAS 233272913 | thermal | |||
| IRAS 233653604 | mixture | |||
Because an active galactic nucleus is believed to indicate the presence of a QSO (quasi-stellar object) in the galaxy nucleus, one may quantify the amount of obscuration necessary to hide a central AGN by estimating the extinction required to hide the line flux expected from the high-velocity wings of Pa in a typical QSO of the appropriate bolometric luminosity. For this purpose, we use the median QSO spectrum presented in Murphy et al. (1999) to represent the appearance of an unobscured quasar. Identifying the region around 1.881 m ( km s-1 redward of the Pa line center) as being well away from the narrow Pa emission, we measure the median QSO flux density to be 22% higher than the QSO continuum level. It is found that the broad Pa emission from an exposed QSO contributing half the bolometric luminosity of a ULIRG would be comparable at 1.881 m to the typical ULIRG continuum emission (neglecting the contribution from the QSO continuum). Therefore, hiding the presence of the broad emission requires an attenuation factor that is comparable to the signal-to-noise ratio of the ULIRG continuum. In the case of the median ULIRG spectrum presented in Murphy et al., this translates to an extinction at Pa of 4.4 mag, and therefore a visual extinction, mag. The spectra of the individual ULIRGs presented here typically have continuum signal-to-noise ratios around 20, so that mag, or –25 mag of extinction is required to hide a QSO at half the ULIRG luminosity. Details on this calculation appear in Appendix B.
The estimates of extinction made in this way are conservative in two regards. First, the aperture photometry of ULIRGs used to establish typical continuum flux densities are based on 5′′ apertures, such that extra flux is included from diffuse emission away from the nucleus. In smaller apertures corresponding to the spectral extractions employed in this paper, the ULIRG continuum is diminished, while the spatially unresolved QSO component would be hardly affected, thus increasing the QSO-to-ULIRG contrast considerably, making the QSO more difficult to conceal. The second conservative aspect is that the criterion of forcing the broad Pa from the QSO to lie at the 1 level on the ULIRG continuum would not hide the broad emission very effectively, the reason being that the 1 level is computed for a single pixel (one-quarter of a resolution element). When summed over a few resolution elements (i.e., up to the narrow shoulder of the Pa line), the broad signal would stand out at more than the 3 level.
The result that, given the current level of sensitivity, at least 25 magnitudes of visual extinction are required to obscure a QSO in a typical ULIRG, together with the paucity of detections of low-level broad line emission—especially evident in the median spectrum of Murphy et al. (1999)—leads us to conclude that AGN are either rare in ULIRGs, or very deeply buried. There are five ULIRGs in the present sample with measured extinctions based on the Pa/Br ratio that are high enough to hide AGN without requiring additional attenuation. We are unable to determine the likelihood that the rest of the ULIRGs have the requisite nuclear extinctions to hide the presence of AGN.
The technique of comparing ULIRG spectra to a typical QSO spectrum can also be used to estimate the extinction to the broad-line region seen in IRAS 154620405. Based on the flux density at 1.881 m, the Pa emission contributes an additional 9% to the continuum level, some of which is likely continuum emission from the QSO itself. Correcting for this, one finds an excess over the assumed ULIRG continuum (60% of the total continuum) measuring 15%, suggesting an extinction mag, or mag.
4.2 Molecular Hydrogen Emission
The most abundant species of line emission in the ULIRG spectra arise from the vibration-rotation spectrum of molecular hydrogen. The molecular hydrogen emission shows up strongly in all of the primary nuclei of this sample. Three or four lines are typically present in each spectrum, most notably the odd rotation state 1–0 transitions. The H2 line strengths vary by more than one order-of-magnitude relative to Pa. Figure 5 shows the range of observed line ratios, comparing the H2 1–0 S(1) line to Pa. A typical ULIRG has a H2 1–0 S(1)Pa ratio around 0.15, varying from to 0.40. One galaxy, IRAS 002624251 exhibits H2 emission even stronger than the Pa line. The bins in Figure 5 are shaded to reflect the classification of the H2 excitation mechanisms, as will be discussed below.

The apparent weakness of the even rotation transitions is an indication that the emission is thermally excited, as the thermal condition produces three times as many odd (ortho) states as even (para) states. This so-called ortho-to-para ratio is more typically in the range of 1.0–1.8 for fluorescent excitation conditions (Black & van Dishoeck, 1987). In addition, the lack of strong emission from the 2–1 vibration transition indicates a thermal origin.

Population diagrams were constructed for each of the primary nucleus extractions in the sample, and each characterized in terms of rotation temperature, vibration temperature (where appropriate) and classified in terms of thermal or mixed thermal/fluorescent excitation. The construction of population diagrams is discussed in Appendix C. Examples of these diagrams are shown in Figure 6. The even rotation state transitions are plotted as two points representing ortho-to-para ratios of 3:1 and 1:1. The 3:1 points, represented by boxes in Figure 6, are almost always preferred over the 1:1 points (asterisks) appearing below them. The great majority of ULIRGs in this sample have no detections in the 2–1 transition lines, but with error bars consistent with purely thermal excitation. Solid lines in Figure 6 represent rotation temperature fits, and dashed lines, where present, indicate the vibration temperature separating 1–0 and 2–1 points. A few ULIRGs appear to be definite mixtures of thermal and fluorescent excitation, with the population diagrams showing the 2–1 data points well above the rotation temperature line passing through the 1–0 points. A number of other ULIRGs have somewhat elevated 2–1 measures, with both the S(2) and S(4) lines above the 1–0 rotation temperature line, but with error bars that are still consistent with pure thermal emission. The excitation characterizations are summarized in Table 5. For the mixed cases, a vibration temperature estimate is given, assuming that the high energy states exist with a lower ortho-to-para ratio, likely around 2:1. This has been observed in other mixed excitation cases (e.g., Tanaka et al., 1989), and is explained by the fact that the enhanced 2–1 transition emission arises from molecules that are primarily excited by fluorescent processes, and thus reflect an ortho-to-para ratio closer to that expected for pure fluorescence.
One point that should be mentioned in the context of the line population diagrams is the possible blend of a 2.0024 m [Fe II] line with the H2 2–1 S(4) line at 2.0035 m. The expected flux ratio between the [Fe II] line at 1.9670 m and that at 2.0024 m is 2–3:1. With the 1.9670 m line appearing to be present in a number of ULIRGs, it is to be expected that the H2 2–1 S(4) line will suffer some contamination by the [Fe II] line. Indeed, the population diagrams often show an anomalously high 2–1 S(4) line flux, with an incompatibly low 2–1 S(2) flux. There is a good correlation between such cases and galaxies for which the 1.9670 m [Fe II] line is believed to be present.
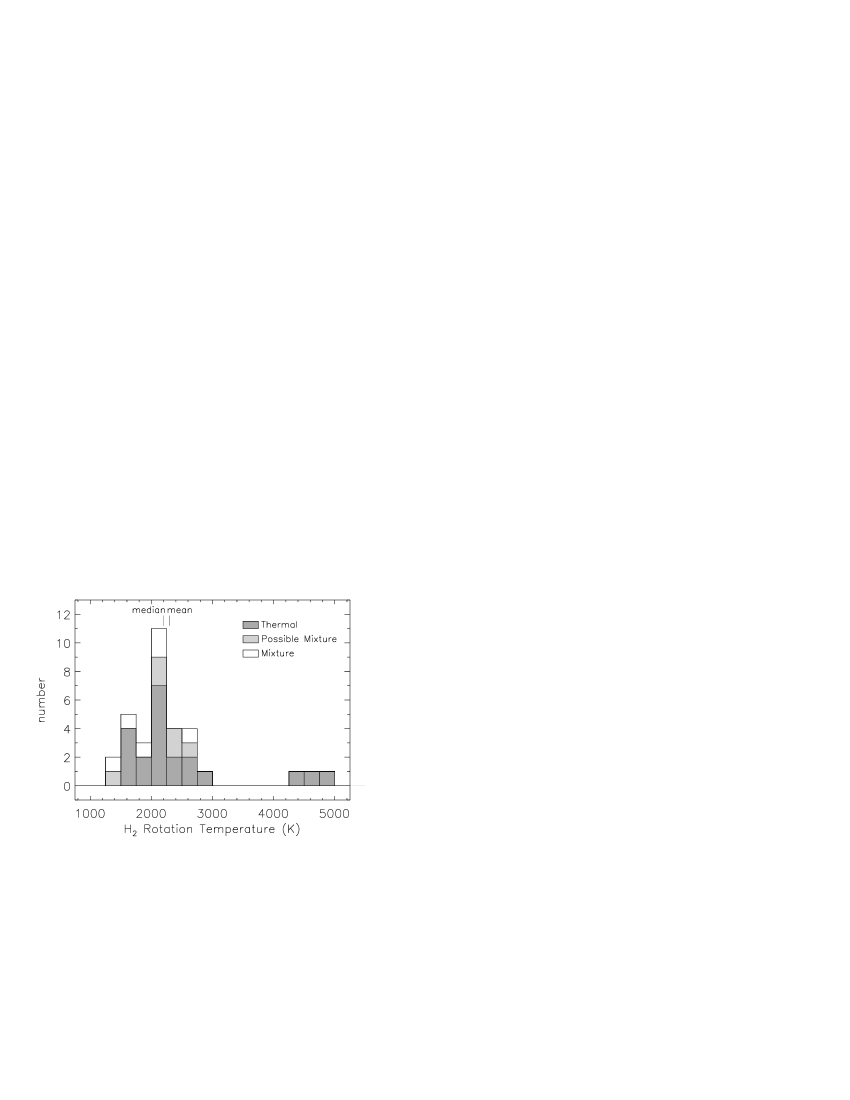
Figure 7 illustrates the distribution of H2 rotation temperatures, indicating a strong clustering around 2200 K. Two of the three ULIRGs with estimated rotation temperatures in excess of 4000 K are classified as having AGN. It is possible in these cases that a significant fraction of the H2 emission arises from molecular gas excited by X-ray radiation from the central source. Draine & Woods (1990) found this mechanism to be the most viable source of H2 excitation in NGC 6240, with the X-rays in this instance most probably arising from frequent supernovae or from merger-induced shock activity. Table 8 of Appendix C provides expected H2 line ratios in the thermal regime across the 1.8–2.4 m wavelength range.
Referring to Figure 5, there does not appear to be an overwhelming trend between H2 line strength—relative to Pa—and excitation mechanism, except for a possible slight tendency for mixtures to be seen among the brighter lines. This could simply be a consequence of higher signal-to-noise levels for the weak 2–1 lines in those galaxies with bright H2 lines. More mixed states may be revealed with greater sensitivity, most likely in those cases identified here as possible mixtures.
4.3 Other Emission Line Strengths
The He I line111The He I emission line just blueward of Pa is a combination of two lines at 1.86860 and 1.86969 m, both of the same – transition, but the former a triplet state and the latter a singlet. As such, the shorter wavelength line is three times stronger than the longer wavelength line, with a centroid wavelength of 1.8689 m. The splitting between lines is less than half a resolution element for the present spectra, so that the line combination is treated as one. is detected in the majority (27/33) of the primary nuclear spectra, and in a number of the secondary spectra. The noise-weighted mean of detected He IPa is 0.058, with a relatively small dispersion of about this value. The median He IPa ratio is 0.063 among detected lines, and 0.056 including non-detections as zero-valued points. The full range of detected ratios goes from 0.02 (IRAS 152453609) to about 0.11 (IRAS 143481447; IRAS 143945332). Lower resolution near-infrared spectra could easily mistake this line for a blue wing on the Pa line.
The [Fe II] line at 1.9670 m appears in several spectra, most notably the primary nuclei of IRAS 002624251, IRAS 091111007, IRAS 152451019, and IRAS 152503609, and the secondary nucleus of IRAS 101901322. These stronger [Fe II] emitters have [Fe II]Pa ratios up to 0.05, though IRAS 002624251, with its weak Pa, has a ratio around 0.12. There are many possible line detections near the noise limit that have typical [Fe II]Pa ratios around 0.01–0.02. Lines weaker than 1% of Pa are generally too weak to be detected with confidence. The [Fe II] line reported for IRAS 083112459 is possibly confused with the wing of [Si VI]. A more thorough analysis of this line complex at slightly higher resolution does not find conclusive evidence for the [Fe II] line in this galaxy (Murphy et al., 2000a).
Searching for the 1.9629 m [Si VI] line was a primary motivation for the present spectroscopic survey. With a 167 eV excitation potential, this line indicates a high probability of the presence of an active nucleus. While it is possible to produce Si5+ atoms via powerful shocks, Marconi et al. (1994) find that photoionization is the more likely excitation mechanism among a sample of nearby Seyfert galaxies. As stars are incapable of producing significant quantities of photons at this high energy, the natural photoionization source is an active nucleus with its power-law spectrum extending into the far-ultraviolet wavelength range.
Only one galaxy in the sample of 33 has prominent [Si VI] emission. IRAS 083112459 has a very strong [Si VI] line, comparable in strength to the adjacent H2 1–0 S(3) line, and appearing broader than the other lines in the spectrum. A detailed discussion of the [Si VI] line in this galaxy can be found in Murphy et al. (2000a) and Murphy et al. (1999).
The only other galaxy in the sample with possible [Si VI] emission is IRAS 052460103. The spectrum of this galaxy shows emission at the expected position of [Si VI], with a signal-to-noise ratio of 5. The adjacent H2 line appears broad on the short-wavelength side as well, calling into question the nature of the emission on the long-wavelength side of this line. No emission appears at this position in the secondary nucleus spectrum of Figure 2, ruling out a problem with atmospheric calibration or related issues. The H2 1–0 S(1) line appears unresolved in the primary nucleus, strongly suggesting that the [Si VI] emission is real. While IRAS 052460103 has no evidence of broad line emission, it does have a peculiar radio spectrum. Crawford et al. (1996) find this galaxy to be a gigahertz-peaked-spectrum (GPS) radio source, with a 6 cm flux density much higher than that measured at 20 cm. This condition is not found in many ULIRGs, with the Parks (PKS) galaxy IRAS 134511232 being the only other 2 Jy ULIRG identified as a GPS source. This galaxy may also have [Si VI] emission, as reported by Veilleux, Sanders, & Kim (1997), though the blend with the H2 line at their lower resolution makes it difficult to estimate the relative contribution of [Si VI]. The rest of the H2 lines in IRAS 134511232, as presented in Veilleux, Sanders, & Kim, indicate a H2 rotation temperature around 2500 K, in which case the [Si VI] line would account for 30% of the total combined line flux. IRAS 134511232 does show impressive broadening of the Pa line, clearly standing out as an AGN-dominated source. While IRAS 052460103 has a similar radio spectrum to IRAS 134511232, it is almost three orders of magnitude less luminous at 20 cm, according to Crawford et al. Perhaps there is a low-luminosity active nucleus component to IRAS 052460103, with the total infrared luminosity dominated by star formation.
4.4 Relative Nuclear Velocities
The double nucleus ULIRGs often exhibit strong Pa emission from both nuclei, which can be used to study orbital dynamics of the galactic pair. Table 6 lists the relative radial velocities for the 12 ULIRGs with measured Pa velocities on both nuclei. The reported errors are considerably smaller than would be obtained by simply subtracting the velocities presented in Table 4 from those in Table 3, reflecting the fact that the relative velocities are not affected by systematic errors associated with wavelength calibration or slit illumination.
| Galaxy | Relative Velocity | Projected Separation |
|---|---|---|
| (km s-1) | (kpc) | |
| IRAS 015215224 | aaFrom Murphy et al. (2000b). The current dataset yields . | 7.6 |
| IRAS 052460103 | 9.8 | |
| IRAS 085723915 | 5.8 | |
| IRAS 090611248 | 7.2 | |
| IRAS 095834714 | 37.5 | |
| IRAS 100354852 | 11.2 | |
| IRAS 101901322 | 5.3 | |
| IRAS 121120305 | 3.7 | |
| IRAS 143481447 | 4.7 | |
| IRAS 152451019 | 3.4 | |
| IRAS 170285817 | 23.0 | |
| IRAS 224911808 | 2.2 |
Surprisingly, the velocity differences are very small, with the largest difference at 120 km s-1. Random projection effects diminish the observed relative velocities statistically by a factor of two, as the most probable observing configuration involves pure angular motion on the plane of the sky. If all ULIRGs have the same relative nuclear velocity, random orientations would produce a distribution of observed velocities described by a cosine curve, with the peak at zero observed relative velocity. Binning the data from Table 6 into 50 km s-1 bins, the best fit to a cosine function has a maximum velocity of about 190 km s-1, shown in Figure 8. Using 40 km s-1 bins results in a 165 km s-1 maximum relative velocity.

The lack of high relative velocities among ULIRGs contrasts with the predictions obtained either from simple Newtonian calculations or from more sophisticated -body models of galaxy interactions which include gas dynamics and dynamical friction. Below we discuss these two approaches, with attention to how these models might be modified to match the observations.
First, we will treat the galaxies as point masses approaching each other from far away. These calculations assume conservative dynamics—i.e., that all loss of potential energy is converted into kinetic energy of the galaxies. In reality some fraction of the energy is lost to dynamical friction, which is why the galaxies do eventually merge. The foregoing discussion will not explicitly treat the frictional component, but will concentrate on the more basic elements of merger dynamics that offer much greater latitude in the ultimate relative velocities calculated. In the point mass scenario, the galaxies would reach a relative velocity in excess of 1300 km s-1 at a separation distance of 10 kpc, assuming total system masses of per galaxy. Even ten times less mass per galaxy results in over 400 km s-1 of relative motion at 10 kpc. Changing the initial separation from infinity to 100 kpc or 50 kpc reduces these speeds by 5% and 10%, respectively.
The high velocities computed above are obviously not consistent with the observations, but perhaps understandably given that galaxies are not well represented by point masses at close range. Galaxy masses are dominated by very large dark halos that act to soften the potential gradients—i.e., accelerations—experienced during a close encounter.
Dark halos are thought to exist based on the anomalously flat rotation curves of galaxies to very large radii. Such phenomena suggest the enclosed spherical mass is proportional to radius, such that the circular rotation velocity, is constant. Rotation curves of large samples of galaxies via optical emission lines (e.g., Dale et al., 1999) indicate that this scaling persists at least out to 10–15 kpc. Observations in H I find a continuation of the flat rotation curves at radii 2–3 times the optical radii, often to 20–30 kpc (e.g., Casertano & van Albada, 1990; Fich & Tremaine, 1991). Assuming a spherical halo distribution, the total halo mass following the scaling is given by
where is the circular velocity, and is the outer dimension of the halo distribution. Under this prescription, two galaxies falling from infinity are moving with a relative velocity of by the time the halos touch, or when the galaxies are apart. The galaxies will clearly accelerate even more as the separation decreases to kpc, even though the acceleration is somewhat moderated by the effect of overlapping halo masses. This already presents a problem in that the observed relative velocities are less than the typical rotation velocities observed in ULIRGs.

The simulations by Mihos & Hernquist (1996) provide a means of evaluating encounter velocities via models employing realistic halo potentials and dynamical friction. Output from these models is shown in Figure 9. The model defines a halo that yields a total galaxy mass of when scaled to the Milky Way’s rotation velocity. The halo has a relatively small physical extent, containing most of its mass within 25 kpc, and with an effective cutoff radius at 40 kpc. The simulations start with identical galaxies approaching from infinity (parabolic orbits), resulting in time-averaged velocities of km s-1 when the nuclei are between 4–25 kpc apart. This average sums over first, second, and third encounters. The peak velocities are in the neighborhood of 500 km s-1, as seen in Figure 9. Starting the galaxies from rest at a 100 kpc separation rather than infinity reduces the peak velocities by only %.
Many ULIRGs are found at times well after the first major encounter, judging by the fact that their tidal features, formed at the epoch of the first significant encounter, are often vastly more extended than the nuclei are separated. However, some ULIRGs are believed to be experiencing their first major encounter (Murphy et al., 2000b). Looking at the first-encounter and late-encounter model predictions separately, the simulation discussed above predicts first-encounter velocities averaging 475 km s-1, after which the galaxies separate by 50 kpc, followed by a final merger sequence with an average velocity around 275 km s-1, ranging from 0–500 km s-1 during this time.
Models with larger-scale halos maintaining the same internal rotation structure demand higher total masses, resulting in increased net velocity differences between the merging galaxies. On the other hand, if ULIRGs lacked any halo material past 10 kpc, corresponding to total masses around , the galaxies would behave much more like point masses, and dynamical friction would be less important. In this scenario, the 10 kpc velocities would be approximately 400 km s-1.
It is very difficult to reproduce the small observed relative velocities among ULIRGs with simple physical models—with or without large halos. ULIRGs are massive, gas rich galaxies with rotation velocities and near-infrared absolute magnitudes characteristic of galaxies at least as massive as the Milky Way. The highest observed relative velocity in this sample is a mere 120 km s-1, though the observed distribution is consistent with a typical deprojected velocity difference of 200 km s-1. Some ULIRGs have been observed with velocity differences very near this value (e.g., IRAS 200460623; IRAS 192527245: Murphy et al., 2000b; Mihos & Bothun, 1998), but none are seen near the 400 km s-1 value as expected from a variety of physical predictions.
One possibility deserves mention, which is that during the late-merger state, eccentric orbits may conspire with the delay in coordinating the accumulation of fuel for a nuclear starburst in such a way as to select ULIRGs at the apocenters of their orbits, when velocities are low. Referring to Figure 9, during the final merger process (well after the initial encounter), the nuclear orbits are very eccentric, owing to the removal of angular momentum, largely by tidal debris. The very high velocity peaks near 500 km s-1 are associated with the close passages. If the ultraluminous activity is episodic in nature, with relatively short duration bursts occurring in reaction to transitory tidal disruptions, then the ULIRGs we see may represent stages shortly after these close encounters. A finite time is required to organize gas motions in response to the close encounter, with the ultraluminous activity turning on only after a significant gas concentration has been established. It is not difficult to imagine in this scenario that the gas—moving more slowly than the galaxy, but with less distance to travel—will reach the nucleus at approximately the same time that the galaxies reach apocenter. Keeping in mind that we are discussing the events occurring after the second close encounter, the orbital timescale is yr, such that apocenter is reached a few yr after close approach. This timescale is in rough agreement with expectations of the dynamical timescale within a few kpc of the nucleus—the region from which the fuel for the nuclear event is gathered. During the final merger process, it is possible that several ultraluminous bursts occur following close interactions of the nuclei. The idea of repetitive starbursts in the final stages of merging was first explored by Noguchi (1991), though in the context of cloud-cloud collisions in this case. The scheme proposed here of delayed—and potentially episodic—bursting would bias late-merger ULIRGs to larger separations and therefore lower velocities, quite possibly consistent with the observed distribution. The problem with first encounter ULIRGs remains, since the average first encounter velocity is around 475 km s-1. Unfortunately the current sample is not large enough to probe possible differences in the velocity distributions of early and late ULIRG encounters.
5 Summary
Near-infrared spectra in the 2 m window have been obtained for a nearly complete, volume-limited sample of 33 ULIRGs. Lines of atomic hydrogen and helium recombination, molecular hydrogen vibration-rotation, [Fe II], and [Si VI] are seen in the spectra. The Pa is predominantly seen as a nuclear event, with the majority of the emission arising in the central kpc of most ULIRGs. Initiated as a search for optically hidden active galactic nuclei, this survey reveals only two such galaxies, both of which are characterized as Seyfert galaxies based on visible-light spectra. It is found via comparison of the Pa and Br lines that significant extinction of several magnitudes persists into the near-infrared bands, such that buried active nuclei can not be ruled out in many objects. It is estimated that with the sensitivity of the current survey, at least 25 mag of visual extinction would be needed to hide a QSO with half the bolometric luminosity of the ULIRG.
Strong molecular hydrogen emission is seen in all of the primary nuclear spectra. The molecular hydrogen spectrum indicates that most H2 emission in ULIRGs stems from thermal excitation rather than fluorescent processes. Some ULIRGs appear to have a small fraction of their molecular hydrogen emission owing to fluorescence, though none approach pure fluorescence.
The relative radial velocities found in this sample of ULIRGs does not exceed km s-1, with an inferred maximum deprojected velocity differential of around 200 km s-1. This relatively low velocity differential is difficult to produce from interactions between galaxies with masses comparable to that of the Milky Way using simple physical assumptions. It is suggested that ULIRGs in the late stages of merging may be selectively found near the time of apocenter, leading to a lower average relative velocity between nuclei.
Appendix A Procedures for Measuring Line Properties
The line properties reported in Tables 3 and 4 represent measured values from the spectra, rather than Gaussian fit parameters. Especially for the weaker lines, the quality of the continuum subtraction is vital to proper line characterization. This is done with a simultaneous multiple Gaussian line fit and quadratic continuum fit. In all but a few cases, this results in a very close fit to the continuum. For those few cases where the continuum fit is questionable, some of the weaker lines are excluded from Tables 3 and 4. All of the fitting procedures make use of the noise estimate computed on a pixel-by-pixel basis, as described earlier. In the end, the noise is scaled slightly (typically by factors of less than 30%) in order to make the final reduced chi-squared value equal to one. The scaled noise is used in estimating errors on the values in Tables 3 and 4. Each of the line parameters is computed based on the following line definition procedure. Each potential line is searched for by summing two resolution elements (7 pixels) of information around the line center, and determining if there is emission above the continuum exceeding 2.5. For lines satisfying this condition, cutoffs are established on the red and blue sides of the line center by the following rules:
-
1.
If the spectrum extends below the continuum level, establish a cutoff, including only positive valued points.
-
2.
If there exists a local minimum, followed by at least three higher points, assume that the following points belong to another line and exclude them, keeping only the minimum point.
-
3.
If the next two pixels are between 0–1 above the continuum, include them and quit.
These procedures obviously can not practice the same discrimination that a diligent scientist might, but we find that a reasonable job is performed—especially on lines whose boundaries are obvious to the eye. Nonetheless, lines with a final computed equivalent width measuring less than 2.5 are typically excluded, though those that appear to be real in the one-dimensional spectra are preserved. Conversely, a few lines with reported detections greater than 2.5 are excluded on the basis of either poor local continuum fit or simply less-than-believable results.
Because the weaker lines do not have a well defined full-width at half-maximum, the FWHM values in Tables 3 and 4 are based on a combination of line flux and peak amplitude. If a Gaussian shape is assumed, the FWHM of the line would be equal to the line flux divided by the peak amplitude, times the proportionality constant of . Performed in this manner, it is relatively simple to compute the error of such an estimate. A strict measure of the FWHM is provided in Tables 3 and 4 for the Pa line in each galaxy for comparison to the value estimated by this technique. All of the reported FWHM values have been reduced to intrinsic line widths by subtracting the instrumental resolution in quadrature. Each spectrum uses the measured line widths in the wavelength calibration spectrum as a basis for the decomposition. Values in Tables 3 and 4 for which the measured line width is exceeded by the instrumental width are listed as unresolved lines of zero width. Almost all of the lines in this survey are resolved, typically around 200–300 km s-1 in width.
The velocity measurements in Tables 3 and 4 are indicated relative to Pa, though the Pa velocity itself is expressed as a direct quantity in km s-1. These values are simply computed as first-moment measures in the spectral lines, with error estimates computed from the noise estimates in a straightforward way. Added to this error estimate is a wavelength calibration error, assumed to be 10–15 km s-1, and a slit placement error. The latter uncertainty attempts to estimate the wavelength offset induced by a non-uniform slit illumination. When the line source is spatially compact enough to produce a discernible peak somewhere in the slit, the location of this peak within the slit influences the ultimate wavelength associated with this emission. For these purposes, it is assumed that the line source has a real physical size roughly half that of the continuum, which is almost always spatially resolved. Further, it is assumed that the source is centered in the slit with a Gaussian 1 placement error of one-quarter of a slit width. Only cases of exceptional seeing result in an appreciable error from this source, with a median error estimate of 15 km s-1 and a maximum of 38 km s-1. Despite the accounting of uncertainties, the velocities indicate a dispersion outside of the error budgets that is not correlated with line species or grating setting. It may well be that the variable spectral range over which the line is summed is largely responsible for determining the offset, as the range is biased to contain only positive points, and will extend as far as possible from the line center to include such points. With the large moments generated from distant points, the estimated velocity may wander far from its true center. Thus the values of velocity in Tables 3 and 4, especially for weaker lines, are perhaps of little use. Gaussian fit centers may do a better job of appropriately representing the line velocities.
Appendix B Estimating Extinction to Hidden AGN
The median QSO spectrum is constructed from nine optically identified QSOs in the redshift range , seven of which have available band photometry. Comparing the absolute band magnitudes to bolometric luminosities of the quasars, one finds the approximate relation . The median infrared luminosity of the 31 non-AGN ULIRGs in the present sample is . A QSO within a ULIRG that contributes half of the bolometric luminosity—most of which is reprocessed into the infrared—would then have , or mag. This establishes the band flux density of the QSO continuum. At a rest wavelength of 1.881 m, corresponding to km s-1 in velocity, it is found that the median QSO has an excess flux density due to Pa measuring 22% of the baseline continuum level (Murphy et al., 1999). Thus the absolute magnitude of the line emission at this velocity is mag.
Typical ULIRG continuum levels can be approximated in a similar way as that above, using 5′′ aperture photometry of the sample galaxies where available (Kim, 1995; Murphy et al., 2000b). Eight of the 31 non-AGN ULIRGs have measurements, and comparing to the infrared luminosity (8–1000 m) leads to the relation . Therefore the typical non-AGN ULIRG in this sample, with a median luminosity , has mag.
The expected ratio of broad Pa to the ULIRG continuum at 1.881 m is then 0.92, with the 1 range extending from 0.44 to 1.91. If a given ULIRG has a spectrum with a signal-to-noise ratio , then diminishing the QSO Pa to the 1 level requires
where represents QSO contributions to continuum and line flux, is the ULIRG continuum contribution, and is the attenuating factor. With the additional relations that and , we find that the required attenuation is , or magnitudes at Pa. The visual extinction is roughly 7 times this value.
Appendix C Molecular Hydrogen Diagnostics
C.1 Population Diagrams
The specific mechanism responsible for the H2 emission can be investigated via population diagrams. By accounting for various degeneracies, transition probabilities, and photon energy, one may compute the relative populations of the upper states of each transition based on the observed line flux. In pure thermal equilibrium, the population levels will follow an exponential profile with respect to upper state energy. More formally, the intensity of a given transition is described by
where the upper and lower states are denoted by the 1 and 2 subscripts, represents vibration state, the rotation state, the ortho/para degeneracy, the transition probability, the emitted photon frequency, the upper state energy, and the equilibrium temperature. Therefore a logarithmic plot of the line intensities divided by the terms multiplying the exponential above produces a linear relation against the upper energy scale with a slope proportional to the inverse of the temperature. The physical parameters for selected band transitions are given in Table 7.
| Transition | aaTaken from Turner, Kirby-Docken, & Dalgarno. (1977). | bbTaken from Dabrowski (1984). | ||
|---|---|---|---|---|
| (m) | ( s-1) | (K) | ||
| 1–0 S(0) | 2.22268 | 2 | 2.53 | 6471 |
| 1–0 S(1) | 2.12125 | 3 | 3.47 | 6951 |
| 1–0 S(2) | 2.03320 | 4 | 3.98 | 7584 |
| 1–0 S(3) | 1.95702 | 5 | 4.21 | 8365 |
| 1–0 S(4) | 1.8914 | 6 | 4.19 | 9286 |
| 1–0 S(5) | 1.8353 | 7 | 3.96 | 10341 |
| 2–1 S(0) | 2.3550 | 2 | 3.68 | 12095 |
| 2–1 S(1) | 2.2471 | 3 | 4.98 | 12550 |
| 2–1 S(2) | 2.1536 | 4 | 5.60 | 13150 |
| 2–1 S(3) | 2.0729 | 5 | 5.77 | 13890 |
| 2–1 S(4) | 2.0035 | 6 | 5.57 | 14764 |
| 2–1 S(5) | 1.9443 | 7 | 5.05 | 15763 |
| 2–1 S(6) | 1.8942 | 8 | 4.30 | 16880 |
| 2–1 S(7) | 1.8523 | 9 | 3.38 | 18107 |
| 3–2 S(3) | 2.2008 | 5 | 5.63 | 19085 |
When the molecular hydrogen is not in thermal equilibrium—such as may be the case in fluorescent excitation by ultraviolet photons—a diagram such as that described above will not show all points lying along a common line, but rather disconnected linear segments, with common vibration states each defining a line connecting the different rotation states. The characteristic temperature of this line is referred to as the rotation temperature, . Ideally, each vibration state has the same characteristic rotation temperature, and these segments can be connected with another line characterized by a vibration temperature, . The thermal case simply has . Typically, pure fluorescent conditions are characterized by —1400 K, and –6000 K (Black & van Dishoeck, 1987; Takayanagi, Sakimoto, & Onda, 1987). Excitation conditions associated with thermal processes are typically found to have –2400 K, with a slight difference between rotation and vibration temperatures characterized by (Tanaka et al., 1989; Hasegawa et al., 1987; Beckwith et al., 1983).
C.2 Typical Band H2 Line Ratios
Because ULIRGs tend to show relatively uniform H2 emission properties—namely those corresponding to thermal emission at 1500–2500 K—it may be useful for other researchers to have a table of expected H2 line strengths in the band for a range of typical temperatures. Table 8 provides such a reference, with line intensities normalized to the H2 1–0 S(1) line. These estimates assume an ortho-to-para ratio of 3:1, and , as is found empirically (Tanaka et al., 1989; Hasegawa et al., 1987). In order to regain the pure thermal regime characterized by a single temperature, the 2–1 entries in Table 8 should be multiplied by , and the 3–1 transition multiplied by , lowering these values considerably.
| Transition | (m) | K | K | K | K |
|---|---|---|---|---|---|
| 1–0 S(0) | 2.22268 | 0.228 | 0.211 | 0.201 | 0.187 |
| 1–0 S(1) | 2.12125 | 1.000 | 1.000 | 1.000 | 1.000 |
| 1–0 S(2) | 2.03320 | 0.336 | 0.374 | 0.398 | 0.438 |
| 1–0 S(3) | 1.95702 | 0.805 | 1.019 | 1.174 | 1.450 |
| 1–0 S(4) | 1.8914 | 0.177 | 0.261 | 0.329 | 0.468 |
| 1–0 S(5) | 1.8353 | 0.295 | 0.519 | 0.728 | 1.211 |
| 2–1 S(0) | 2.3550 | 0.015 | 0.030 | 0.045 | 0.083 |
| 2–1 S(1) | 2.2471 | 0.068 | 0.143 | 0.225 | 0.441 |
| 2–1 S(2) | 2.1536 | 0.023 | 0.053 | 0.089 | 0.191 |
| 2–1 S(3) | 2.0729 | 0.055 | 0.145 | 0.259 | 0.622 |
| 2–1 S(4) | 2.0035 | 0.012 | 0.037 | 0.072 | 0.197 |
| 2–1 S(5) | 1.9443 | 0.020 | 0.072 | 0.156 | 0.496 |
| 2–1 S(6) | 1.8942 | 0.003 | 0.014 | 0.033 | 0.124 |
| 2–1 S(7) | 1.8523 | 0.004 | 0.020 | 0.054 | 0.246 |
| 3–2 S(3) | 2.2008 | 0.003 | 0.016 | 0.045 | 0.202 |
Note. — This table assumes that . To recover a strictly thermal regime (), multiply the 2–1 transistions by and the 3–2 transition by .
References
- Beckwith et al. (1983) Beckwith, S., Evans, N. J., Gatley, I., Gull, G., & Russel, R. W. 1983, ApJ, 264, 152
- Black & van Dishoeck (1987) Black, J. H., & van Dishoeck, E. F. 1987, ApJ, 322, 412
- Carico et al. (1990) Carico, D. P., Graham, J. R., Matthews, K., Wilson, T. D., Soifer, B. T., Neugebauer, G., & Sanders, D. B. 1990, ApJ, 349, L39
- Casertano & van Albada (1990) Casertano, S. & van Albada, T. S. 1990, in Baryonic Dark Matter, ed. D. Lynden-Bell & G. Gilmore (Dordrecht: Kluwer) p. 298
- Clements et al. (1996) Clements, D. L., Sutherland, W. J., McMahon, R. G., & Saunders, W. 1996, MNRAS, 279, 477
- Crawford et al. (1996) Crawford, T., Marr, J., Partridge, B., & Strauss, M. A. 1996, ApJ, 460, 225
- Dabrowski (1984) Dabrowski, I. 1984, Can. J. Phys., 62, 1639
- Dale et al. (1999) Dale, D. A., Giovanelli, R., Haynes, M. P., Hardy, E., & Campusano, L. E. 1999, AJ, 118, 1468
- Draine & Woods (1990) Draine, B. T., & Woods, D. T. 1990, ApJ, 363, 464
- Fich & Tremaine (1991) Fich, M., & Tremaine, S. 1991, ARA&A, 29, 409
- Genzel et al. (1998) Genzel, R., et al. 1998, ApJ, 498, 579
- Goldader et al. (1995) Goldader, J. D., Joseph, R. D., Doyon, R., & Sanders, D.B. 1995, ApJ, 444, 97
- Hasegawa et al. (1987) Hasegawa, T., Gatley, I., Garden , R. P., Brand, P. W. J. L., Ohishi, M., Hayashi, M., & Kaifu, N. 1987, ApJ, 318, L77
- IRAS PSC, Explanatory Supp. (1988) IRAS Point Source Catalog, Explanatory Supplement, eds. Beichman, C. A., Neugebauer, G., Habing, H. J., Clegg, P. E., & Chester, T. J. 1988 (U.S. GPO, Washington, D. C.)
- Kim (1995) Kim, D.-C. 1995, Ph.D. thesis, University of Hawaii
- Kleinmann & Hall (1986) Kleinmann, S. G., & Hall, D. N. B. 1986, ApJS, 62, 501
- Larkin et al. (1996) Larkin, J. E., Knop, R. A., Lin, S. Matthews, K., & Soifer, B. T. 1996, PASP, 108, 211
- Marconi et al. (1994) Marconi, A., Moorwood, A. F. M., Salvati, M., & Oliva, E. 1994, A&A, 291, 18
- Mihos & Hernquist (1996) Mihos, J. C., & Hernquist, L. 1996, ApJ, 464, 641
- Mihos & Bothun (1998) Mihos, J. C., & Bothun, G. D. 1998, ApJ, 500, 619
- Murphy et al. (1996) Murphy, T. W., Armus, L., Matthews, K., Soifer, B. T., Mazzarella, J. M., Shupe, D. L., Strauss, M. A., & Neugebauer, G. 1996, AJ, 111, 1025
- Murphy et al. (1999) Murphy, T. W., Soifer, B. T., Matthews, K., Kiger, J. R., & Armus, L. 1999, ApJ, 525, L85
- Murphy et al. (2000a) Murphy, T. W., Soifer, B. T., Matthews, K., Armus, L. 2000a, AJ, October, in press (astro-ph/0006318)
- Murphy et al. (2000b) Murphy, T. W., Soifer, B. T., Matthews, K., & Armus, L. 2000b, ApJ, submitted
- Noguchi (1991) Noguchi, M. 1991, MNRAS, 251, 360
- Oliva & Origlia (1992) Oliva, E., & Origlia, L. 1992, A&A, 254, 466
- Osterbrock (1989) Osterbrock, D. E. 1989, Astrophysics of Gaseous Nebulae and Active Galactic Nuclei (Mill Valley: University Science Books)
- Rieke & Lebofsky (1985) Rieke, G. H., & Lebofsky, M. J. 1985, ApJ, 288, 618
- Rigopoulou et al. (1999) Rigopoulou, D., Spoon, H. W. W., Genzel, G., Lutz, D., Moorwood, A. F. M., & Tran, Q. D. 1999, AJ, 118, 2625
- Sanders et al. (1988) Sanders, D. B., Soifer, B. T., Elias, J. H., Madore, B. F., Matthews, K., Neugebauer, G., & Scoville, N. Z. 1988, ApJ, 325, 74
- Soifer et al. (1987) Soifer, B. T., Sanders, D. B., Madore, B. F., Neugebauer, G., Danielson, G. E., Elias, J. H., Lonsdale, C. J., & Rice, W. L. 1987, ApJ, 320, 238
- Strauss et al. (1990) Strauss, M. A., Davis, M., Yahil, A., & Huchra, J. P. 1990, ApJ, 361, 49
- Strauss et al. (1992) Strauss, M. A., Huchra, J. P., Davis, M., Yahil, A., Fisher, K. B., & Tonry, J. 1992, ApJS, 83, 29
- Takayanagi, Sakimoto, & Onda (1987) Takayanagi, K., Sakimoto, K., & Onda, K. 1987, ApJ, 318, L81
- Tanaka et al. (1989) Tanaka, M., Hasegawa, T., Hayashi, S. S., Brand, P. W. J. L., & Gatley, I. 1989, ApJ, 336, 207
- Turner, Kirby-Docken, & Dalgarno. (1977) Turner, J., Kirby-Docken, & Dalgarno, A. 1977, ApJS, 35, 281
- Veilleux, Sanders, & Kim (1997) Veilleux, S., Sanders, D. B., & Kim, D.-C. 1997, ApJ, 484, 92