VLBI imaging of the gravitational lens MG J0414+0534
Abstract
We observed the quadruple gravitationally lensed image of MG J0414+0534 on 23 November 1997 with a global VLBI array at 8.4 GHz. We report wide-field imaging results of its four components at submilliarcsecond resolution, displaying complex core-like and jet-like extended structures. A simple model combining a singular isothermal ellipsoid to represent the main lens galaxy, external shear, and a singular isothermal sphere to represent an additional, nearby object accounts well for the core positions and flux densities of the VLBI images. This model predicts delays between the different lensed images of several weeks.
Key Words.:
Techniques: interferometric — Galaxies: jets — Galaxies: quasars: individual: MG J0414+0534 — Cosmology: gravitational lensing1 Introduction
The gravitationally lensed image of QSO MG J0414+0534 ( (Lawrence et al. law95 (1995)), , also PKS 0411+05, 4C 05.19, and DA 131) with four components separated by up to 2 arcseconds is one of the best examples of morphology produced by an elliptical gravitational potential (Hewitt et al. hew92 (1992), Katz et al. kat97 (1997)). The lens appears to be an elliptical galaxy (Schechter & Moore sch93 (1993)), at a redshift (Tonry & Kochanek ton99 (1999)).
Different studies in radio using the VLA have provided important information about the structure of the gravitational lens (Moore & Hewitt (moo97 (1997)) and references therein). Hubble Space Telescope (HST) observations show an optical arc joining the three brightest components (Falco et al. fal97 (1997)). VLBI images of this radio source show some extended structure in the sub-images (Patnaik & Porcas pat96 (1996), Porcas por98 (1998)).
We have undertaken a project of multi-epoch observations of the quadruple images of each of the gravitationally lensed objects MG J0414+0534 and B1422+231, to compare possible structural changes in the lensed images and measure possible shifts in the relative positions of the components. These shifts would be caused by intrinsic changes in the lensed object or by an alteration of the alignment in the system observer-lens-lensed object due to relative proper motion of the latter two elements (see Kochanek et al. koc96 (1996)). For non-magnified extragalactic objects and peculiar velocities of, say, 100 to 1000 km s-1, such relative proper motions would not be detectable astrometrically over decades. Because of their high degree of symmetry, quadruple gravitationally lensed systems can magnify intrinsic velocities by factors of 10–100 while minimizing systematic effects for measurements of relative motions (Kochanek et al. koc96 (1996)).
2 Observations and data reduction
We observed MG J0414+0534 at 8.4 GHz on 23 November 1997 with a global VLBI array for over 12 hr. We used a basic integration time of 0.4 s. The antennas used were (name, diameter, location): Medicina (32 m, Italy), Noto (32 m, Italy), Effelsberg (100 m, Germany), DSS63 (70 m, Spain), the Very Long Baseline Array (VLBA) (10 antennas of 25 m across the US), the phased-VLA (130 m-equivalent, NM, US), and DSS14 (70 m, CA, US). Data were recorded with right circular polarization using mode 128-2-2, achieving a bandwidth of 32 MHz, and correlated at the National Radio Astronomy Observatory (NRAO) VLBA Correlator (Socorro, NM, US). The observing mode put the correlator close to most demanding performance, taking advantage of its latest technical improvements (actually, achieving the smallest sample interval –widest channel bandwidth– with the highest spectral resolution –largest delay range– in the used mode). The antennas pointed to the center of the field of the four images of the radio source (all within the individual antenna beam at the same time) and only one correlation pass was needed to determine the interferometric visibilities jointly for the four components. Due to operational reasons, the strongest of the four components (A1, see below) was chosen as phase center at correlation time.
The observing duty cycle consisted of 2 min on the calibrator source TXS 0357+057 and 5.5 min on the target source MG J0414+0534. We allocated some calibrators and fringe-finders (BL 1803+784, QSO 1928+738, BL 2007+777, 3C 84 and 3C 345) at the beginning and the end of the observations.
We analyzed the data using the Astronomical Image Processing System (aips, version 15oct99). We applied a priori amplitude calibrations determined from the measured system temperatures and available antenna gains. We aligned the phase slopes across each of the 16 MHz bands using the information from each telescope, when available. In the absence of this information, we applied manual phase calibration deduced from observations of TXS 0357+057, 3C 84, and 3C 345. We then performed standard fringe-fitting on the calibrators and the target source. We made a preliminary map of MG J0414+0534 by down-weighting (tapering) the longest baselines to gain sensitivity to extended surface brightness. We used this initial image to perform a second fringe-fit data correction in aips.
Since the total angular size of MG J0414+0534 is 2 arcseconds, wide-field imaging techniques (see, e.g., Garrett et al. gar99 (1999)) are needed. At a given frequency, the field of view of a VLBI map is determined by the averaging time of the data and the bandwidth of the observation (see, e.g., Cotton cot99 (1999), Bridle & Schwab bri99 (1999)). Over-averaging in frequency and time leads to bandwidth- and time-smearing, respectively. For our data, we averaged every four 0.25 MHz channels at the two 16 MHz frequency bands to obtain 32 frequency channels, each of 1 MHz width. Later on, to speed up the mapping process, we time-averaged in 4 s intervals (shorter averaging times, 1.2 and 2.4 s, did not produce significant variations). The adopted 4 s and 1 MHz averagings avoid both types of smearing, allowing a size of the data set just small enough to be manageable with our computing resources. This wide-field mapping technique allows to image fields of arcsecond-size with milliarcsecond resolution. However, a single mapping field results of unmanageable size. As a solution, the aips task imagr provides a reliable wide-field mapping methodology based on a multi-windowing approach. Our imaging strategy emphasized tapering at the beginning of the mapping process to help recovering most of the extended flux density in the sub-images. In further iterations we lifted the tapering to achieve the full resolution provided by the global VLBI array. Using a hybrid weighting (between uniform and natural, robust=1 in imagr task) at full resolution, the synthesized beam obtained was of 2.551.13 mas (position angle (P.A.) 14.6∘).
3 Imaging results
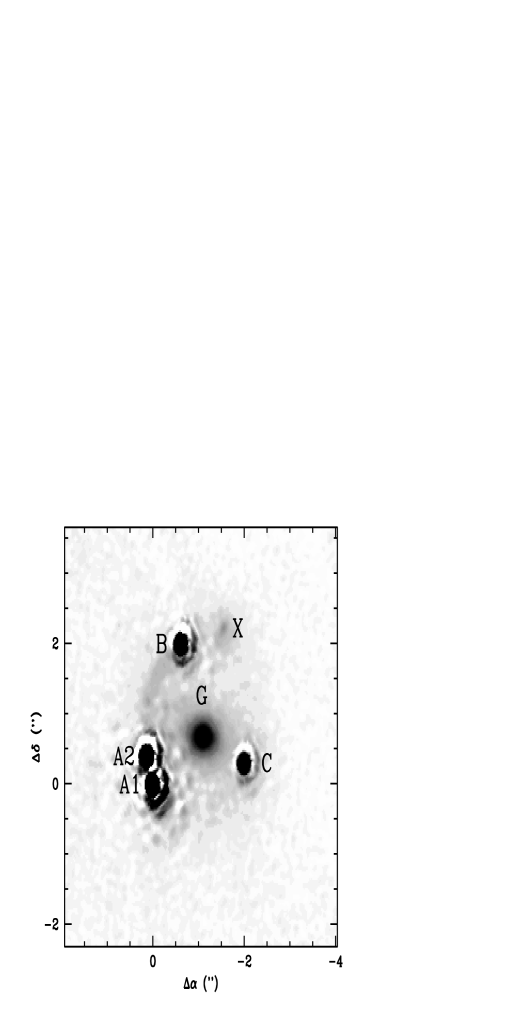
We show the final aips maps in Fig. 1. At the center of Fig. 1, we plot a wide-field image of the source, restored with a circular Gaussian beam 25 mas in diameter to illustrate the location of the four components. At this resolution, MG J0414+0534 comprises two bright, close components (A1 and A2) separated by 047 and two weaker components B and C separated 212 from each other, and 202 and 208 from A1, respectively. We show the map dimensions in the panel corresponding to A1 (bottom, left), preserving the same map scale in the other three sub-images. Each of these sub-images has been restored with the appropriate synthesized beam, which is about mas, P.A. . In Fig. 2, we show more detailed maps of the brightest features of the four sub-images at full resolution. We present in Table 1 their peaks of brightness and the total flux density values () for the whole sub-image and for core-like and jet-like structures, obtained computing the flux densities of the clean components in each of those regions. VLA flux density ratios among sub-images given by Katz & Hewitt (kat93 (1993)) and Katz et al. (kat97 (1997)) are similar to ours. Our results show A1 and A2 somewhat brighter, and B somewhat weaker as their results. It is difficult to compare both data sets, since some flux density present at the VLA may not be detected in the VLBI images.


| corec | jetd | cjetd | |||||||
|---|---|---|---|---|---|---|---|---|---|
| Id | (a) | (a) | (b) | ||||||
| [mas] | [mas] | [mJy/beam] | [mJy] | [mJy] | [mJy] | [mJy] | |||
| A1 | 65.5 | 155.6 | 115.6 | NE: | 33.6 | N: | 7.4 | ||
| A2 | 50.2 | 129.3 | 97.0 | N: | 16.5 | S: | 10.2 | ||
| B | 14.9 | 50.0 | 34.0 | SE: | 10.4 | NW: | 1.0 | ||
| C | 7.9 | 21.6 | 11.8 | N: | 2.1 | — | |||
-
a
Relative position of the peaks of brightness on the maps. The image pixel size is 0.16 mas.
-
b
Total flux densities in the fields shown in Fig. 1.
-
c
Total flux densities for the complex core-like region shown in Fig. 2.
-
d
Total flux densities for the jet-like structures, labelled as jet and c(ounter)-jet.
The gravitational lensing geometry produces four images of the same object, deformed and with different magnification factors. In addition, some lensed, unresolved components might also be fainter than the sensitivity level of our maps, causing some confusion in the feature identification among different sub-images. In our maps, we do not observe isolated, compact components (like in the quadruple lensed object B1422+231) but, rather, very complex structures, with core-like and jet-like regions that show different morphologies for each lensed image.
We discuss in turn the features of each lensed image. Image A1. It is the most complex and the brightest. There are two parallel jet-like components, totally misaligned with respect to the core-like region. The fainter one is 20 mas away, P.A. . The brighter one, very stretched along P.A. begins at about 10 mas southwest of the core-like region, and extends over more than 50 mas. The brightest feature (core-like) has two components along P.A. and a resolved structure. Image A2. Two extended regions not quite co-aligned (in the same direction) are present at about 30 mas to the NE and 80 mas to the SW of the central (core-like) area. The core-like area (Fig. 2, top, left) is symmetric, with two components, elongated over more than 15 mas at P.A. . Image B. It presents two extended jet-like regions, fairly aligned with its central area, at about 70 mas to the NW and SE. The core-like area itself is double and elongated more than 15 mas at P.A. . Image C. It presents a double N-S structure, the northern feature being the brightest, and extended emission to the north of this double structure. The core-like region presents some extended emission to the South.
A comparison of our maps with previously published images of MG J0414+0534 shows that the EVN images at 5 GHz shown in Porcas (por98 (1998)) are similar to our maps, but with a wider beam and lower dynamic range. The same holds for the 1.7 GHz EVN images from Patnaik & Porcas (pat96 (1996)). The optical image from Falco et al. (fal97 (1997)) shows emission extending over an arc joining A1, A2 and B.
4 Lens models
Quadruple gravitational lens systems can be produced by an elliptical lensing potential. Many attempts have been made to model MG J0414+0534 (e.g. Kochanek koc91 (1991), Hewitt et al. hew92 (1992), Witt et al. wit95 (1995)). Falco et al. (fal97 (1997)) could not find models that were simultaneously consistent with the brightest features of the optical images and the lower-resolution radio data from the VLA (e.g., Katz & Hewitt kat93 (1993)). The image flux densities at radio wavelengths have shown little variation, and have not yielded time delays (Moore & Hewitt moo97 (1997)). We show below that the addition to the lens model of a previously known but unsuspected lens galaxy near the images suffices to account for the properties of the images. This new model also predicts time delays between the different lensed sub-images.
We fitted a simple lens model to our VLBI data. Because the lens galaxy G is not detected in these data, we used the deep HST NICMOS H-band (m) image from the CfA/Arizona Space Telescope Lens Survey (CASTLES; e.g., Falco et al. fal99 (1999)) to estimate the coordinates of the center of brightness and the structural parameters of the lens galaxy G (see Fig. 3). We registered the VLBI and point-like infrared images by assuming that the infrared positions of A1, A2, B and C correspond to the peaks of brightness of each of the four VLBI sub-images. The transformation that maps the infrared coordinates to those of a or b is a scale change (to take into account a chip position and wavelength-dependent uncertainty of mas in the NICMOS/NIC2 scale) with a rotation (to take into account the uncertainty of in the orientation of HST). We found the transformation to the feature a (b) requires a rotation of () and a scaling by (), with rms residuals of 11 (5) mas. The radio and infrared emission do not emanate necessarily from the same region of the source. Therefore, we adopt the brightest feature a as the 8.4 GHz counterpart of the quasar, and assign to it positional uncertainties of 11 mas, to reflect the uncertainty in the registration. In this paper, we ignore the lensed jet structure because of the difficulty in establishing the correspondence between lensed components along the jets. After ongoing software developments are completed, this aspect will be addressed in a forthcoming paper.
Taking as origin of coordinates the feature a on image A1, we use as constraints for the lens models the 6 relative coordinates of feature a (Table 1) (assuming a conservative 0.5 mas uncertainty in the positions), the coordinates of G, mas, mas, and the 3 peak of brightness ratios from the radio sub-images (with 10% uncertainties due to the possibility of microlensing). We adjusted lens models with a small number of parameters. Our initial model for the mass density distribution is a singular isothermal ellipsoid (SIE), with 5 parameters: the Einstein ring radius , the ellipticity , sky position angle , and coordinates and . SIE models yield values that are consistent with the masses of other lens galaxies (e.g., Lehár et al. leh00 (2000)) and that reflect the properties of elliptical galaxies (e.g., Kochanek et al. koc00 (2000)). As a rule, single mass distributions require external lensing shear to account for the properties of quadruple lens systems (Keeton et al. kee97 (1997)). Therefore, we added external shear with amplitude and position angle to our model. The total number of parameters of our SIE+ model is 7.
We adjusted all 7 parameters of the SIE+ model using the sum of weighted rms residuals for the peak of brightness ratios, the coordinates of G and those of the a feature images as the figure of merit, . The best-fitting parameters of this initial model yielded principally because the lens fell mas away from the observed galaxy. Therefore, we included object X (Schechter & Moore sch93 (1993)) at mas, mas (derived from the CASTLES data) as a possible additional component of the lens. Because X is about 10 times fainter than G, its structure cannot be distinguished from a circular brightness distribution. Thus, we simply assumed X is a singular isothermal sphere (SIS) and added its 3 parameters, , and to the model, where and are constrained by the CASTLES data. We adjusted the resulting 10 parameters of the SIE++SIS model, which therefore has 3 degrees of freedom (DOF). We thus found values that account nearly exactly for all the positions of the images of feature a as well as those of G and X, and also for the ratios of the peaks of brightness at the core-like regions, with a final merit per DOF (arising solely from the constraints in the peak of brightness ratios). The parameters of this model are shown in Table 2. The model predicts that B is the leading image when the source varies: the time delays in a flat cosmology (, km s-1 Mpc-1) are days, days and days, where the error bars are an estimation from the variation of the predicted time delay as the lens model parameters are varied within the region.
| Id | (a) | (a) | (b) | (b) | ||||||||||
|---|---|---|---|---|---|---|---|---|---|---|---|---|---|---|
| [mas] | [mas] | [mas] | (1–) | [°] | (shear) | [°] | ||||||||
| G | 10 | 10 | 1090 | 10 | 0.21 | 0.05 | –83 | 6 | 0.096 | 0.012 | 56 | 4 | ||
| X | 13 | 13 | 180 | 20 | ||||||||||
-
a
Positional offsets are relative to the peak of brightness in the A1 image.
-
b
Angles from North through East.
-
Note:
Parameter uncertainties were estimated from the range over which as each parameter was varied and the remaining parameters were optimized.
Our simple lens model reproduces successfully the data. It is remarkable that: a) the position angle of the SIE model is consistent with that of the light of G (); b) the ratio of the two Einstein ring radii, which scales as the square root of the ratio of luminosities, , is consistent with the brightness ratio of X and G, whose magnitudes differ by mag; and c) the amplitude of the shear is also consistent with that expected from cosmic shear (Bar-kana bar96 (1996)), and with the number of galaxies seen within a radius of arcmin of the lens system (McLeod et al. mcl00 (2000)).
5 Summary
We present detailed state-of-the-art global VLBI images of the gravitational lens system MG J0414+0534. The individual images, separated by distances up to 2 arcseconds, exhibit radio structures extending up to 100 mas. The use of wide-field mapping techniques in very sensitive observations provides high-quality images of extended structures in MG J0414+0534, showing features that extend more than 1500 beam widths across in the E-W direction, and more than 750 N-S.
We reproduce successfully the relative positions and peak of brightness ratios of the radio cores with a lens model consisting of a singular isothermal ellipsoid for the galaxy G, an external shear to it, and a secondary potential given by a singular isothermal sphere associated with object X. The model predicts that B is the leading image and C lags all the other images with delays for all image pairs of several weeks. It is important to notice the alignment of the optical images of the lens galaxy G and the model’s elliptical potential (SIE). The model’s shear is also consistent in amplitude with the expected cosmic shear and from the observed environment (within a radius of arcmin) of the lens system (McLeod et al. mcl00 (2000)). Our model also provides consistency between the luminosity ratio for X and G and the ratio of their Einstein radii. We plan to refine and study further our lens model by adding the constraints provided by the lensed jets, using a new software package for lens modeling developed by Keeton et al. (in preparation) that avoids the problem of matching components along these jets, in the different lensed images.
Acknowledgements.
We are especially grateful to J. Romney for essential help provided during correlation and post-correlation. We acknowledge also R.W. Porcas and A.R. Patnaik for useful discussions. This work has been partially supported by the Spanish DGICYT Grants No. PB96-0782 and PB97-1164 and by European Comission’s TMR-LSF programme, contract No. ERBFMGECT950012. NRAO is operated under license by Associated Universities, Inc., under cooperative agreement with NSF.References
- (1) Bar-kana R., 1996, ApJ 468, 17
- (2) Bridle A. H., Schwab F. R., 1999. Bandwidth and Time-Average Smearing. In: Taylor G. B., Carilli C. L., Perley R. A. (eds) Synthesis Imaging in Radio Astronomy II. ASP Series 180, San Francisco, CA, US, p. 371
- (3) Cotton W. D., 1999. Special Problems in Imaging. In: Taylor G. B., Carilli C. L., Perley R. A. (eds) Synthesis Imaging in Radio Astronomy II. ASP Series 180, San Francisco, CA, US, p. 357
- (4) Falco E. E., Lehár J., Shapiro I. I., 1997, AJ 113, 540
- (5) Falco E. E., Impey C. D., Kochanek C. S., et al., 1999, ApJ 523, 617
- (6) Garrett M. A., Porcas R. W., Pedlar A., Muxlow T. W. B., Garrington S. T., 1999, New Astronomy Reviews 43, 519
- (7) Hewitt J. N., Turner E. L., Lawrence C. R., Schneider D. P., Brody J. P., 1992, AJ 104, 968
- (8) Keeton C. R., Kochanek C. S., Seljak U., 1997, ApJ 482, 604
- (9) Katz C. A., Hewitt J. N., 1993, ApJ 409, L9
- (10) Katz C. A., Moore C. B., Hewitt J. N., 1997, ApJ 475, 512
- (11) Kochanek C. S., 1991, ApJ 373, 354
- (12) Kochanek C. S., Kolatt T. S., Bartelmann M., 1996, ApJ 473, 610
- (13) Kochanek, C. S., Falco, E., Impey, C. D., et al., 2000, ApJ 535, 692
- (14) Lawrence C. R., Elston R., Jannuzi B. T., Turner E. L., 1995, AJ 110, 2570
- (15) Lehár J., Falco E. E., Kochanek C. S., et al., 2000, ApJ 536, 584
- (16) McLeod B. A., et al., 2000, to be submitted to ApJ
- (17) Moore C. B., Hewitt J. N., 1997, ApJ, 491, 451
- (18) Patnaik A. R., Porcas R. W., 1996, In: Kochanek C. S., Hewitt J. N. (eds) Proc. IAU Symp. 173, Astrophysical Applications of Gravitational Lensing. Kluwer, Dordrecht, The Netherlands, p. 305
- (19) Porcas R. W., 1998, In: Zensus J. A., Taylor G. B., Wrobel, J. M. (eds) Proc. IAU Coll. 164, Radio Emission from Galactic and Extragalactic Compact Sources. ASP Series 144, San Francisco, CA, US, p. 303
- (20) Schechter P. L., Moore C. B., 1993, AJ 105, 1
- (21) Tonry J. L., Kochanek C. S., 1999, AJ 117, 2034
- (22) Witt H. J., Mao S., Schechter P. L., 1995, ApJ 443, 18