THE COMA CLUSTER LUMINOSITY FUNCTION FROM ULTRAVIOLET TO NEAR–INFRARED
The Coma cluster luminosity function (LF) from ultraviolet () to the near–infrared ( band) is summarized. In the the LF is very steep, much steeper than in the optical. The steep Coma LF implies that faint and bright galaxies give similar contributions to the total flux and to the total metal production rate. The Coma LF is dominated in number and luminosity by blue galaxies, which are often faint in the optical. Therefore the Coma LF is dominated by star forming galaxies, not by massive and large galaxies. The optical Coma LF is relatively steep () over the 11 magnitudes sampled, but its slope and shape depend on considered filter and magnitude. We found a clear steeping of the FL going from to bands, indicative of the presence of a large number of red dwarfs, as faint as three bright globular clusters. Furthermore, using Hubble Space Telescope images, we discover that blends of globular clusters, not resolved in individual components due to seeing, look like dwarf galaxies when observed from the ground and are numerous and bright. The existence of these fake extended sources increases the steepness of the LF at faint magnitudes, if not deal on. This concern affects previous deep probing of the luminosity function, but not the present work. The near–infrared LF was computed on a near–infrared selected sample of galaxies which photometry is complete down to the typical dwarf () luminosity. The Coma LF can be described by a Schechter function with intermediate slope (), plus a dip at mag. The shape of the Coma LF in band is quite similar to the one found in the band. The similarity of the LF in the optical and bands implies that in the central region of Coma there is no new population of galaxies which is too faint to be observed in the optical band (because dust enshrouded, for instance), down to the magnitudes of dwarfs. The exponential cut of the LF at the bright end is in good agreement with the one derived from shallower near–infrared samples of galaxies, both in clusters and in the field. The faint end of the LF, reaching mag (roughly ), is steep, but less than previously suggested from shallower near–infrared observations of an adjacent region in the Coma cluster.
1 Introduction
Among nearby clusters of galaxies, Coma ( km s-1) is one of the richest () ones. At a first glance, it looks relaxed and virialized in both the optical and X-ray passbands. For this reason it was designed by Sarazin (1986) and Jones & Forman (1984) as the prototype of this class of clusters. The optical structure and photometry at many wavelengths, velocity field, and X-ray appearance of the cluster (see the references listed in Andreon 1996) suggest the existence of substructures. Since these phenomena are also observed in many other clusters (Salvador-Solé, Sanromà, & Gonzáles-Casado 1993), the Coma cluster appears typical also in this respect. Therefore, the Coma cluster, is an ideal target for galaxy studies.
The luminosity function (LF) represents the zero–order statistics of galaxy samples and gives the relative number of galaxies as a function of the magnitude. Almost every quantity is, therefore, “weighted” by the LF, including obvious quantities, such as the galaxy color distribution, and also less obvious ones, such as correlations (see, for example, the discussion on the impact of magnitude limits in the size–luminosity relation by Simard et al. 1999). When the sample is not complete in volume a further “weight” should be added: the selection function. Thus, an accurate knowledge of the LF is important for galaxy studies.
Since different wavelengths carry different informations, the determination of the LF at different wavelenghts is interesting.
In the near–infrared, k corrections are relatively small and well known, thus allowing to observe and to fairly compare galaxies at different redshifts, up to high redshift values. In particular, k corrections are almost independent from the spectral type of galaxies, in such a way that statistics on a population of galaxies are less affected by changes of the morphological composition induced by differential corrections from type to type. Furthermore, galaxies that undergo a starburst are not selected preferentially, as instead happens in the optical, and therefore a sample selection in the near–infrared is less biased by episodic events of star formation. Finally, the near–infrared luminosity is a good tracer of the stellar mass.
In both the single stellar population and continuous star formation scenarios, the luminosity of late–type galaxies appears to be largely dominated by young massive stars, thus implying a direct link between luminosities and star formation rates (e.g. Buzzoni 1989). For all but the very old stellar populations, the traces mainly the emission from young stars (see for instance Donas et al. 1984; Buat et al. 1989), having maximum main sequence lifetime of a few years. Therefore, for star forming galaxies the is a direct measure of the present epoch star formation rate.
The optical luminosity of galaxies provides instead a weighted average of the past to present star formation rate. This is also the waveband observationally easier, allowing us to reach resolution, coverage and dept difficult to achieve in the or the near–infrared bands.
This paper summarizes our recent results on the Coma cluster luminosity function at various wavelenghts. LFs are computed from recent photometric surveys with the FOCA balloon in the , CFH12K at CFHT in the visible, and Moicam at Pic du Pidi in the near infrared.
2 Summary of photometric data
Coma was observed in the by Donas, Milliard, & Laget (1991 & 1995) with a panoramic detector (FOCA, see Milliard et al. 1991). Images have been taken with a filter centered at 2000 Å with a bandwidth of 150 Å and it is complete down to mag and 70% complete in the range mag. Almost the whole cluster (a circle of 1 deg of radius) has been observed.
Multicolor Coma cluster observations have been taken during the CFH12K (Cuillandre et al. 2000) first light at the Canada–France–Hawaii telescope prime focus in photometric conditions. CFH12K is a 12K 8K CCD mosaic camera, whose field of view is 42 28 arcmin2 with a pixel size of 0.206 arcsec. Figure 1 shows our image of the studied portion of the Coma cluster. After discarding areas noisier than average (gaps between CCDs, borders, regions near bright stars and large galaxies, etc.), the usable area for the Coma cluster is 0.29 square degree in and and 0.20 degree sq. in , i.e. and arcmin2, respectively.
The near–infrared Coma LF has been computed from the photometry presented in Andreon, Pelló, Davoust et al. (2000), to which we defer for details. In summary, a arcmin region of the Coma cluster, located arcmin from the centre, have been imaged with the Moicam camera at the 2.0m Bernard Lyot telescope at Pic du Midi. Images were taken in the band under moderate to good seeing conditions (i.e. arcsec), with average exposure time of sec. About 300 objects have been detected and classified by Sextractor version 2 (Bertin & Arnouts 1996) in the best exposed part of our mosaic ( arcmin2).
The band image of studied portion of the Coma cluster is show in Figure 2. It is co–centered to the optical image shown in Figure 1.
3 The Coma LF

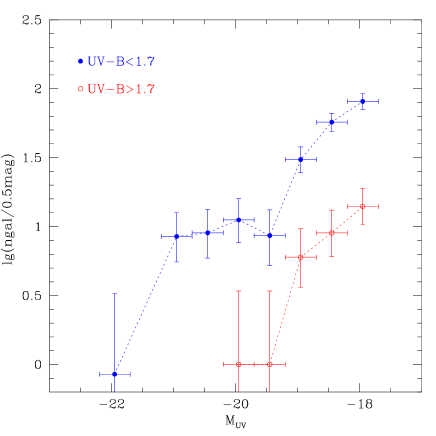
The Coma UV LF is computed in a quite complex way that use both statistical methods and available redshift surveys in the Coma cluster direction (see Andreon 1999 for details). Three improvements apply since the Donas, Milliard, & Laget (1991) paper: the essential galaxy background counts are now available for the LF computation, the number of known redshifts is increased by 60% and a more elaborate statistical treatment is adopted. Figure 3 shows the UV LF. It is the first ever derived for a cluster. Error bars are large, and only the rough shape of the LF can be sketched.
The Coma LF is well described by a power law (or alternatively by a Schechter function with a characteristic magnitude much brighter than the brightest galaxy): a Kolmogorov-Smirnov test could not reject at more than 20% confidence level the null hypothesis that the data are extracted from the best fit (whereas we need a 68% confidence level to exclude the model at ). The best slope is . In terms of the slope of the Schechter (1976) function , this values is . It needs to be stressed, however, that the computed slope of the LF (and in particular its error) depends on the backgound counts, which are quite uncertain.
The steep Coma LF implies that faint and bright galaxies give similar contributions to the total flux, and that the total flux has not yet converged 4 magnitude fainter than the brightest galaxy (or, equivalently, at ). Therefore, in order to derive the total luminosity and hence the metal production rate, it is very important to measure the LF down to faint magnitude limits.
The right panel of Figure 3 shows the bi–variate color–luminosity function, i.e. the LF of red ( mag) and blue ( mag) galaxies. The bulk of the emission comes from blue galaxies while all red galaxies have mag. Therefore, since blue galaxies dominate the LF both in number and luminosity, the Coma LF is dominated by star forming galaxies and not by massive galaxies, which are often faint in . From previous morphological studies (Andreon 1996) it turns out that Coma red galaxies in our sample are ellipticals or lenticulars. The fact that early–type galaxies contribute little to the LF may be explained as a consequence of the fact that these systems have a low recent star formation histories. Please note that in the optical, the LF is dominated at the extreme bright end by the early–type (i.e. red) galaxies (Bingelli, Sandage & Tammann 1988, Andreon 1998), and not by blue ones as it is in .
4 The optical Coma LF
The LF (or, equivalently, the relative space density distribution of galaxies of each luminosity) is computed as the difference between galaxy counts in the Coma and in the control field directions (for an introduction on the method, see, e.g., Oemler 1974; Zwicky 1957). All technicalities, as well as results concerning the optical Coma LF, are described in Andreon & Cuillandre (2000).
Globular clusters (GCs hereafter) are a source of concern when dealing with faint probings of the LF, because their blends contaminate galaxies counts. We discover that this possibility actually arises by comparing archive Hubble Space Telescope images of IC 4051 (Baum et al. 1997), which is an early–type galaxy of the Coma cluster in our field of view, to our ground image. Figure 4 shows the residual image of IC 4051, as seen in our ground image, after subtracting a model of the galaxy (obtained by fitting its isophotes). The only actual galaxies are marked in the left panel by circles. Notice that only one faint object is circled, i.e. it is an actual galaxy. All the other objects are blends of a few GCs, unblended at the HST resolution. Most of them are brighter than our (and other deep probing of the LF) completeness limit, and therefore would be counted as galaxies in the LF. Other GCs blends are present near NGC 4481 (HST images are published in Baum et al. 1995), another bright Coma elliptical in our field of view. The density of these extended (i.e. counted as galaxies) objects can be huge near bright galaxies. Near IC 4051, we found candidate GCs blends per mag per square degree at , which is 40 times larger than background galaxies of the same luminosity. The brightest of them has mag, i.e. there are GC blends mag brighter that the GC turnoff (directly measured by Baum et al. (1997) for this galaxy). Therefore, GC blends do not affect only GCs typical magnitudes ( mag), but also much brighter counts and are pernicious because they are extended sources. Previous works studying the deepest part of the galaxy LF are likely affected by GC blends at faint magnitudes. Thus, the points found in literature at mag should be regarded with caution as long as the area surveyed is comparable (or smaller) than that occupied by bright galaxies. Because of this potential source of error, we generously mask a few bright galaxies with a large GC population and a halo. Residual unflagged contamination is diluted by the very large field of view of our images.
Figure 5 shows (filled points) the Coma cluster LF down to and mag. Notice the large number of galaxies per magnitude bin in our and LFs and the absolute faintness of studied galaxies (, and mag), whose luminosity exceed the tip of the globular cluster LF ( mag) by less than a factor 3 in flux (in the deepest bands). The LF extends over an 11 magnitude range and it is one of the deepest every confidently measured from CCD photometry.
In the band, the LF shape is not well described by Schechter (1976) law, because its best fit has for 18 degrees of freedom. A function with more free parameter better describes the data, as almost always happens when the data quality is good. The best fit with a 3rd order power–law (i.e. with one more free parameter) is overplotted in Figure 5 (smooth curves). The reduced is , suggesting a good fit.
The LFs in the three filters present both similarities and differences. The LFs seem truncated at the bright end (, , mag), then they are fairly flat at intermediate luminosities ( and mag). At fainter magnitudes, the LFs are steep in and , and with a much shallower slope in . Of course, the exact slope depends on the considered magnitude and filter. As a guideline, the typical slope range from in to in . There is, therefore, indirect evidence that most of the faint galaxies in the Coma cluster are red. This indirect evidence can be tested with the data we have, because the individula galaxy color can be computed. This investigation will be included in a future paper, where we shall present the LF bi–variate in color, i.e. the luminosity distribution of galaxies of a given color.
In and no turn–off is seen in the LF at faint magnitudes: the minimal luminosity of dynamically linked object (galaxies) can be as low as the luminosity of just three bright globular clusters. Furthermore, these very faint galaxies dominate, by number, the galaxy LF. In there is an hint of flattening of the LF at faint magnitudes, however at these faint magnitudes errors are quite large, and therefore any definitive conclusion can be drawn.
The shaded regions in Figure 5 delimit the best previous determinations of the LF. In the band, the shaded region is the LF of the “deepest and most detailed survey covering [omissis] a large area” by Trentham (1998a). In the band, Trentham (1998b) summarizes our present knowledge on the LF by computing the composite cluster LF, averaging over almost all literature LFs based on wide field deep images, including seminal papers, such as Sandage, Bingelli & Tammann (1985), for example. The shaded region in the bottom panel shows his result. Our determination is at least of comparable quality with respect to the best previous efforts (see, in particular, the large errorbar of the Trentham (1998a) band LF at faint magnitudes).
To summarize, we compute one of the deepest LF in three bands, over a very large magnitude range (up to 11 mag), with good statistics and our results agree with previous LF determinations on the common magnitude range. We found a clear steeping of the FL from to , indicative of the presence of a large population of red dwarfs in Coma. We also found no turnoff in the Coma LF, i.e. galaxies can be as faint as 3 bright GC, and these galaxies outnumber much brighter galaxies. The derived LFs, in , and have the following pluses (discussed in Andreon & Cuillandre 2000): 1) we have a complete census (in the explored region) of low surface brightness galaxies with central surface brightness almost as low as the faintest so far cataloged galaxies; 2) the explored area is among the largest ever sampled with CCDs at comparable depth for any cluster of galaxies; 3) the error budget includes all source of errors known to date; 4) our derivation of the LF does not discard a priori compact galaxies, as most previous LF determinations (this last point is discussed in Andreon & Cuillandre 2000). Furthermore, using Hubble Space Telescope images, we discover that blends of globular clusters, not resolved in individual components due to seeing, look like dwarf galaxies when observed from the ground and are numerous and bright. The existence of these fake extended sources increases the steepness of LF at faint magnitudes, if not deal on. This concern affects previous deep probing of the LF, but not the present work.
5 The near–infrared Coma LF


The Coma cluster LF is computed statistically as we did in the optical, and fully presented in Andreon & Pelló (2000). In particular, we take into account that an expected and important source of error in the LF determination is the background variance from field to field.
The near–infrared Coma LF is presented in Figure 6. It is characterized by a bright end (at mag), a part increasing gently down to mag, and an “outlier” point at mag, which produces a dip in the Coma LF. The LF displayed in Figure 6 is the deepest ever measured in any near–infrared band for any type of environment for a near–infrared selected sample, reaching , well in the dwarf regime.
In the optical, the Coma cluster exhibits a similar shape (Godwin & Peach 1977; Secker & Harris 1996). Using Godwin, Metcalfe & Peach (1983) data, we computed the (a photographic -like blue filter) Coma LF in almost exactly the same area surveyed in the bandaaaThe optical LF computed in this way seems differ to those computed in from CCD data. The cause of this possible difference is under investigation. Then, because the and band magnitudes are available for all galaxies in this area, we have computed a mean pseudo-color (magnitudes are not measured at the same aperture). No normalization in has been applied. The result of this exercise is shown in Figure 6 as a dashed-line histogram. The two LFs are remarkably similar: there is a close agreement between the cut at mag, the dip location ( mag), the dip amplitude and the increase observed at fainter magnitudes (closed dots) and expected from the LF (dashed histogram). Thus, the shape and the amplitude of the Coma LF seems not to be strongly depend on the wavelength when we compare the results in and in bands.
The strong similarity of the optical and near–infrared LFs implies that in the near–infrared there is no new population of galaxies which disappears in the optical band (because dust obscured, for example), down to the magnitude of dwarfs. Furthermore, if the band LF traces the galaxy mass function in this cluster, the same holds true for the blue LF. This result has been obtained in a particular region of Coma, and could not be generalized without further measures in other environments (field, groups, etc.).
The existence of a dip in the near–infrared LF, which turn out to be not a statistical fluctuation of the smooth LF at the 99.95 % confidence level, allows to discard the hypothesis, suggested by Lobo et al. (1997) that the galaxies brighter than the dip were subjected to a recent episode of star formation induced by the hostile Coma environment, which have made them brighter. In that case, in fact, the dip should be absent or at least highly attenuated in , because the near–infrared luminosity traces the galaxy mass and it is less affected by the short timescale starbursts that make a few galaxies brighter than the magnitude of the dip.
The exponential cut of the LF at the bright end is in good agreement with the one derived from shallower near–infrared samples of galaxies, both in clusters and in the field (see the right panel of Figure 6). This fact is suggestive of a similarity of the tip of the mass function of galaxies, irrespective of the environment where they are found. The dip at mag is instead unique among all the so far measured near–infrared LF, although several published observations are not deep enough or spanning a suitable wide field to distinctly detect this feature. The faint end of the LF, reaching mag (roughly ), is steep, but less than previously suggested from shallower near–infrared observations of an adjacent region in the Coma cluster (de Propris et al. 1998).
The overall slope of the Coma LF is intermediate (). The slope is measured down to the dwarfs regime: we reach using own our data alone and even fainter magnitudes (, roughly equivalent to ) when including Mobasher & Trentham (1998) data and under their assumptions.
6 Short summary and future perspectives
In the previous sections we presented the zero order statistics, i.e. the LF, of galaxies in the Coma cluster, as derived by studying independently our ultraviolet, optical, and near–infrared images.
The combined use of the various datasets offers the unique opportunity of study several other quantities, such as the LF bivariate in color (any combination of ultraviolet, optical and near–infrared color) or the color distribution at each magnitude, because all observations share a 0.3 deg sq. common field of view. The multicolor approach should allow to have a better understanding of the galaxies properties.
The same data allow also the determination of high order moments of the galaxy distribution, such as the luminosity density (). The brightness function, i.e. the number of galaxies of a given central brightness, is also within the reach of the optical and near–infrared data, allowing, for example, to determine whether it is bimodal (Tully & Verheijen 1997) or not.
Acknowledgments
Based on observations collected with the Télescope Bernard Lyot, at the Pic du Midi Observatory, at the Canada–France–Hawaii Telescope and in part at the Hubble Space Telescope. We thanks Florence Durret and Daniel Gerbal for the nice and interesting meeting they organized.
References
References
- [1] Andreon S., 1996, A&A 314, 763
- [2] Andreon S., 1998, A&A 336, 98
- [3] Andreon, S. 1999, A&A 351, 65
- [4] Andreon, S. & Cuillandre J.-C., 2000, ApJ, submitted
- [5] Andreon, S. & Pelló, R. 2000, A&A 353, 479
- [6] Andreon, S., Pelló, R., Davoust, E., Domínguez, R. and Poulain, P. 2000, A&AS 141, 113
- [7] Baum, W. A., et al. 1995, AJ 110, 2537
- [8] Baum, W. A., Hammergren, M. , Thomsen, B. , Groth, E. J., Faber, S. M., Grillmair, C. J. & Ajhar, E. A. 1997, AJ 113, 1483
- [9] Bertin E. & Arnouts S. 1996, A&AS 117, 393
- [10] Binggeli B., Sandage A., Tammann G., 1988, ARA&A 26, 509
- [11] Buat V., Deharveng J., Donas J., 1989, A&A 223, 42
- [12] Buzzoni A., 1989, ApJS 71, 817
- [13] Cuillandre, J.-C., Luppino, G., Starr, B. & Isani, S., 2000, SPIE, 4008, 1010
- [14] De Propris R. , Eisenhardt P. R., Stanford S. A. & Dickinson M. 1998, ApJ 503, L45
- [15] Donas J., Deharveng J., 1984, A&A 140, 325
- [16] Donas J., Milliard B., Laget M., 1991, A&A 252, 487
- [17] Donas J., Milliard B., Laget M., 1995, A&A 303, 661
- [18] Gardner J. P., Sharples R. M., Carrasco B. E. & Frenk C. S. 1996, MNRAS 282, L1
- [19] Jones C., Forman W., 1984, ApJ 276, 38
- [20] Godwin J. G. & Peach J. V. 1977, MNRAS 181, 323
- [21] Godwin J. G., Metcalfe N. & Peach J. V., 1983, MNRAS 202, 113
- [22] Kauffmann G. , Colberg J. M., Diaferio A. & White S. D. M. 1999, MNRAS 303, 188
- [23] Lobo, C., Biviano, A., Durret, F., Gerbal, D., Le Fevre, O., Mazure, A. and Slezak, E. 1997, A&A 317, 385
- [24] Mobasher N. & Trentham B. 1998, MNRAS 293, 315
- [25] Milliard B., Donas J., Laget M., Armand C., Vuillemin A., 1992, A&A 257, 24
- [26] Oemler, A. , Jr. 1974, ApJ 194, 1
- [27] Sarazin C., 1986, X-ray emissions from clusters of galaxies, Cambridge University Press
- [28] Salvador-Solé E., González-Casado G., Solanes J., 1993, ApJ 410, 1
- [29] Sandage, A., Binggeli, B. & Tammann, G. A. 1985, AJ 90, 1759
- [30] Schechter P., 1976, ApJ 203, 297
- [31] Secker J. & Harris W. E. 1996, ApJ 469, 623
- [32] Simard L., Koo D., Faber S., Sarajedini V., Vogt N., Phillips A., Gebhardt K., et al., 1999, ApJ, in press (astro-ph/9902147)
- [33] Szokoly G. P., Subbarao M. U., Connolly A. J., & Mobasher B., 1998, ApJ 492, 452
- [34] Trentham, N. 1998a, MNRAS 293, 71
- [35] Trentham, N. 1998b, MNRAS 294, 193
- [36] Tully, R. B. & Verheijen, M. A. W. 1997, ApJ 484, 145
- [37] Zwicky, F. 1957, Morphological astronomy, Berlin: Springer, 1957