RX J1420.4+5334 – another tidal disruption event? ††thanks: Partly based on observations collected at the German-Spanish Astronomical Centre, Calar Alto, operated by the MPI für Astronomie, Heidelberg, jointly with the Spanish National Commission for Astronomy, and the WIYN telescope, operated the the University of Wisconsin, Indiana University, Yale University, and the National Optical Astronomy Observatories.
Abstract
We have discovered a transient X-ray source, RX J1420.4+5334, which displays a ROSAT flux variation of 150 between the ROSAT All-Sky-Survey in 1990 and a preceding pointed ROSAT observations in July 1990. Optical observations suggest a non-active galaxy as the only visible counterpart. We therefore tentatively identify RX J1420.4+5334 as a tidal disruption event in a non-active galaxy.
Key Words.:
X-rays: galaxies – Accretion – Galaxies: nuclei – Galaxies: individual: RX J1420.4+53341 Introduction
Tidal disruption of stars in the gravitational potential of massive black holes in the centers of galaxies has been recognized long ago as a way to prove the existence of massive black holes in otherwise non-active galaxies. During the tidal disruption about 50% of the mass of the star are stripped off and get unbound from the star (mostly independent of impact parameter, masses and velocities; Ayal et al. 2000). This material can eventually be accreted by the black hole, leading to a flare of optical to X-ray emission lasting a few months to years. While originally proposed to explain the activity in AGN (Hills 1975), a first calculation of the frequency, temporal behaviour and spectral signatures of tidal disruption events (Frank & Rees 1976, Young et al. 1977, Kato & Hoshi 1978, Lidskii & Ozernoi 1979, Gurzadyan & Ozernoi 1980, Gurzadyan & Ozernoi 1981) revealed both, the potential of such events to learn more about the inner regions of galaxies as well as the problems in observing these rare events (Rees 1988).
Over the recent few years, tidal disruption has attracted renewed attention, both theoretically and observationally. Loeb & Ulmer (1997) have studied the case that a surrounding gaseous envelope could reprocess most of the radiation from the accretion process into a thermal spectrum of 104 K, thus being easily detectable in optical surveys rather than in X-ray surveys. Magorrian & Tremaine (1999) have recalculated the stellar disruption rates in detailed dynamical models of real galaxies, taking into account the refilling of the loss cone of stars on disruptable orbits by two-body relaxation and tidal forces in non-spherical galaxies. Ayal et al. (2000) have performed simulations of the long-term evolution of tidally disrupted stars and find that only about 10% of the stellar mass are actually accreted by the central black hole.
On the observational side, the discovery of time-variable UV or X-ray emission in distant, otherwise non-active galaxies may provide the first indirect evidence of tidal disruption events. Besides the early report on a UV flare in NGC 4552 (Renzini et al. 1995), a few very good candidates have been detected with ROSAT during the recent years, such as the erg/s outburst in NGC 5905 (Bade et al. 1996, Komossa & Bade 1999), the erg/s flare in RXJ 1242.6–1119 (Komossa & Greiner 1999), the erg/s flare in RXJ 1624.9+7554 (Grupe et al. 1999), or the erg/s flare in RXJ 1331.9–3243 (Reiprich & Greiner 2000). Interestingly, in all these ROSAT discoveries the X-ray spectrum of the flares is extremely soft, of the order of 50-100 eV effective temperature. The time scales of these events, though not in all cases well constrained, are of the order of months to years. All these properties, together with the fact that none of the corresponding galaxies shows any optical sign of activity have led to the tentative identification as being associated with disruption events.
Here we report on the discovery of another transient X-ray source and the optical and X-ray follow-up observations.
2 Observational results
2.1 ROSAT All-Sky-Survey
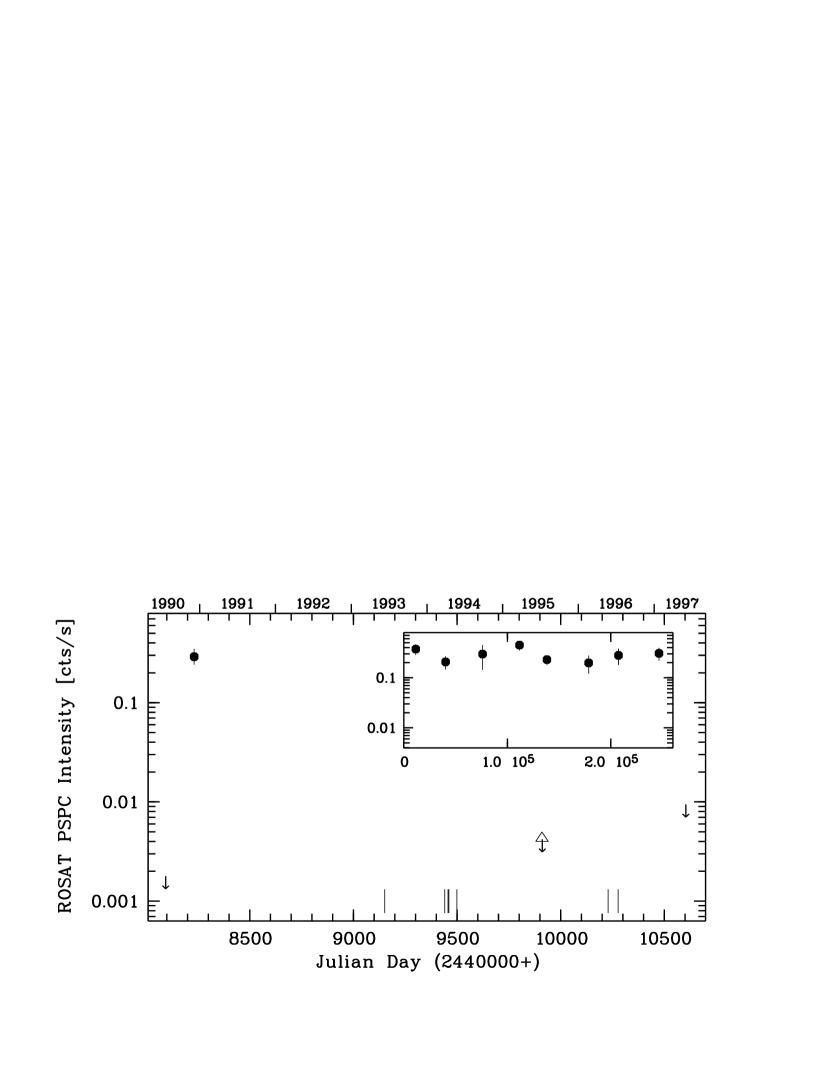
The search for supersoft X-ray sources in the ROSAT PSPC All-Sky-Survey (Greiner 1996) revealed a few sources for which neither confirmation through a ROSAT follow-up observation nor a reasonable optical counterpart could be found. One of these sources is RX J1420.4+5334 1RXS J142024.4+533403 RBS 1376 (Schwope et al. 2000). It was detected during the PSPC All-Sky-Survey between December 5–8, 1990 at a count rate of 0.28 cts/s, resulting in the collection of a total of 255 counts. There is no significant short-term variability within the 3 day scanning coverage. The source position has been determined using only photons above 0.25 keV (to avoid position deterioration by ghost images) to be: RA (2000.0) = 14h20m242, Decl. (2000.0) = +53∘34′11′′ with an error of 20′′.
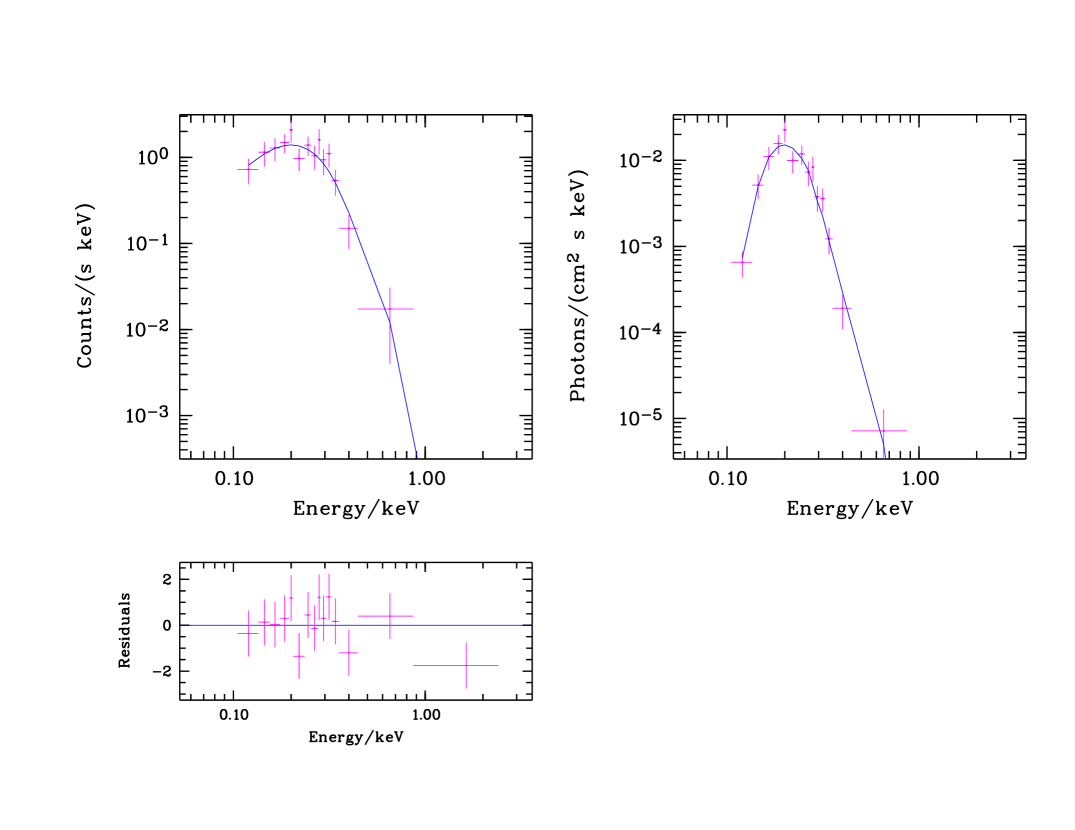
The spectrum is extremely soft as indicated by the hardness ratio: which is defined as (H–S)/(H+S), with H (S) being the counts above (below) 0.4 keV over the full PSPC range of 0.1–2.4 keV. Source photons were extracted with a radius of 4′. The background was chosen at the same ecliptic longitude at 1∘ distance, corresponding to background photons collected typically 15 sec before or after the time of the source photons. Standard corrections were applied using the dedicated EXSAS software package (Zimmermann et al. 1994). The spectrum fitted with a blackbody model is shown in Fig. 2, and Tab. 2 summarizes the fit parameters, also including fits with a power law and an accretion disk model.
2.2 ROSAT pointed observations
Follow-up pointed ROSAT observations were performed on July 10/11, 1995 and again on June 3, 1997. In both cases the HRI was used. In the 1995 observation we detect three X-ray photons at the position of RX J1420.4+5334, corresponding to a likelihood of 6.2 (2.5 ). Because of this marginal significance, we do not claim a detection, but rather use these detected photons as an upper limit (Fig. 1) on the count rate: 5.510-4 HRI cts/s. The mean position of these photons, RA (2000.0) = 14h20m236, Decl. (2000.0) = +53∘34′16′′ with an error of 10′′ is shown in Fig. 3 for comparison purposes. The 1997 observation, with less than half of the 1995 exposure, results in an upper limit of 1.210-3 HRI cts/s.
RX J1420.4+5334 is serendipituously in the field of view of a ROSAT PSPC pointed observation performed during the calibration phase, though at a very large offaxis angle of 49′. No source was detected (using standard EXSAS commands), giving a 3 upper limit of 1.810-3 PSPC cts/s (Fig. 1).
2.3 Optical observations
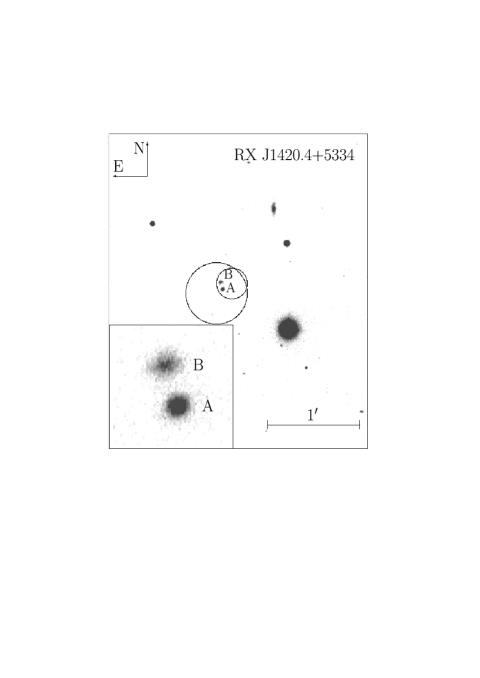
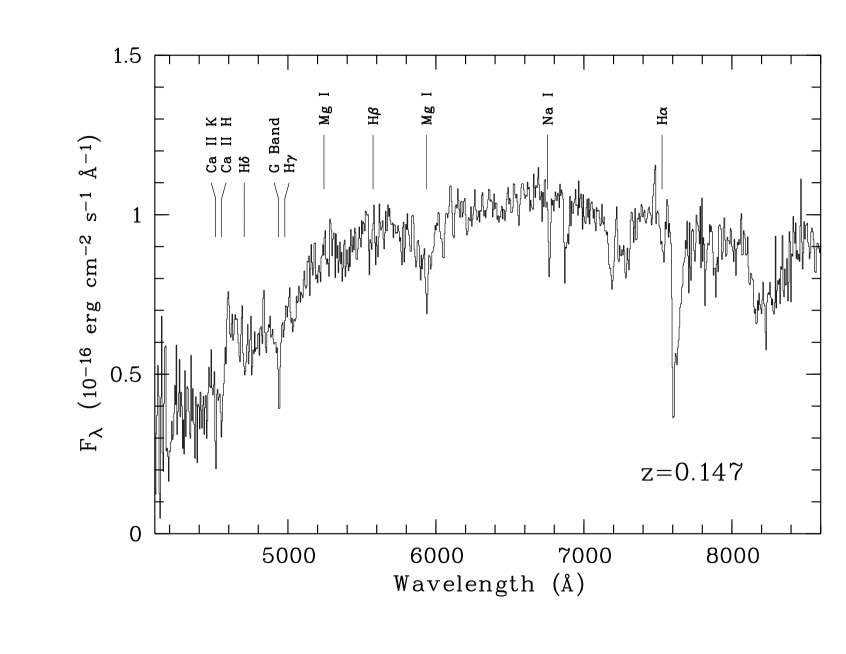
Investigation of the X-ray source position on the POSS revealed only one bright optical object (labelled “A” in Fig. 3), at RA (2000.0) = 14h20m244, Decl. (2000) = 53° 34′ 12′′. We obtained a low-resolution spectrum of this R 18.8 mag source using the 3.5m telescope at Calar Alto on June 13, 1993. We used the Cassegrain spectrograph with a 1024640 RCA chip (pixel size 15 m). A grating with 240 Å/mm was used, allowing the range 4000–8500 Å to be observed with a FWHM resolution of 10 Å. The spectrum was bias and flat-field corrected and calibrated in wavelength using standard MIDAS reduction packages. BD +25∘4655 was used for flux calibration.
The optical spectrum is characterized by strong absorption lines of Na I 5175Å, Mg I 5890Å and H (though it is near the atmospheric A band), typical of an elliptical or early spiral type. Using the Mg I, Na I and H line we derive a redshift of . The Balmer absorption lines and the strong drop of the flux beyond the Ca II H/K break argue against a classification as BL Lac object. No AGN-like forbidden emission lines, like [OIII]5007, are detected.
In order to search for optical variability, we embarked on a more extensive photometry programme. Observations were done at three locations, the Sonneberg Observatory (Germany), the Special Astrophysical Observatory (Russia) and at the WIYN telescope at Kitt Peak (USA). Tab. 1 summarizes the logistic details. Throughout these observations we did not found any significant optical variability.
The imaging revealed a second, much fainter ( mag) source within the X-ray error circle (labelled “B” in Fig. 3). During some of the WIYN observations, at very good seeing conditions of 09, this source is readily seen to be extended (see inset of Fig. 3). Moreover, the intensity distribution over the galaxy disk is very flat. Since active galaxies typically have a very peaked intensity profile (dominated by a bright central source), this flat distribution argues for a non-active galaxy. The shape and radial profile suggest an elliptical or early spiral subtype. Size and luminosity arguments then suggest that its distance is about a factor 3–5 larger than that of source “A”. A lower limit of z0.07 can be placed by assuming mag, corresponding to the faint end of the galaxy luminosity distribution.
Certainly, a spectrum of this galaxy would be very helpful to verify these suggestions.
| Teles- | Date | Filter/ | D(2) | TInt |
| cope(1) | Wavelength | (hrs) | (sec) | |
| X-ray | ||||
| R 150046P | 1990 Jul 19–22 | 0.1–2.4 keV | 77.7 | 11 475 |
| R survey | 1990 Dec 5–8 | 0.1–2.4 keV | 77.8 | 910 |
| R 201999P | 1995 Jul 10/11 | 0.1–2.4 keV | 30.7 | 5560 |
| R 300577H | 1997 Jun 3 | 0.1–2.4 keV | 0.6 | 2150 |
| Optical | ||||
| CA 3.5m | 1993 Jun 13 | 4000–8500 | 3600 | |
| SO 0.6 m | 1994 Mar 30 | white | 2.5 | 30 |
| SO 0.6 m | 1994 Apr 14 | white | 2.9 | 60 |
| SO 0.6 m | 1994 Apr 19 | white | 3.2 | 30 |
| SO 0.6 m | 1994 May 27 | white | 3.0 | 60 |
| WIYN 3.5m | 1996 May 25 | R/B | 1.0 | 270 |
| WIYN 3.5m | 1996 May 26 | B | 0.3 | 500 |
| WIYN 3.5m | 1996 May 27 | B | 0.1 | 500 |
| SAO 1.0m | 1996 Jul 14 | V | 1.5 | 300 |
(1) The abbreviations mean:
R = ROSAT,
SO = Sonneberg Observatory (Germany),
CA = Calar Alto (Spain),
SAO = Special Astrophysical Observatory (Russia).
(2) Duration of the coverage.
| Model(1) | Fit parameters(2) | Flux(3) (0.1-2.4 keV) | Flux(3) (bol.) | |
|---|---|---|---|---|
| bbdy, free fit | = 2810 = 2.00.1 | 0.96 | 7.910-12 | 1.610-11 |
| bbdy, = | = 3810 | 0.90 | 8.810-13 | 4.110-12 |
| powl, free fit | 1.5 = 2.81.0 | 0.96 | 2.410-12 | – |
| powl, = | 0.5 | 1.07 | 8.910-13 | – |
| dibb, free fit | = 0.010.005 = 106 (fix) = 6.61.5 | 0.94 | 5.010-10 | 1.810-6 |
| dibb, = | = 2.60.1 = 106 (fix) | 0.90 | 9.210-13 | 6.210-12 |
| dibb, = | = 1.80.1 = 7105 Norm(4)=2.910-10 (fix) | 0.90 | 9.210-13 | 6.410-12 |
(1) The galactic column density is =
1.2 cm-2 (Dickey & Lockman 1990).
The model abbreviations have the following meaning:
bbdy = black body, powl = power law, dibb = disk black body model.
(2) Units are eV for temperatures, M⊙ for masses,
cm-2 for .
(3) Observed fluxes in units of erg cm-2 s-1
(absorption-corrected).
(4) Normalization is chosen such that distance is equal to
= 588 Mpc (and inclination assumed to be face-on).
3 Discussion
We have presented evidence for a transient X-ray source with an amplitude of a factor of 150 within 6 months. The only optical counterparts down to 23rd magnitude are two galaxies, the brighter of which is at a redshift of z=0.147, and the fainter one probably a factor 3–5 more distant. If the X-ray flare occurred in the brighter galaxy, the unabsorbed, bolometric X-ray luminosity is 2.51044 erg/s (using the disk blackbody model with only galactic foreground absorption and a normalization which fits the z=0.147 distance; see last line in Tab. 2). It should be mentioned that this is a lower limit since most probably we did not catch the peak of the flare, and the X-ray emission may have suffered additional intrinsic absorption. If the flare occurred in the fainter galaxy (B) then the luminosity would probably be even larger, but certainly not lower than 61043 erg/s (if at z0.07).
Though it is impossible to claim with certainty that this evidence proves a tidal disruption origin, we will in the following, by the principle of exclusion, discuss possible alternatives (for a more extensive discussion of alternatives see Komossa & Bade 1999). (1) An active galaxy as the most common origin of large X-ray variability is very unlikely given our optical observations (see above section 2.3). (2) X-ray afterglows of gamma-ray bursts (GRB) may appear as new, bright X-ray sources on the sky. However, all of the observed afterglows have faded rapidly (with time-0.8…-2.1; see Greiner 2000). The ROSAT all-sky survey data suggests a rather flat light curve over about 3 days, inconsistent with a GRB afterglow. (3) This flat, 3-day long light curve also excludes neutron star merger events which are predicted to reach peak luminosities of 1044 erg/s, but should fade by a factor of 3 within 2 days (Li & Paczynski 1998).
Thus, a tidal disruption scenario seems a logical consequence. Moreover, it is even plausible: Spectral fitting of a simple disk blackbody model (Shakura & Sunyaev 1973) gives a consistent picture concerning X-ray temperature, mass of the central object (106 M⊙), luminosity and distance (see last row of Tab. 2).
Acknowledgements.
We are grateful to E. Pavlenko (Crimean Observatory) and W. Wenzel (Sonneberg) for initial optical observations in 1994, as well as to N. Borisov for help in observations conducted at SAO. We appreciate enlightening discussions with M. Salvato (AIP) on the radial profiles of galaxies. JG was partly supported by the German Bundesministerium für Bildung, Wissenschaft, Forschung und Technologie (BMBF/DLR) under contract 50 QQ 96 02 3. The ROSAT project was supported by BMBF/DLR and the Max-Planck-Society.References
- (1) Ayal S., Livio M., Piran T., 2000, ApJ (in press; astro-ph/0002499)
- (2) Bade N., Komossa S., Dahlem M., 1996, A&A 309, L35
- (3) Dickey J.M., Lockman F.J., 1990, ARAA 28, 215
- (4) Frank J., Rees M.J., 1976, MNRAS 176, 633
- (5) Greiner J., 1996, in Supersoft X-ray Sources, ed. J. Greiner, Lect. Notes in Phys. 472, Springer, p. 285
- (6) Greiner J., Bickert K.F., Luthardt R., Viotti R., Altamore A., González-Riestra R., Stencel R.E., 1997, A&A 322, 576
- (7) Greiner J., 2000, http://www.aip.de/People/JGreiner/grb.html
- (8) Grupe D., Thomas H.-C., Leighly K.M., 1999, A&A 350, L31
- (9) Gurzadyan V.G., Ozernoi L.M., 1980, A&A 86, 315
- (10) Gurzadyan V.G., Ozernoi L.M., 1981, A&A 95, 39
- (11) Kato M., Hoshi R., 1978, Prog. Theor. Phys. 60, 1692
- (12) Komossa S., Bade N., 1999, A&A 343, 775
- (13) Komossa S., Greiner J., 1999, A&A 349, L45
- (14) Li L.-X., Paczynski B., 1998, ApJ 507, L59
- (15) Lidskii V.V., Ozernoi L.M., 1979, Pis’ma Astron. Zh. 5, 28 (Soviet Astron. Lett. 5, 16)
- (16) Magorrian J., Tremaine S., 1999, MNRAS 309, 447
- (17) Rees M., 1988, Nature 333, 523
- (18) Reiprich T.H., Greiner J., 2000, in Black Holes in Binaries and Galactic Nuclei, eds. L. Kaper, E.P.J. van den Heuvel, and P.A. Woudt, Springer (in press)
- (19) Renzini A., Greggio L., Di Serego-Alighieri S. et al., 1995, Nat. 378, 39
- (20) Schwope A.D., Hasinger G., Lehmann I., et al. 2000, AN 321, 1
- (21) Shakura N.I., Sunyaev R.A., 1973, A&A 24, 337
- (22) Young P.J., Shields G.A., Wheeler J.C., 1977, ApJ 212, 367
- (23) Zimmermann H.U., Becker W., Belloni T., Döbereiner S., Izzo C., Kahabka P., Schwentker O., 1994, MPE report 257