The Chandra High Energy Transmission Grating Observation of an X-ray Ionization Cone in Markarian 3
Abstract
We present a preliminary analysis of the first high-resolution X-ray spectrum of a Seyfert 2 galaxy, Mkn 3, obtained with the High Energy Transmission Grating Spectrometer onboard the Chandra X-ray Observatory. The high-energy spectrum ( Å) is dominated by reflection of the AGN continuum radiation in a cold optically thick medium and contains bright K fluorescent lines from iron and silicon, as well as weak, blended lines from sulfur and magnesium. The soft X-ray emission ( Å) is spatially extended along the O [III] ionization cone and shows discrete signatures of emission following recombination and photoexcitation produced in a warm photoionized region. The measured iron L line fluxes indicate that emission from collisionally ionized plasma is almost completely negligible, and does not contribute significantly to the total energy budget of the X-ray emission. We find that significant fractions of the H- and He-like resonance lines, as well as the observed iron L lines are produced through re-emission from the warm absorbing medium observed in Seyfert 1 galaxies. Its X-ray spectral properties are qualitatively consistent with those of a typical Seyfert 1 galaxy viewed at a different orientation, and provide further convincing evidence for the existence of an obscured Seyfert 1 nucleus in Mkn 3.
1 Introduction
The soft X-ray spectrum and the excitation mechanisms responsible for X-ray line emission in Seyfert 2 galaxies have been among the most explored, and arguably, one of the least-understood topics in Seyfert 2 research. While it is generally accepted that a large fraction of the hard X-ray emission, and the high equivalent width iron K line are produced through reflection from a cold, optically-thick medium, the origin of the soft X-ray emission observed in many Seyfert 2 galaxies is poorly understood. In the unified picture of AGNs (Miller & Antonucci 1983; Antonucci & Miller 1985; Antonucci 1993), the soft X-ray spectrum is expected to be dominated by emission and scattering from a medium photoionized by the central continuum radiation. Many Seyfert galaxies, however, harbor regions of intense star formation where soft X-rays are produced through mechanical heating such as shocks generated in young supernova explosions and nuclear jets, which make interpretations in terms of both mechanically heated gas, as well as radiatively heated gas physically plausible. When observed with the moderate spectral resolving power available up to now, the mechanisms underlying the resulting spectra are, in most cases, also spectroscopically indistinguishable.
Mkn 3 is one of the handful of Seyfert 2 galaxies that have been shown to possess broad optical emission lines in polarized light (Miller & Goodrich 1990; Tran 1995). Extensive studies at various wavelength bands have also shown convincing evidence for intense Seyfert activity; the existence of highly collimated bipolar radio jets (Kukula et al. 1993), biconical O [III] emission regions (Pogge & De Robertis 1993; Capetti et al. 1995, 1999), hard X-ray emission that shows strong evidence of reflection from the putative molecular torus, and a soft X-ray component that lies significantly above the reflected continuum (Awaki et al. 1991; Iwasawa et al. 1994; Turner et al. 1997; Griffiths et al. 1998; Cappi et al. 1999). The soft X-ray spectrum obtained by ASCA shows numerous discrete features (Iwasawa et al. 1994), which have been interpreted as emission from a photoionized region (Turner et al. 1997), while Griffiths et al. (1998) have demonstrated using non-simultaneous Ginga, ASCA, and ROSAT observations that collisional ionization and photoionization models both provide statistically adequate fits to the X-ray data.
In this Letter we present the first high resolution X-ray spectrum of Mkn 3 obtained with the Chandra HETGS. We show that the X-ray spectral properties of Mkn 3 are qualitatively consistent with those of a typical Seyfert 1 galaxy observed from a different orientation.
2 Observation and Data Reduction
Mkn 3 was observed with the Chandra HETGS (Canizares et al. 2000) with the ACIS-S array (Garmire et al. 2000) at the focal plane. The HETGS consists of two separate grating arrays; the Medium Energy Gratings (MEG) and the High Energy Gratings (HEG), which are optimized in the approximate wavelength ranges Å and Å, respectively. The observation lasted ksec starting at 6:58:08 UT on March 18, 2000. The data were processed through the CXC pipeline software on March 25, 2000. We use sky coordinates of the aspect-corrected Level 2 events to first determine the location of the peak X-ray flux in the zeroth order image, which we define to be the position of the nucleus of Mkn 3.
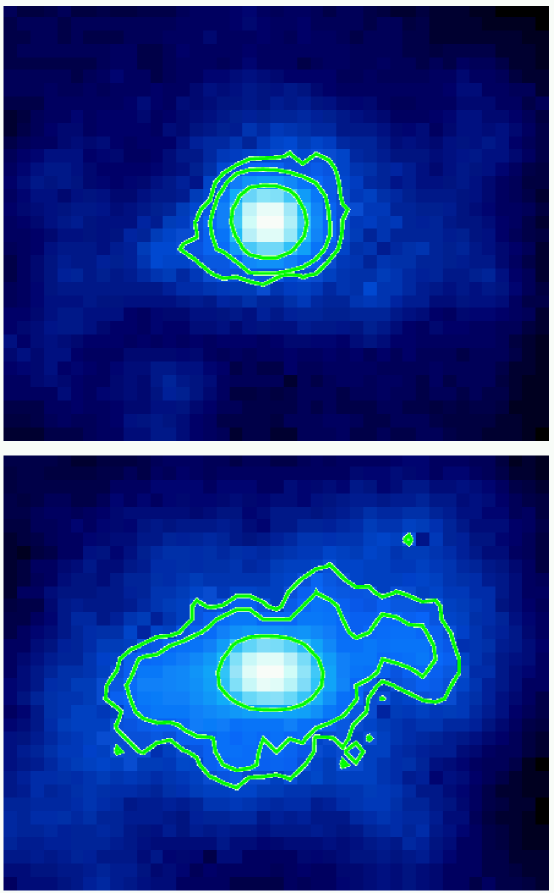
The zeroth order image of Mkn 3 shows a bright point-like core and a previously unresolved (Morse et al. 1995) faint spatially extended region (FWHM ), which lies approximately in the cross dispersion direction of the HETGS (see Figure 1), and is also coincident with the spatial extent of the O [III] image. The source is also slightly extended in the dispersion direction with a one-dimensional gaussian FWHM of compared to a FWHM derived from a sample of point sources (Dewey 2000, private communication). The observed extent is not an artifact, for example, of an incorrect aspect solution or defocusing of the ACIS-S array, since there are three other sources within from Mkn 3 that show no evidence for spatial extent. The observed zeroth order count rate of is also too low to produce substantial photon pileup or events that deposit charge on the detector during the 41 msec CCD frame transfer time. We adopt a 1-D gaussian zeroth order profile with FWHM as the line spread function for the dispersed spectrum, which corresponds approximately to Å for the MEG and Å for the HEG.
We first removed the background events on ACIS-S4 produced during several serial readout frames using the software written by Houck (2000, private communication), which significantly reduces the noise level on the positive orders of the dispersed spectra. The events were then spatially extracted using an 8-pixel filter ( wide) in the cross-dispersion direction. A second filter was applied in the pulse height-dispersion coordinate space to separate the first order events. Ancillary response files were generated based on our extractions using the Chandra Interactive Analysis of Observations (CIAO) assuming a point source. The nominal effective area may be uncertain by % above Å and % below Å. Throughout our analysis, we adopt a redshift of (Tifft & Cocke 1988) and , which correspond to a distance to Mkn 3 of and an angular distance scale of . A Galactic absorption column density of (Stark et al. 1992) is assumed throughout the analysis.
3 Spectral analysis: X-ray Emission Mechanisms
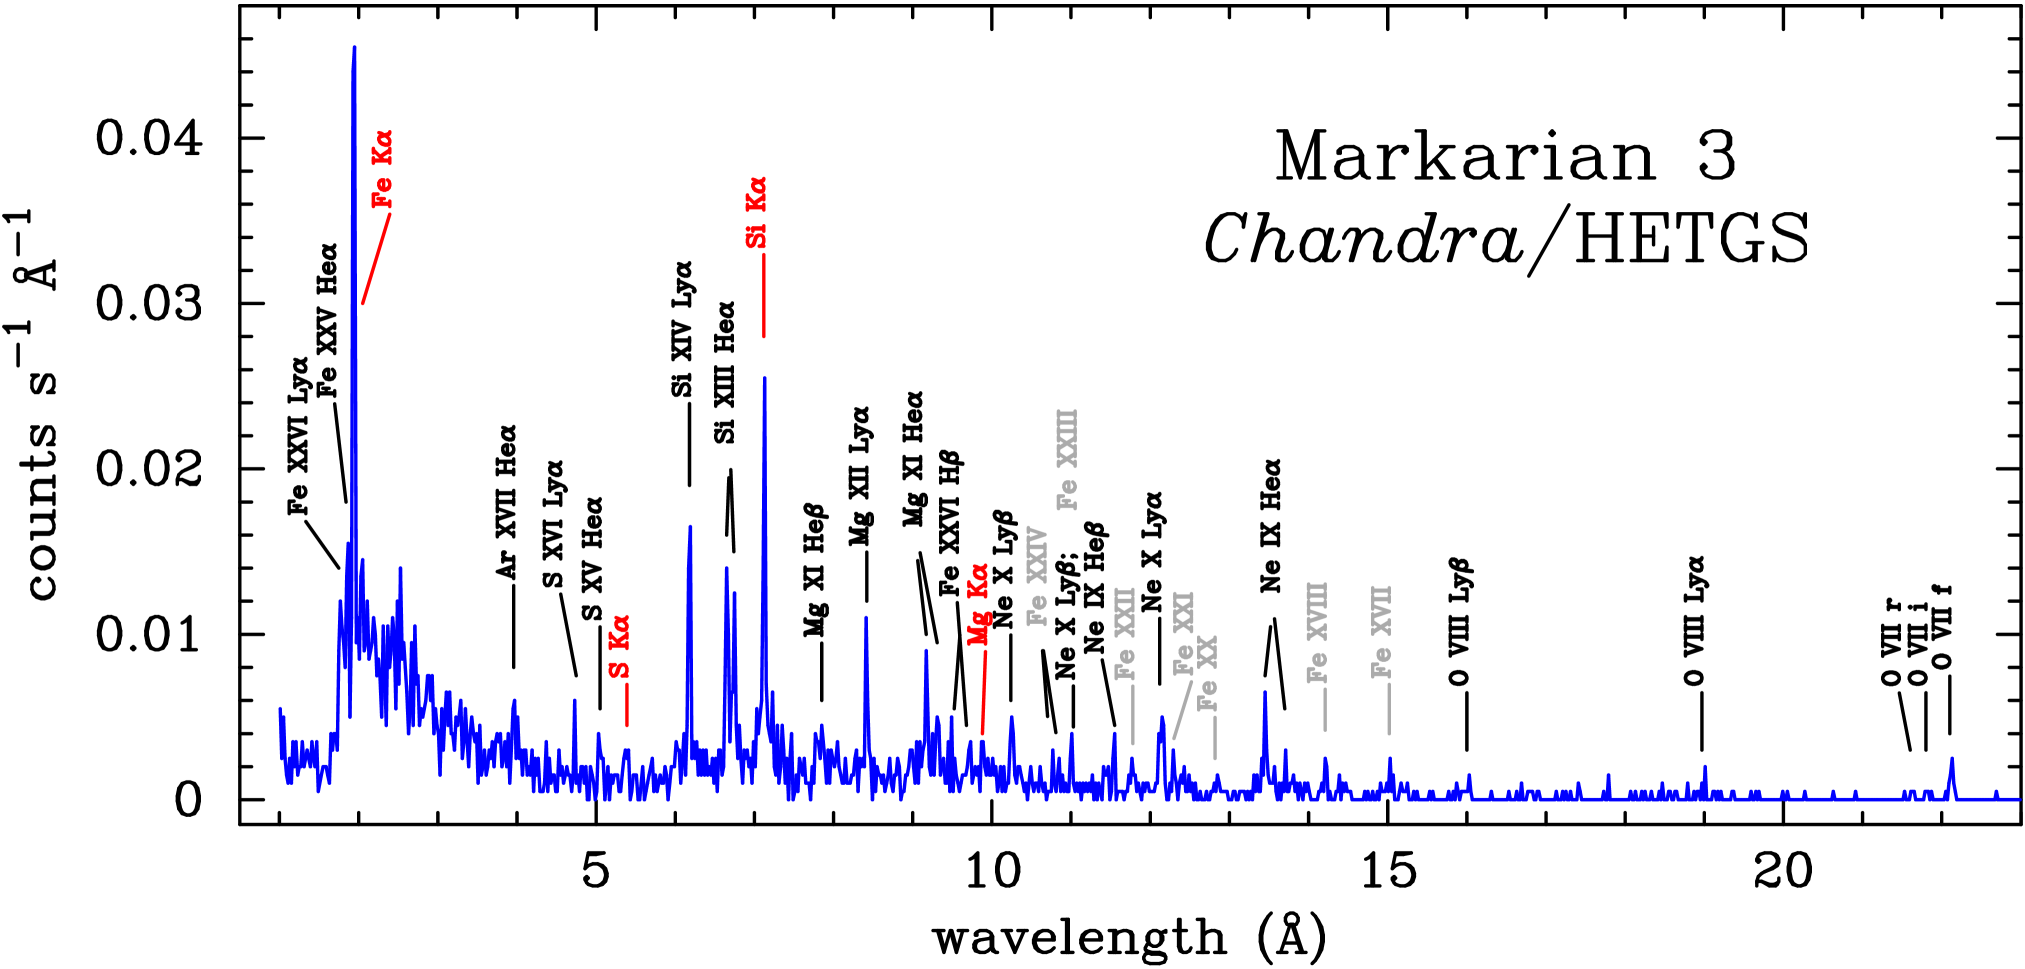
The dispersed spectrum in the 1 – 23 Å region is shown in Figure 2, where we have combined the plus and minus first orders of the MEG and HEG spectra for display purposes. For all quantitative analyses, the MEG and HEG data are treated separately. Quoted values for the measured wavelengths are corrected for cosmological redshift, and the error values for the line parameters correspond to formal confidence ranges unless otherwise stated.
The spectrum exhibits clear detections of H- and He-like lines of O, Ne, Mg, Si, S, and Fe, fluorescent lines of Mg, Si, S, and Fe, and a number of Fe L transistions. In the following subsections, we discuss the various emission mechanisms responsible for the observed discrete spectrum, and infer the global characteristics of the circumnuclear emission line regions.
3.1 Properties of the Reflection Spectrum
As found in previous observations of Mkn 3 at lower spectral resolution, the HETGS spectrum exhibits a hard, reflection dominated continuum with a prominent near-neutral iron K edge at Å ( keV), and a bright Fe K fluorescent line (Figure 2). To determine the properties of this fluorescent line, we adopt a hard X-ray continuum model inferred from BeppoSAX observations (Cappi et al. 1999). The HETGS data do not allow us to constrain the relative contributions of the powerlaw and reflection components simultaneously for the photon index, mainly because of limited statistical quality of the data and the high CCD background above the iron K edge. We, therefore, fix those continuum parameters, allowing only the overall normalization to be free. The measured absorption-corrected luminosity between 1 and 1000 Rydbergs is , and indicates that the intrinsic continuum flux has decreased by factor of since the 1997 BeppoSAX observation, but shows no obvious change in spectral shape. The iron K fluorescent line has a centroid of Å ( keV) with a line intensity of , which is slightly higher than the value obtained by Cappi et al. (1999), but still within the statistical and systematic uncertainties. The width of the line measured from the HEG spectrum is Å, and is broader by approximately a factor of two compared to the measured width of the zero order image in the cross dispersion direction. We also detect a Si K fluorescent line at Å ( keV) with a width of Å on the MEG, and a line intensity of . In the absence of a velocity field, the width of the iron K line corresponds to an approximate range in charge state of Fe+ – Fe9+ (Decaux et al. 1995), while, surprisingly, the silicon line appears to be consistent with that from a single charge state; Si+ based on an approximate calculation by Kaastra & Mewe (1993).
3.2 The He-like Line Ratio Diagnostics
The MEG spectrum shows fully resolved He-like complexes from Ne and O, and blended complexes from S, Si, and Mg (Figure 2). The measured ratio of the resonance plus intercombination line fluxes to that of the forbidden line of Si XIII is . This is inconsistent with the value expected for a pure collisionally ionized plasma [; Mewe, Gronenschild, & van den Oord 1985], and is only marginally consistent with that expected for a recombination dominated plasma in photoionization equilibrium [; Liedahl 1999]. For Mg XI and Ne IX, we are able to obtain only upper limits on the and line fluxes, partly due to blending with iron L lines. The lines, however, are prominent, and can be used along with an estimate for upper limits in the lines to give a lower limit and for Mg XI and Ne IX, respectively. These ratios are again inconsistent with pure collisional ionization equilibrium, pure photoionization equilibrium, or any linear combination of the two! On the other hand, the O VII triplet contains a bright line and weak and lines, and the ratio of is consistent with the pure recombination value (Porquet & Dubau 2000). A summary of the measured H- and He-like line properties is given in Table 1.
3.3 Fe L Emission via Photoexcitation
Assuming that the line emitting plasma is photoionized, the relative strength of the resonance lines in the He-like triplets can be understood in terms of photoexcitation of resonance transitions by the AGN continuum radiation field. This is further supported by the presence of numerous weak emission lines in the 9 – 16 Å region, most of which coincide with lines of Fe XVII – Fe XXII and lines of Fe XXIII and Fe XXIV, all of which are strong ground-state resonance transitions. The number of counts in each of these lines is low ( counts) and prevents us from performing a detailed statistical analysis. However, we can still roughly estimate the line fluxes, which are listed in Table 1.
The iron L lines observed in the spectrum cannot be produced through either electron impact excitation or recombination for the following reasons. For a gas with solar abundances in CIE, iron L-shell emission dominates over K-shell emission from other elements over a wide range of electron temperature ( keV). In this case, the iron line intensities would be higher than observed by at least an order of magnitude. Although this discrepancy could be accounted for by decreasing the iron abundance, it would make the high-equivalent width ( eV relative to the reflection continuum) iron fluorescent line, which is roughly consistent with solar abundances, difficult to reconcile.
In a recombination dominated plasma in PIE, the line intensities are much higher than those of the strong resonance lines (Liedahl et al. 1990). The lines, however, are almost completely absent in the spectrum of Mkn 3, which indicates that recombination cascade is also not the dominant excitation mechanism.
The observed resonance iron L lines, therefore, must be produced mostly through photoexcitation of the surrounding material by the primary continuum radiation. The absence of iron lines in the spectrum also indicates that the contribution of X-ray emission from gas in CIE is almost completely negligible.
4 The Structure of the Circumnuclear X-ray Emission Regions
We can derive constraints on the density of the circumnuclear environment by a variety of arguments. First, the off-nuclear spectrum exhibits a faint soft X-ray continuum component, which is most likely produced through Thomson scattering of the primary radiation by the surrounding medium. By adopting a photon index of , the derived luminosity in this component is (1 – 1000 Ryd), which is approximately 0.5% of the intrinsic luminosity in the same wavelength range. Since , where is the solid angle subtended by the scattering electrons and is the Thomson optical depth through the gas, we can estimate the column density of the electron scattering region to be . Assuming a half-opening angle of the bipolar ionization cone (Capetti et al. 1995), this amounts to . We estimate the size of the emission region to be kpc from the zeroth order image, which yields an average electron density of .
Next, from the measured forbidden line intensity of Si XIII we can estimate the volume ionic emission measure of the Si XIV region () to be . Assuming a stratified conical region, we can write , where and are the electron and Si XIV number densities, is the mean distance from the X-ray source to the Si XIV region, and is the distance through this region. Using , which we derived from the scattered continuum, and the size of the X-ray emission region from the zeroth order image ( kpc), we estimate the lower limit on the column density through the Si XIV region to be , which corresponds to an optical depth of in the Si XIV Ly line. The measured Si XIV column density, along with the average electron density and the size of the X-ray emission region, implies a lower limit for the Si abundance of , which is approximately compatible with the solar photospheric value (Anders & Grevesse 1989).
The derived line optical depth is compatible with the fact that the observed iron resonance line intensities are comparable to the intrinsic monochromatic continuum intensity integrated over a wavelength band corresponding to a velocity range of . The intrinsic continuum flux as determined from extrapolating the direct highly-absorbed component between (Fe XVII; a strong resonance line transition, which is nearly unaffected by recombination emission), for example, is for a velocity dispersion of , which is comparable to the observed line intensity of . This estimate, therefore, indicates that the line is nearly saturated at the core if observed as type 1 Seyfert.
Optical depths of in the bright resonance lines imply that both recombination and photoexcitation emission are important in the circumnuclear regions of Mkn 3. However, this requires a rather finely-tuned distribution of gas, which may or may not be common to all Seyfert 2 galaxies. If the optical depths were substantially higher (), recombination would dominate over emission following photoexcitation since the medium becomes optically thick to photoexcitation at a much lower column density than to photoionization. Alternatively, if , only photoexcitation lines will be observed.
Recent Chandra observation of several Seyfert 1 galaxies, however, have revealed narrow resonance absorption lines, many of which are nearly saturated at the line center (Kaastra et al. 2000; Kaspi et al. 2000). In the context of the unified model, these lines are re-emitted isotropically, and should appear as high-equivalent-width emission lines when the direct view of the central nucleus is obscured from the line of sight (Krolik & Kriss 1995). The observed X-ray spectral properties of Mkn 3 fit well into this picture, and suggest that, at least for Mkn 3, we are looking at a Seyfert 1 galaxy from a different orientation.
References
- Anders & Grevesse (1989) Anders, E., & Grevesse, N. 1989, Geochim. Cosmochim. Acta, 53, 197
- Antonucci & Miller (1985) Antonucci, R. R. J., & Miller, J. S. 1985, ApJ, 297, 621
- Antonucci (1993) Antonucci, R. R. J. 1993, ARA&A, 31, 473
- Awaki et al. (1991) Awaki, H., Koyama, K., Inoue, H., & Halper, J. P. 1991, PASJ, 43, 195
- Brown et al. (2000) Brown, G. V., et al. 2000, in preparation
- Canizares et al. (2000) Canizares, C. R., et al. 2000, ApJ, 539, L41
- Capetti et al. (1995) Capetti, A., Macchetto, F., Axon, D. J., Sparks, W. B., & Boksenberg, A. 1995, ApJ, 448, 600
- Capetti et al. (1999) Capetti, A., Axon, D. J., Macchetto, F., Marconi, A., & Winge, C. 1999, ApJ, 516, 187
- Cappi et al. (1999) Cappi, M., et al. 1999, A&A, 344, 857
- Decaux et al. (1995) Decaux, V., Beiersdorfer, P., Osterheld, A., Chen, M., & Kahn, S. M. 1995, ApJ, 443, 464
- Garmire et al. (2000) Garmire, G. P., et al. 2000, in preparation
- Griffiths et al. (1998) Griffiths, R. G., Warwick, R. S., Georgantopoulos, I., Done, C., & Smith, D. A. 1998, MNRAS, 298, 1159
- Iwasawa et al. (1994) Iwasawa, K., Yaqoob, T., Awaki, H., & Ogasaka, Y. 1994, PASJ, 46, L167
- Kaastra & Mewe (1993) Kaastra, J. S., & Mewe, R. 1993, A&AS, 97, 443
- Kaastra et al. (2000) Kaastra, J. S., Mewe, R., Liedahl, D. A., Komossa, S., & Brinkmann, A. C. A&A, 354, L83
- Kaspi et al. (2000) Kaspi, S., Brandt, W. N., Netzer, H., Sambruna, R., Chartas, G., Garmire, G. P., & Nousek, J. 2000, ApJ, in press
- Krolik & Kriss (1995) Krolik, J. H., & Kriss, G. A. ApJ, 447, 512
- Kukula et al. (1993) Kukula, M. J., Ghosh, T., Pedlar, A., Schilizzi, R. T., Miley, G. K., De Bruyn, A. G., & Saikia, D. J, 1993, MNRAS, 264, 893
- Liedahl et al. (1990) Liedahl, D. A., Kahn, S. M., Osterheld, A. L., & Goldstein, W. H. 1990, ApJ, 350, L37
- Liedahl & Paerels (1996) Liedahl, D. A., & Paerels, F. 1996, ApJ, 468, L33
- Liedahl (1999) Liedahl, D. A. 1999, in X-ray Spectrocopy in Astrophysics, Proceeding of the European Astrophysics Doctoral Network Tenth Summer School, J. van Paradijs & J. A. M. Bleeker (Eds.), p. 189 (Berlin-Springer)
- Mewe, Gronenschild, & van den Oord (1985) Mewe, R., Gronenschild, E. H. B. M., & van den Oord 1985, A&AS, 62, 197
- Miller & Antonucci (1983) Miller, J. S., & Antonucci, R. R. J. 1983, ApJ, 271, L7
- Miller & Goodrich (1990) Miller, J. S., & Goodrich, R. W. 1990, ApJ, 355, 456
- Morse et al. (1995) Morse, J. A., Wilson, A. S., Elvis, M., & Weaver, K. A. 1995, ApJ, 439, 121
- Pogge & De Robertis (1993) Pogge, R. W., & De Robertis, M. M. 1993, ApJ, 404, 563
- Porquet & Dubau (2000) Porquet, D., & Dubau, J. 2000, A&AS, 143, 495
- Stark et al. (1992) Stark, A. A., Gammie, C. F., Wilson, R. W., Bally, J., Linke, R., Heiles, C., & Hurwitz, M. 1992, ApJS, 79, 77
- Tifft & Cocke (1988) Tifft, W. G., & Cocke, W. J. 1988, ApJS, 67, 1
- Tran (1995) Tran, H. D. 1995, ApJ, 440, 565
- Turner et al. (1997) Turner, T. J., George, I. M., Nandra, K., & Mushotzky, R. F. 1997, ApJ, 488, 164
| Wavelength (Å)aacorrected for cosmological redshift (). | (mÅ) | Intensitybbin multiples of , corrected for Galactic absorption. | Line ID/BlendccExperimentally determined iron L line wavelengths (Brown et al. 2000). |
|---|---|---|---|
| 22.11 | 30 | 37 | O VII |
| 21.79 | 30 | 13 | O VII |
| 21.61 | 30 | 11 | O VII |
| 18.96 | 40 | 11 | O VIII Ly |
| 15.90 | 40 | 6.3 | O VIII Ly |
| 13.70 | 25 | 2.4 | Ne IX |
| 13.55 | 25 | 2.5 | Ne IX |
| 13.45 | 25 | 6.7 | Ne IX |
| 12.13 | 35 | 7.8 | Ne X Ly |
| 10.24 | 23 | 2.0 | Ne X Ly |
| 9.312 | 30 | 0.8 | Mg XI |
| 9.175 | 25 | 2.1 | Mg XI |
| 8.418 | 13 | 1.9 | Mg XII Ly |
| 6.734 | 18 | 2.8 | Si XIII |
| 6.651 | 18 | 3.5 | Si XIII |
| 6.176 | 14 | 3.5 | Si XIV Ly |
| 5.052 | 26 | 3.7 | S XV He |
| 4.724 | 10 | 1.8 | S XVI Ly |
| 1.855 | 15 | 21 | Fe XXV He |
| 1.768 | 31 | 42 | Fe XXVI Ly |
| 15.04 | 21 | 4.2 | Fe XVII |
| 14.21 | 22 | 3.9 | Fe XVIII |
| 12.85 | 61 | 3.8 | Fe XX |
| Fe XX | |||
| Fe XX | |||
| 12.29 | 28 | 2.7 | Fe XXI |
| 11.77 | 39 | 3.5 | Fe XXII |
| 10.99 | 17 | 1.8 | Fe XXIII |
| 10.64 | 9 | 0.69 | Fe XXIV |
| 10.60 | 24 | 1.4 | Fe XXIV |