The BeppoSAX observation of Mrk 766
Abstract
The Narrow Line Seyfert 1 galaxy Mrk 766 has been observed by BeppoSAX on May 1997. The source was fairly variable, both in flux and spectrum, during the observation. The variability is the largest around 2 keV, possibly due to variations in the warm absorber properties. An oxygen line is clearly detected, at least in the first part of the observation. An edge around 7.5 keV, coupled with the lack of any detectable iron line, suggests either reprocessing of the primary X–rays by a mildly ionized disc or absorption by a further, thicker and more ionized material.
Key Words.:
Galaxies: individual: Mrk 766 – Galaxies: Seyfert – X-rays: general1 Introduction
Mrk 766 is a rather bright (typical flux of about one milliCrab) Narrow Line Seyfert 1 galaxy at redshift 0.012, showing complex and puzzling X–ray variability (Molendi, Maccacaro & Schaeidt 1993; Molendi & Maccacaro 1994; Page et al. 1999) on time–scales as short as 1000 sec (Leighly et al. 1996). The 1992 June ROSAT PSPC observations, discussed by Molendi & Maccacaro (1994), indicated large amplitude variations in the softest part of the spectrum (0.1–0.9 keV), while the hardest part (0.9-2 keV) was consistent with being constant. The authors suggested accretion disc emission as the origin of the variable component. Recently, Page et al. (1999) analysed spectral variability in ROSAT PSPC data collected from 1991 to 1994, reaching different conclusions: a highly variable (on time–scales as short as 5000 s) hard power law component, and a constant soft excess. The ASCA–ROSAT observation reported by Leighly et al. (1996) shows a complex and variable spectrum, with the primary power law photon index changing from 1.6 to 2 within the observation, and variable warm absorber too. The soft excess variability was anti–correlated with that of the hard component. A narrow iron K line was detected only when the source was in a high flux level.
We observed Mrk 766 with BeppoSAX to take advantage of the wide energy band of the satellite and try to better understand the origin of the spectral complexity in this source.
The paper is organized as follows: Sec. 2 describes the observation and data reduction; Sec. 3 presents the temporal, and Sec.4 the spectral, analysis; the results are compared with the ASCA–ROSAT ones in Sec. 5, discussed in Sec. 6 and summarized in Sec. 7.
2 Observation and data reduction
BeppoSAX (Boella et al. 1997) observed Mrk 766 on 17-18 May, 1997 as part of a Core Program devoted to a spectral survey of bright Seyfert 1 galaxies. The exposure time was 79 ksec for the MECS, the HPGSPC and the PDS and 42 ksec for the LECS. We discuss here data from the LECS, MECS and PDS only, because the source is too faint for the HPGSPC to be profitably used.
Spectra and light curves were extracted from the imaging instruments within circles of 8’ (LECS) and 4’ (MECS) radii centred on the source. Background spectra taken in the same regions from blank sky observations have been used for subtraction. Regarding the PDS, background subtracted spectra automatically generated at the SAX Scientific Data Centre (SDC) have been used. Fixed Rise Time thresholds have been adopted.
Time–averaged count rates are: 0.27650.0026 (LECS, 0.1-10 keV); 0.26240.019 (MECS, 1.5-10 keV, 2 units111The observation was performed after the failure of one of the three MECS units.); 0.28630.0038 (PDS, 15-200 keV). The 2–10 keV mean flux (obtained with model 5 in Tables 1 and 2) is 2.0510-11 erg cm-2 s-1.
In the field of view of the PDS there are two possible confusing sources, both of them BL Lac objects. At an angular distance of about 20 arcminutes there is ON 325. The source is clearly visible in the MECS, with a count rate of about 1/20 that of Mrk 766. The faintness of the source and its off–axis position do not permit a detailed spectral analysis, but the MECS spectrum appears to be rather steep, and therefore its contribution to the PDS is likely to be very small. More serious is the case of the other source, 2A 1219+305 (PG 1218+304), a member of the Piccinotti sample (Piccinotti et al. 1982) with a mean 2–10 keV flux of 3 erg cm-2 s-1 and a 2.5 detection with BATSE (Malizia et al. 1999). The source is about 44’ arcminutes away from Mrk 766, i.e. outside the MECS field of view, and it is therefore not possible to estimate its contribution to the PDS, which may be substantial. For this reason we preferred to exclude the PDS from the spectral fitting, using the data a posteriori only as an upper limit to the hard X–ray emission of Mrk 766.
3 Data analysis and results. Temporal analysis
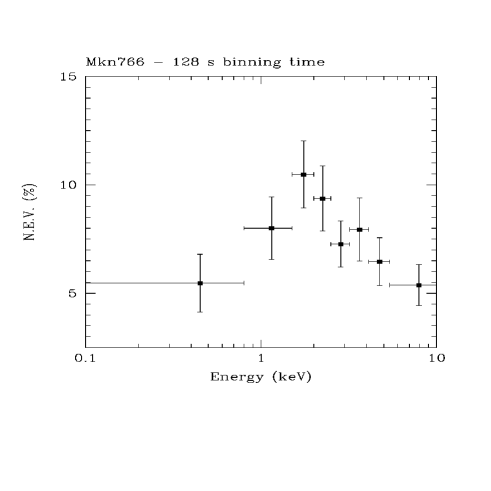
The LECS (0.1–10 keV) and MECS (1.5-10 keV) light curves are shown in Fig. 1. The source varies as much as a factor 2 on time–scales of a few thousands of seconds. To search for spectral variability, we have also plotted the (1.5-4)/(0.1-1.5) LECS hardness ratio, and the (4-10)/(1.5-4) MECS hardness ratio. Clearly, there is significant spectral variability, especially in the second part of the observation. To investigate the energy dependence of this variability, we calculated the Normalized Excess Variance (NEV; see Nandra et al. 1997) (Fig. 2) for different energy intervals, using a 128 s binning. The source is variable at all energies, but the amplitude is the highest around 2 keV.

The PDS light curve and the PDS/MECS ratio are also shown in Fig. 1. The light curve is very variable, the background subtracted PDS count rates sometimes going down to values consistent with zero. The light curve is different from those of the LECS and MECS, suggesting either a strong spectral variability or a significant contamination by the nearby BL Lac, 2A 1219+305.
4 Data analysis and results. Spectral analysis
The spectral analysis was performed on the LECS and MECS instruments only, because of the possible confusion problems in the PDS outlined above. The PDS data have been used only to check a posteriori that a LECS+MECS best fit spectrum, when extrapolated to higher energies, would not exceed the observed data.
All fits described below have been performed with the xspec software package. Quoted errors refer to 90% confident level for two interesting parameters (i.e. =4.61).
Because of the significant spectral variability, it is not wise to use the spectrum averaged over the whole observation. On the other hand, it is important to collect as many photons as possible to search for spectral details. As a trade–off we have divided the observation in two parts, and extracted spectra from: a) the beginning of the observation till 8 sec (see Fig. 1), because within this interval variations in the hardness ratio, especially in the MECS, are not dramatic; b) from this time till the end of the observation.
As it will be seen in the following (Tables 1 and 2), no models will give a fully acceptable fit, the null hypothesis probability being 0.12 at most. This is likely due to the spectral variability discussed in the previous section, as our time selection makes this problem alleviated but not completely cured.

4.1 First half of the observation
Let us start discussing the first half of the observation. A simple power law absorbed by the Galactic column (i.e. 1.771020 cm-2; Elvis, Wilkes & Lockman 1989) is a very poor fit to the data (see Fig. 3 and Table 1, model 1), with an unacceptable reduced of 1.70. From the figure, it is clear that most of the contribution to the comes from the softest part of the spectrum, i.e. below 1 keV, while no evidence for typical Seyfert 1 components like the iron line or the reflection continuum is present. A deficit of counts above 7 keV is also apparent. Leaving the column density free to vary (model 2), the quality of the fit significantly improves, but the fit is still unacceptable (=1.50).
4.1.1 The warm absorber
Inspection of the residuals suggests the presence of warm absorption features. We therefore added the absori model (model 3 in Table 1), obtaining a significant improvement in the quality of the fit. The warm absorber material has been assumed to be ionized by the observed power law. The best fit value of the ionization parameter, , is about 240 erg cm s-1; with this value, the most prominent edge is the O viii one. The column density of the warm absorber is 81021 cm-2.
4.1.2 The Oxygen line
A further inspection of the residuals reveals an excess around 0.6 keV, which can be well fitted (model 4) by a narrow gaussian line at 0.59(0.05) keV (source rest frame), with an equivalent width of 68() eV. The statistical significance of this line is 97.3% (F-test). The line energy is consistent with He–like oxygen (0.57 keV); a fit with the line fixed at this energy, plus a line at 0.65 keV (H–like oxygen) does not provide a statistical improvement; the best fit EWs are 60 and 30 eV, respectively. The value of is now lower. The best fit ionization structures of the absorber and the emitter are somewhat different (the most relevant ion being O vii in the emitter, and O viii in the absorber), but still consistent each other within the (fairly large) errors. Finally, a relativistic line (diskline model in xspec) fits the line equally well as a narrow gaussian line. Fixing the inner radius at 6 , i.e. the last stable orbit for a Schwarzschild black hole, we obtain an outer radius of thousands of and an inclination angle consistent with zero (i.e. face–on disc).
4.1.3 The iron edge. Ionized reflection of ionized absorption?
While the above fit is satisfactory from a statistical point of view, a deficit of counts above 7 keV is still apparent. Adding an absorption edge to model 4 the fit actually improves, the best fitting parameters being an edge energy of 7.55 keV, and =0.26. This edge may be related to reflection from circumnuclear matter, and therefore we added a Compton reflection component. We allowed the matter to be ionized (pexriv model in xspec), both because the edge is at energies larger than 7.1 keV, the value of neutral iron, and because the lack of any observed iron K line (see next paragraph) is only possible, in presence of a Compton reflection component, if the iron is mildly ionized and therefore resonant destruction possible (e.g. Matt, Fabian & Ross 1993, 1996). The results are reported in Table 1 as model 5. Interestingly, the value of the ionization parameter of the reflecting matter, even if poorly determined, is consistent with what is expected in order to have the iron line significantly destroyed. It is worth noticing that such an ionized disc could also account for the observed oxygen emission line, even if the equivalent width is larger than expected by a factor of a few, pointing to a possible oxygen overabundance. Moreover, the best fit parameters of the warm absorber material are now such that the most important oxygen ion is the Helium–like. It is therefore possible that both the accretion disc and the warm absorber contribute to the line flux.
Alternatively, the iron edge may be due to absorbing material. We therefore added a second ionized absorber (model 6), instead of the reflector. The fit is as good as the one with the reflector. This second absorber results to be more thick and ionized than the other one (but the parameters are loosely constrained). It may be interesting to note that a similar double–absorber solution has been found in the (broad line) Seyfert 1 NGC 3516 (Costantini et al. 2000).
4.1.4 The iron line
Leighly et al. (1996) detected a narrow 6.4 keV iron line with an equivalent width of about 100 eV in the ASCA spectrum of Mrk 766, but only when the source was in a high state. We searched for an iron line in the BeppoSAX data, but could find only upper limits. The upper limits to a narrow iron line are 110, 43 and 36 eV if the line energy is fixed to 6.4 keV (neutral iron), 6.7 keV (H–like iron) or 6.97 keV (H–like iron), respectively. Therefore, our result is marginally consistent with the line found by Leighly et al. (1996). Of course, the upper limits would increase if the line is broad. As explained in the previous section, the lack of an observable line is still consistent with the reflection scenario, because the best fit ionization state is such to have the line destroyed by resonant re–absorption.
4.1.5 PDS data
As shown in Fig. 4, the extrapolation of model 5 to the PDS data is rather good, which may be an indication (but unfortunately not a proof) that the contribution to the PDS count rate from 2A 1219+305 is low. Also the extrapolation of model 6 does not exceed the observed PDS data.

4.1.6 The soft excess
We then searched for a soft excess (modeled as a black body), a component which has been already observed in this source (see Sec. 1), and whose presence may be expected by analogy with other Narrow Line Seyfert 1 Galaxies (e.g. Boller, Brandt & Fink 1996). The fit with the soft excess instead of the warm absorber (other components as in model 5) gives a worse (1.23/119; best fit temperature of about 30 eV), while the addition of the black body to model 5 does not provide a significant improvement (=1.13/117; best fit temperature of 200 eV). We therefore conclude that such a component is not required by the data, and confirm that the warm absorber is real, and not an artifact of not having included the soft excess. However, it should be noted that while the fits presented in Table 1 have been obtained with a column density of the cold absorber in excess of the Galactic value, the column density turns out to be close to the Galactic one when the black body component is included. Therefore, the presence of the soft excess remains rather ambiguous. It is worth noting that the BeppoSAX power law index is significantly steeper than the one observed by ASCA, while the average 2-10 keV flux is about the same in the two observations, making any soft excess in the BeppoSAX data difficult to observe.
| # | NH | R/N | NH,WA | E.W. | /d.o.f. | ||||
|---|---|---|---|---|---|---|---|---|---|
| (1020 cm-2) | (erg cm s-1) | (1020 cm-2) | (erg cm s-1) | (keV) | (eV) | ||||
| 1 | 1.77 | 2.01 | 215/126 | ||||||
| 1.70 | |||||||||
| 2 | 2.29 | 2.07 | 188/125 | ||||||
| 1.50 | |||||||||
| 3 | 3.06 | 2.17 | 80 | 240 | 155/123 | ||||
| 1.26 | |||||||||
| 4 | 2.77 | 2.13 | 43 | 120 | 0.59 | 68 | 146/121 | ||
| 1.20 | |||||||||
| 5 | 4.29 | 2.25 | 0.84 | 94 | 38 | 78 | 0.61 | 57 | 137/119 |
| 1.15 | |||||||||
| 6 | 3.19 | 2.21 | 380 | 1040 | 28 | 23 | 0.63 | 51 | 139/119 |
| 1.17 |
| a Column density (in units of 1020 cm-2) of the second absorber in model 6 |
4.2 Second half of the observation
We then analysed the spectra extracted from the second half of the observation. For the sake of conciseness, only models 5 and 6 are reported in Table 2. The oxygen line is now not required by the data, and we fixed its energy to 0.6 keV (see Table 1; this energy would correspond to a blend of He– and H–like atoms) to get an upper limit. The fit with two absorbers is now preferable to that with one absorber and one reflector, from a statistical point of view. Again, a blackbody component instead of the warm absorber gives a much worse fit. This time, however, adding the blackbody component a significantly better fit is obtained, but at the expense of a very steep power law component (=3.4) and an unplausibly large reflection component (=21). As there is significant spectral variations during the second half of the observation, it is possible that this improvement occurs because a further component may help fitting the fictitious spectral complexity arising from time–averaging over different spectral states. Not surprisingly, the is significantly higher than in the first half of the observation.
Let us now compare the results obtained in the two halves of the observation. Two main differences are evident: first, in the second half of the observation the oxygen line is not required by the data, and only an upper limit on its EW can be obtained. This limit, however, is consistent with the value for the first half. Second, the WA (both of them in model 6) appears to be thicker and more ionized in the second half than in the first half (even if, within the errors, the values of the ionization parameters are consistent with each other). The two best fit absorption models are shown in Fig. 5, where it can be seen that the differences between the two models are large in the 0.9-2 keV interval. Intriguingly, these are the energies where the NEV has a maximum (Fig. 2). Unfortunately, the limited statistics prevent from a more detailed analysis.

| # | NH | R/N | NH,WA | E.W. | /d.o.f. | ||||
|---|---|---|---|---|---|---|---|---|---|
| (1020 cm-2) | (erg cm s-1) | (1020 cm-2) | (erg cm s-1) | (keV) | (eV) | ||||
| 5 | 4.74 | 2.26 | 1.46 | 72 | 129 | 203 | 0.6 | 0 | 159/120 |
| 1.33 | |||||||||
| 6 | 3.81 | 2.20 | 1140 | 1570 | 100 | 90 | 0.6 | 0 | 152/120 |
| 1.26 |
| a Column density (in units of 1020 cm-2) of the second absorber in model 6 |
5 Comparison with previous observations
The behaviour of Mrk 766 during the BeppoSAX observation is rather different than during the ASCA–ROSAT observation, performed on December 1993 and discussed by Leighly et al. (1997). The source was at an average flux level very similar in the two observations. While in both cases there is significant flux and spectral variability on time scales of thousands of seconds, the origin of the spectral variability appears to be different. In the ASCA–ROSAT observation, it is driven by significant changes in the spectral index of the power law, while in our observation it seems to be mostly related to changes in the warm absorber properties. Indeed, in our observation the power law index is consistent with being constant, but at a value significantly steeper (i.e. 2.2) than those found by Leighly et al. (1.6–2). Moreover, in the ASCA–ROSAT observations a soft excess is strongly required by the data, while in our observation this component may be absent. (It is worth noting than even in the ASCA–ROSAT observations the soft excess is marginally visible when the power law is the steepest, because the soft component is almost constant during the observation; it may therefore be not surprising that in our observation the soft component is hardly detectable). A further difference is the presence, in the ASCA data and during the high flux phase, of an iron line with 100 eV equivalent width, while in the BeppoSAX data such a line is not visible (but the upper limit on the equivalent width is marginally consistent with the abovementioned value).
To summarize, in both observations the source underwent large and complex variability, but the pattern and origin of the variations seem to be very different in the two cases.
6 Discussion
While the Narrow Line Seyfert 1 Galaxy Mrk 766 shares with other members of its class the large amplitude and short time–scale variability, it does not share (at least during the observation described here) another characteristic which is common in Narrow Line Seyfert 1 galaxies, i.e. a prominent soft X–ray emission. The power law component is, actually, somewhat steeper than the typical value for classical Seyfert 1 galaxies, but the soft excess is modest, if present at all. The warm absorber is also typical of classical, ‘broad lines’ Seyfert 1s, being dominated by oxygen and neon edges. No 1 keV feature (besides those related to the warm absorber and cured by the inclusion of this component) is present, differently from what observed in other sources of this class (e.g. Leighly et al. 1997; Fiore et al. 1998; Leighly 1999; Vaughan et al. 1999a). This is not surprising, as these features have been observed so far only in very steep spectrum sources, a fact naturally explained if these features are due to a blend of resonant absorption lines, mainly from iron L–shell (Nicastro, Fiore & Matt 1999). The column density and ionized parameter of the warm absorber appear to have been changed between the two halves of the observations, in agreement with the fact that the variability is the largest around 1 keV. A so dramatic change of the column density, however, is unplausible, and it may be an artifact of having used pure photoionization equilibrium, single–zone models, while in reality it is possible that: the absorber is out of equilibrium most of the time (not surprisingly, given the flux variability; see Nicastro et al. 1999 for non equilibrium models); there is some contribution from collisional ionization; the absorbing medium is geometrically or physically complex.
Similar to other Narrow Line Seyfert 1s (TON S 180: Comastri et al. 1998, Turner, George & Nandra 1998; Ark 564: Vaughan et al. 1999b) is, instead, the possible presence of reprocessing from ionized matter. Ionized accretion discs are expected when is high (Ross & Fabian 1992; Matt, Fabian & Ross 1993), and accretion rates close to the Eddington one have been indeed invoked to explain the NLS1 phenomenon (e.g. Pounds, Done & Osborne 1995; ). The (mild) ionization of the reprecessor may also account for the lack of any observed iron line (Matt et al. 1993; 1996), as the line photons may be resonantly trapped and then destroyed by the Auger effect.
Reflection from a mildly ionized disc may also explain at least part of the O vii emission line observed in the first half of the observation (in the second half only an upper limit is obtained, which however is consistent, within the error, with the value measured in the first half). In this case, the line is expected to be broadened by relativistic effects; the quality of our data is not good enough to distinguish between a narrow and a relativistic line, provided that the inclination angle of the disc is low. An oxygen line possibly from an ionized disc was observed by Piro et al. (1997) in the ASCA data of E1615+061, while the same line observed by BeppoSAX in the spectrum of NGC 5548 (Nicastro et al. 2000) clearly originates from outflowing material, as demonstrated by the Chandra/LETG observation (Kaastra et al. 2000). In Mrk766, it is possible that both the accretion disc and the warm absorber contribute to the observed emission, as the best fit ionization structure for both materials includes a significant fraction of O vii. High energy resolution observations are needed to definitely settle this issue.
7 Summary
The main results of the BeppoSAX observation of Mrk 766 may be summarized as follows:
The spectrum of Mrk 766 is well fitted by an absorbed power law (with cold absorption in excess of the Galactic one), a warm absorber, an oxygen line and a further component (mainly accounting for the iron edge) which may be either a second and more ionized warm absorber or a mildly ionized disc. A soft excess is not required by the data, but its inclusion makes the cold absorber closer to the Galactic value.
The spectral variability during the observation may be entirely due to variations in the properties of the warm absorber(s), even if the behaviour of the absorber is complex and no obvious correlation with the flux is apparent.
The power law is significantly steeper than during the ASCA–ROSAT observation (Leighly et al. 1996). The spectral variability pattern is also very different, indicating that we have observed the source in a different state.
There is clear evidence for an O vii emission line, which may originate either in the accretion disc or in the warm absorber, or, most plausibly given the large equivalent width, in both.
Acknowledgements.
We thank the referee, Thomas Boller, for useful comments. We acknowledge the BeppoSAX SDC team for providing pre–processed event files and for their constant support in data reduction. GM, GCP, FF and FN acknowledge financial support from ASI and MURST (grant cofin98–02–32). This research has made use of the NASA/IPAC Extragalactic Database (NED) which is operated by the Jet Propulsion Laboratory, California Institute of Technology, under contract with the National Aeronautics and Space Administration.References
- (1) Boella G., Butler R. C., Perola G. C., et al., A&ASS, 122, 299
- (2) Boller Th., Brandt W.N., Fink H., 1996, A&A, 305, 53
- (3) Comastri A., Fiore F., Guainazzi M., et al., 1998, A&A, 333, 31
- (4) Costantini E., Nicastro F., Fruscione A., et al., 2000, ApJ, in press
- (5) Elvis M., Wilkes B.J., Lockman F.J., 1989, AJ, 97, 777
- (6) Fiore F., Matt G., Cappi M., et al., 1998, MNRAS, 298, 103
- (7) Kaastra J.S., Mewe R., Liedhal D.A., Komossa S., Brinkman A.C., 2000, A&A, 354, L83
- (8) Leighly K.M., Mushotzky R.F., Yaqoob T., Kunieda H., Edelson R., 1996, ApJ, 469, 147
- (9) Leighly K., Mushotzky R.F., Nandra K., Forster K., 1997, ApJ, 489, L25
- (10) Leighly K., 1999, ApJS, 125, 317
- (11) Malizia A., Bassani L., Zhang S.N., et al., 1999, ApJ, 519, 637
- (12) Matt G., Fabian A.C., Ross R.R., 1993, MNRAS, 262, 179
- (13) Matt G., Fabian A.C., Ross R.R., 1996, MNRAS, 278, 1111
- (14) Molendi S., Maccacaro T., Schaeidt S., 1993, A&A, 271, 18
- (15) Molendi S., Maccacaro T., 1994, A&A, 291, 420
- (16) Nandra K., George I.M., Mushotzky R.F., Turner T.J., Yaqoob T., 1997, ApJ, 476, 70
- (17) Nicastro F., Fiore F., Matt G., 1999, ApJ, 517, 108
- (18) Nicastro F., Fiore F, Perola G.C., Elvis M., 1999, ApJ, 512, 184
- (19) Nicastro F., Piro L., De Rosa A., et al., 2000, ApJ, 536, 718
- (20) Page M.J., Carrera F.J., Mittaz J.P.D., Mason K.O., 1999, MNRAS, 305, 775
- (21) Piccinotti G., Mushotzky, R. F., Boldt, E. A., et al., 1982, ApJ, 253, 485
- (22) Piro L., Balucinska-Church M., Fink H., et al., 1997, A&A, 319, 74
- (23) Pounds K.A., Done C., Osborne J.P., 1995, MNRAS, 277, L5
- (24) Ross R.R., Fabian A.C., 1993, MNRAS, 261, 74
- (25) Turner T.J., George I.M., Nandra K., ApJ, 508, 648
- (26) Vaughan S., Reeves J., Warwick R., Edelson R., 1999a, MNRAS, 309, 113
- (27) Vaughan S., Pounds K.A., Reeves J., Warwick R., Edelson R., 1999b, MNRAS, 308, L34