Light Curves of GRB Optical Flashes
Abstract
The standard model of GRB afterglows assumes that relativistically expanding material is decelerating due to interaction with the surrounding medium. The afterglows are well described by the synchrotron radiation from a forward shock, while the strong optical flash associated with GRB 990123 can be attributed to the emission from a reverse shock. We give a detailed study on the reverse shock emission. The full light curves are calculated for a long and a short GRB cases. We discuss the lack of the prompt optical detections by ROTSE for GRB 981121 and GRB 981223.
1 Introduction
The gamma-ray burst (GRB) afterglow is believed to involve a relativistically expanding fireball. The surrounding matter, which we will refer to as the ISM, influences the fireball shell after it has been collected enough and the considerable energy has been transferred from the shell to the ISM. The energy transfer is due to two shocks: a forward shock propagating into the ISM and a reverse shock propagating into the shell.
The afterglow observations are fairly well described by the synchrotron emission from the ISM electrons accelerated by the forward shock, it is considered as a confirmation of the relativistic fireball. However, the current afterglow observations detect the radiation from several hours after the GRBs. At this stage, the Lorentz factor of the forward shock is not ultra-relativistic, less than . Furthermore, the dynamics depends only on two parameters: the explosion energy and the ISM density. The afterglow observations provide neither verification of the extreme relativistic motion nor the properties of the fireball which can constrain models of the GRB source.
The counterpart of the afterglow, the emission from a reverse shock was also predicted (Mészaros & Rees 1997; Sari & Piran 1999a). When a reverse shock crosses a shell, the forward shocked ISM and the reverse shocked shell carry comparable amount of energy. However, the typical temperature of the shocked shell is lower since the mass density of the shell is higher. Consequently, the typical frequency from the shocked shell is lower. A prompt optical emission from GRB 990123 (Akerlof et al. 1999) can be regarded as this emission (Sari & Piran 1999b; Kobayashi & Sari 2000).
The emission from the reverse shock is sensitive to the initial properties of the fireball. The observations can provide some important clues on the nature of the GRB source. Previous studies focused on the emission at the peak time. In this paper we calculate the full light curves for several frequency regimes. We in section 2 discuss the hydrodynamics of the relativistic fireballs on which the light curves highly depend. In section 3 we calculate the light curves for a long burst and a short burst case. We compare our estimates with the ROTSE observations in section 4. We estimate the initial parameters of the fireball of GRB 990123, and then we make some comments on the lack of the prompt detections by ROTSE for GRB 981121 and GRB 981223. In section 5 we give conclusions.
2 Hydrodynamics of a Relativistic Shell
Consider a relativistic shell with an energy , a Lorentz factor and a width in laboratory frame expanding into a surrounding medium (ISM) with a particle number density . When the shell sweeps a large volume of the ISM, it begins to be decelerated. The interaction between the shell and the ISM is described by two shocks: a forward shock propagating into the ISM and a reverse shock propagating into the shell. There are four region separated by the two shocks: the ISM(denoted by the subscript 1), the shocked ISM(2), the shocked shell material (3) and the unshocked shell material (4). Using the jump conditions for the shocks and the equality of pressure and velocity along the contact discontinuity, we can estimate the Lorentz factor , the pressure and the number density in the shocked regions as functions of three variables and (Blandford and McKee 1976).
There are two limits to get a simple analytic solution (Sari and Piran 1995). If the shell density is high , the reverse shock is Newtonian which means that the Lorentz factor of the shocked shell material is almost unity in frame of the unshocked shell material. It is too weak to slow down the shell effectively . On the other hand, if the density is low , the reverse shock is relativistic and it considerably decelerates the shell material . Once is determined, the density and the pressure in the shocked shell region are given by and .
In both cases, the time it takes for the reverse shock to cross a distance in the shell material can be given in a similar form up to a constant factor (Kobayashi, Piran & Sari 1999),
| (1) |
where is the radius of the shell. Since the motion of the shell is highly relativistic, we can regard as time in laboratory frame.
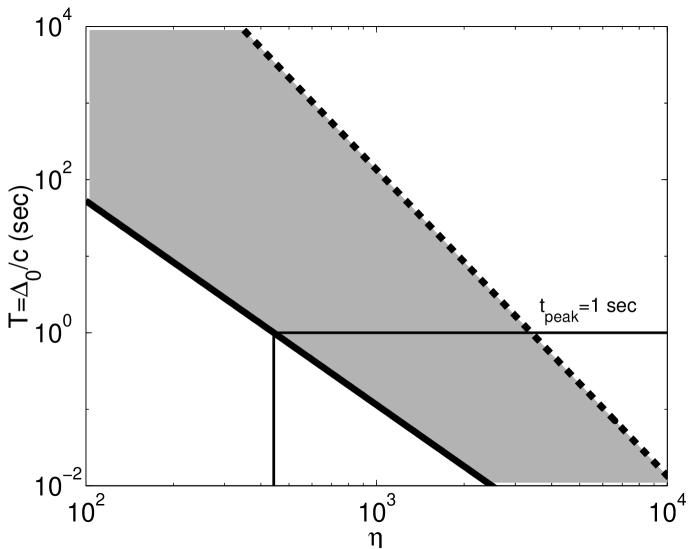
When a shell is ejected from a source, it has a high density , so the reverse shock is initially Newtonian. However, as the shell expands, the shell density decreases. There is a possibility that the shock becomes relativistic during it is crossing the shell. Sari and Piran (1995) showed that, using the Sedov length , if the shell is thick: , the reverse shock becomes relativistic at before the crossing at . If the shell is thin: , it is dense enough to keep the reverse shock Newtonian. The shock becomes mildly relativistic only when it just crosses the shell at .
The typical burst energy is about ergs. The ISM density has a typical values of protons/cm3. The thick solid line in figure 1 separates the thick shell case (upper right) and the thin shell case (lower left). According to the internal shocks model the duration of a GRB is given by the shell width , the thick shell cases correspond to relatively long bursts.
2.1 the Thick Shell Case
In a thick shell case the reverse shock becomes relativistic at and it begins to decelerate the shell material. Since the shell density decreases with radius as , using equation 1, one finds that the number of shocked electrons is proportional to . The scalings of the hydrodynamic variables in terms of the observer time are
| (2) | |||||
| (3) |
where is the total number of electrons in the shell. Note that the Lorentz factor does not depend on its initial value after the reverse shock becomes relativistic.
After the shock crosses the shell at , the profile of the forward shocked ISM begins to approach the Blandford-McKee (BM) solution (Kobayashi, Piran & Sari 1999). Since the shocked shell is located not too far behind the forward shock, it roughly fits the BM solution. The author and Sari (1999) numerically showed that the evolution is well approximated by the BM solution if the relativistic reverse shock can heat the shell to a relativistic temperature. Then, we apply the BM scalings to the evolution of the shocked shell. The number of the shocked electrons is constant after the shock crossing because no electron is newly shocked.
| (4) |
2.2 the Thin Shell Case
In a thin shell case the reverse shock is too weak to decelerate the shell effectively, the Lorentz factor of the shocked shell material is almost constant during the shock propagates in the shell. Due to a slight difference of the velocity inside the shell, the shell begins to spread as around . Then, the density ratio decreases as . The scalings before the shock crosses the whole shell at are given by
| (5) |
In the above thick shell case the spreading effect was not important since it happens after the shock crossing.
The Newtonian reverse shock can not heat the shell to a relativistic temperature which the BM solution assumes, then, we are not able to use the BM solution. However, we derived scaling laws for a cold shocked shell, assuming that the Lorentz factor is described by a power law and that the shell expands adiabatically with a sound speed in the shell’s comoving frame. We numerically showed that the scalings with fit the evolution (Kobayashi & Sari 2000).
| (6) |
3 Light Curves of the Reverse Shock Emission
We consider now the synchrotron emission from a reverse shocked shell. The shock accelerates electrons in the shell material into a power law distribution: . Assuming that a constant fraction and of the internal energy go into the electrons and the magnetic field respectively, one finds that the typical random Lorentz factor of the electrons and the magnetic field evolve as and .
The spectrum is given by the broken power laws discussed in Sari, Piran & Narayan (1998). In this paper we neglect the self absorption since it does not affect the optical radiation in which we are interested. Then, it has two breaks at the typical synchrotron frequency and at the cooling frequency which is the synchrotron frequency of electrons that cool on the dynamical time of the system. The peak flux is obtained at the lower of the two frequencies. Let and be the total number of the shocked electrons and the distance to the observer respectively. The observed peak flux density evolves as .
The spectra do not depend on the hydrodynamics of the shell. However, the light curve at a fixed frequency depends on the temporal evolution of the break frequencies and and the peak power . These depend on how and scale as a function of . We will apply the adiabatic evolution discussed in section 2 to the shell evolution. It is justified if the fraction of the energy going to the electron is small or if we are in the regime of slow cooling where the electrons forming the bulk of the population do not cool.
3.1 the Thick Shell Case
A reverse shock crosses a thick shell at , the peak time of the emission from the reverse shock is comparable to the GRB duration . Using the estimates in section 2 we obtain the break frequencies and the peak flux at the shock crossing time,
| (7) | |||||
| (8) | |||||
| (9) |
where we have scaled the parameters as ergs, , , , , sec and cm. The equipartition values , and protons/cm3 are inferred for GRB 970508 (Wijers & Galama, 1999; Granot, Piran & Sari 1999). The scalings before and after the shock crossing are given by
| (10) | |||||
| (11) |
It is interesting that is constant during the shock crossing.
The spectrum is the slow cooling throughout the evolution if at . The shaded region in figure 1 shows the corresponding parameter region. The flux at a given frequency evolves as
| (14) | |||||
| (18) |
The flux at a frequency above disappears at because no electron is shocked anymore. This cut off frequency decreases as due to the adiabatic expansion of the fluid. The index is for the standard choice .
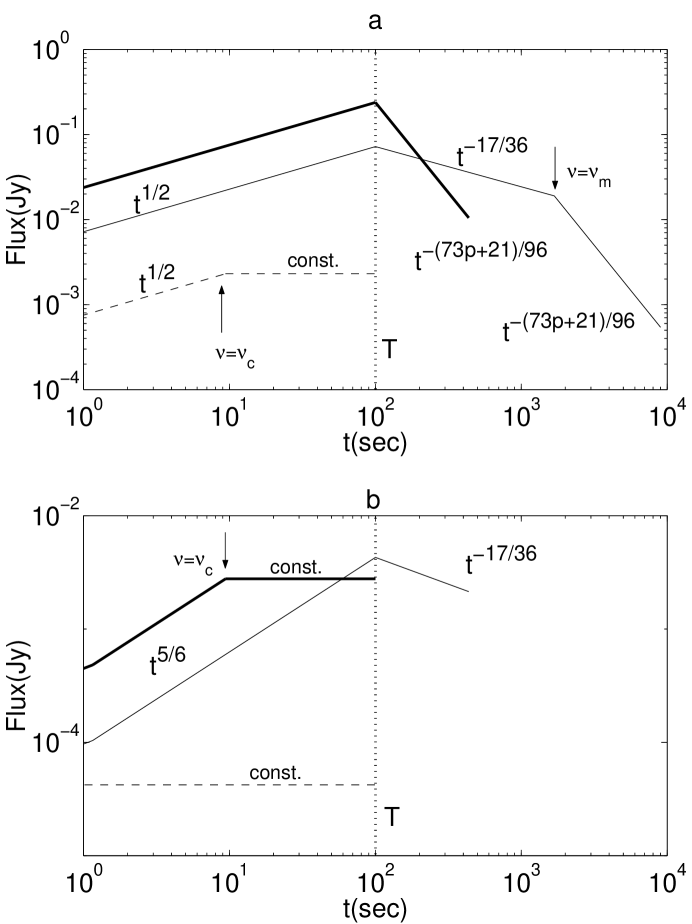
The light curves are different among three frequency regimes separated by the two frequency, and at . The typical light curves are shown in figure 2a. The flux initially increases at all frequencies as , but the high frequency light curve flats when the cooling frequency crosses the given frequency. At , the flux begins to decay as or . Finally it vanishes when crosses the given frequency at
| (19) |
With a parameter set in the upper right region of the dashed line in figure 1, the spectrum changes from the slow cooling to the fast cooling during the shock crossing. The light curves are different among three frequency regimes separated by and at . The typical light curves are shown in figure 2b. We neglected the initial slow cooling phase in the figure since the transition happens at very early time. The flux at a given frequency above is constant and below it increases as . When the shock crosses the shell, above it vanishes. After that, below it decreases as until crosses the given frequency.
3.2 the Thin Shell Case
As a thin shell case, the shell width should be smaller than . Then, separation is expected between the GRB and the peak of the emission. The corresponding parameter region is lower left of the solid line in figure 1. The break frequencies and the peak flux at are given by
| (20) | |||||
| (21) | |||||
| (22) |
Note that these do not depend on the initial shell width itself though should be smaller than . The scalings before and after are as follows,
| (23) | |||||
| (24) |
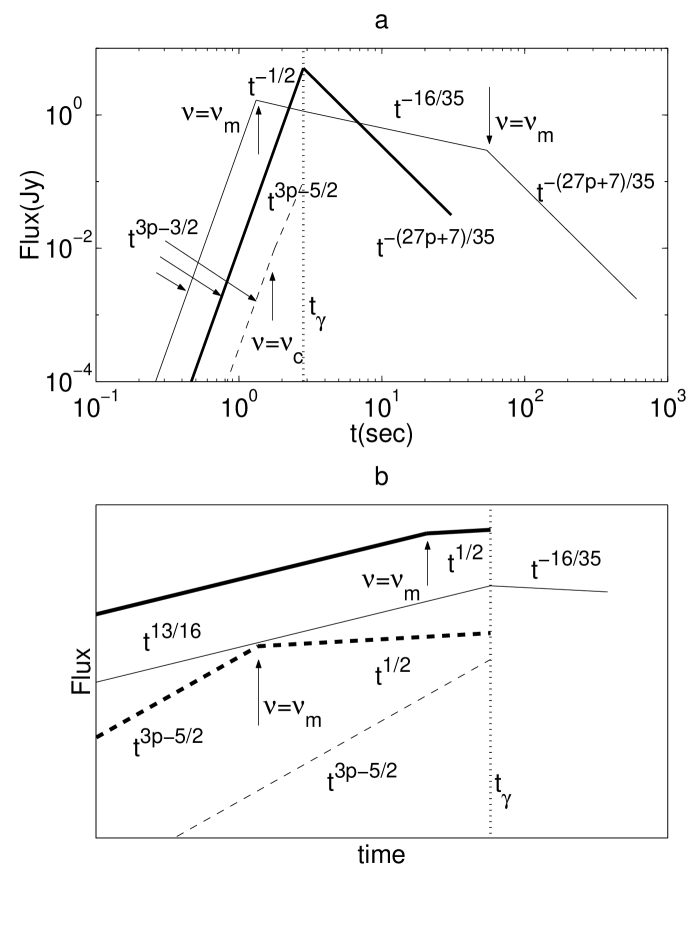
If the spectrum is the slow cooling throughout the evolution, the behavior of the light curves are different among the three frequency regimes separated by and at . Figure 3a shows typical light curves. The flux initially increases in all regimes very rapidly as for ). The slope changes when or crosses the given frequency. After , the flux decays as or for ). The emission at a frequency disappears when the cut off frequency crosses it at
| (25) |
If is higher than at , the spectrum changes from the slow cooling to the fast cooling during the shock crossing. However, it requires a large Lorentz factor . Then, the transition happens only if the shell is extremely thin (see figure 1), then it is hard to detect such a prompt emission. We show the possible light curves for completeness. The behavior is different among the following four frequency regimes: , , and where and is the transition time from the slow cooling to the fast cooling. The typical light curves are shown in figure 3b in which the very early slow cooling phase is neglected.
4 Observations
We in this section compare our estimates with the ROTSE observations. First, we determine the parameters of the fireball of GRB 990123 from the observations. Then, we make some comments on the lack of the prompt optical emission from GRB 981121 and GRB 991223 in the context of our model.
4.1 GRB 990123
GRB 990123 is a very bright burst which fluence is about 100 times that of a median BATSE burst. Absorption lines in the optical afterglow gives a lower limit of the redshift , the energy required to produce the bright GRB is enormous, ergs for an isotropic emission. ROTSE detected a strong optical flash during the burst (Akerlof et al. 1999). About sec after the GRB trigger, it reached to a peak of Jy and then decayed with a slope of a power law index .
The fireball of GRB 990123 is likely to be a marginal case (Kobayashi & Sari 2000). However, such a marginal case behaves very much like the thin shell case, since the shell heated by a mildly relativistic shock becomes cold soon. The observed decay is in good agreement with the theory . This means that the relation among , and the observed optical frequency Hz is at the peak time. Furthermore, the strong optical emission implies that is close to (Sari & Piran 1999b).
It is well-known that the peak time is sensitive to the Lorentz factor of the shell, so we obtain . Since the reverse shock is mildly relativistic, the Lorentz factor at the peak time should be close to the initial Lorentz factor which can be estimated by using equation 25. The last detection of the optical flash by ROTSE was sec after the GRB trigger. Using the equality of the Lorentz factors, we obtains and protons/cm3. With these parameters the typical synchrotron frequency at the peak time is Hz which is close to and it is consistent with the initial assumption.
Though we can not give a strong argument on the raising part of the light curve since the observation is sparse, the power law index of the slope calculated from the first two ROTSE data is 3.4. The sparseness can make only the index smaller, then the real index is at least larger than that of a thick shell.
4.2 GRB 981121 and GRB 981223
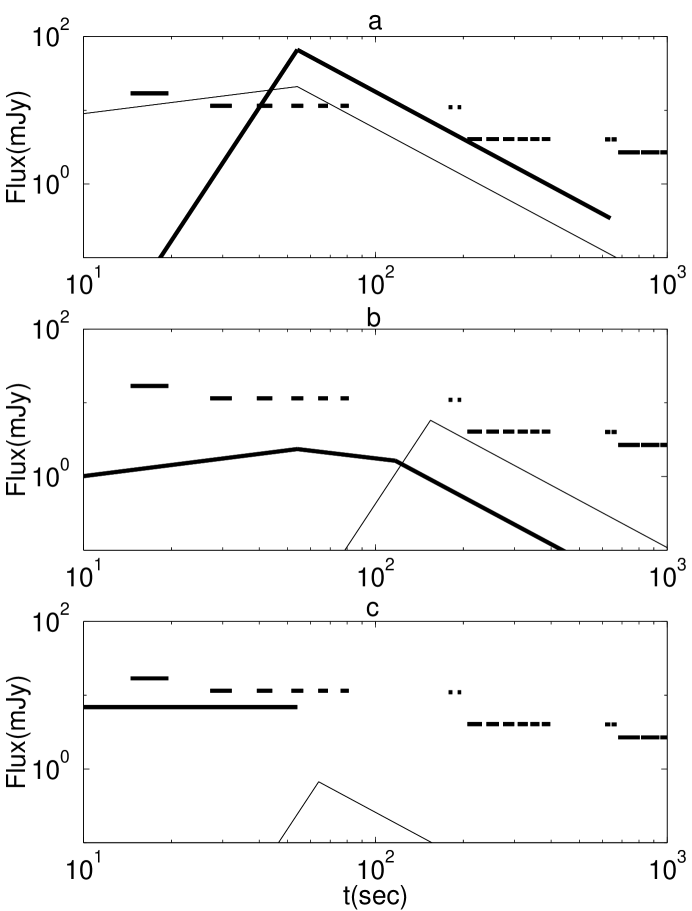
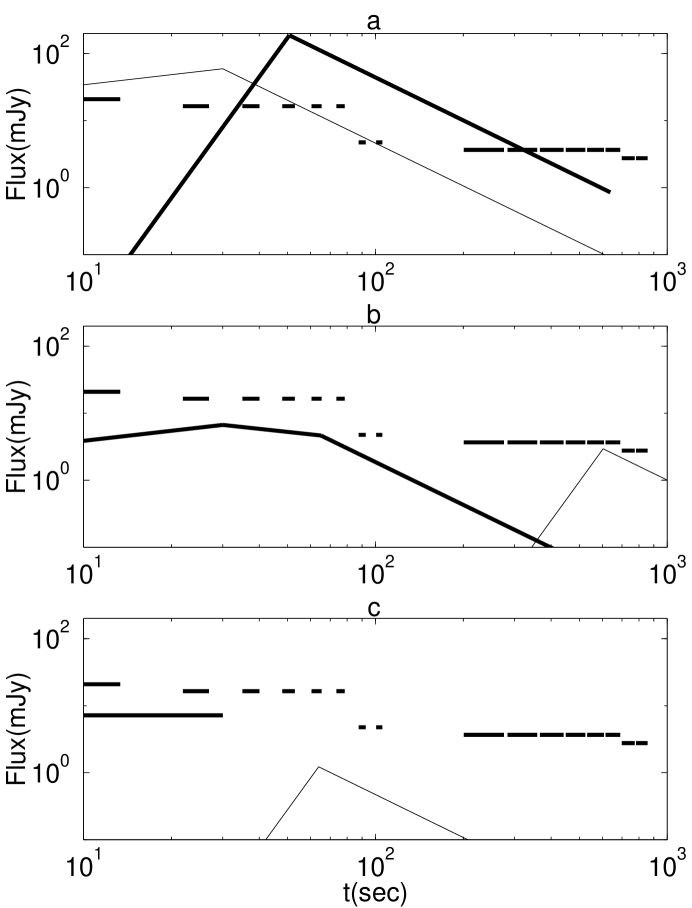
The theory succeeded for GRB 990123, but the optical flash was detected only for it so far. Akerlof et al. (2000) reported no detections of the optical flashes to six GRBs with localization errors of 1 deg2 or better. Especially, GRB 981121 and GRB 981223 are the most sensitive bursts in the sample. If the optical flashes are correlated with the GRB fluences, the optical emission should be more than 2 mag over the ROTSE detection thresholds. The thick lines in figure 5a and 6a show the light curves expected from the GRB fluences, ergs/cm2, ergs/cm2 and ergs/cm2 (Akerlof et al. 2000).
GRBs are produced by the internal shocks, while the afterglows and the optical flashes are due to the external shocks. The lack of a direct scaling between the GRB and the afterglow is an evidence of the internal shocks model. However, the energy radiated in the GRB phase is still correlated with the blast wave energy estimated from the x-ray afterglow (Freedman and Waxman 1999). According to their analysis, the ratios of 13 events are in between 0.1 and 6, while ranges from ergs to ergs. Furthermore, of GRB 990123 is a relatively large value in the sample. Therefore, the scaling with the GRB fluence does not overestimate in general.
GRB 990123 was an exceptionally energetic burst. The energies of GRB 981121 and GRB 981223 should be considerably lower to explain the lower fluences, otherwise the sources are extremely far, z=10 for GRB 981121 and z=6.5 for GRB 981223 assuming and . Hereafter we assume ergs for the two bursts. Since GRB 990123 is a marginal case, a burst with a lower E and a comparable , and is classified into the thick shell case in which is proportional to instead of . Then, the peak flux for ergs is lower by a factor of than that just scaled by the GRB fluence. The thin lines in figure 5a and 6a depict the corrected light curves which are still above the thresholds. The durations of GRB 981121 and GRB 981223 are 54 sec and 30 sec respectively and comparable to that of GRB 990123.
A possible solution to the problem is to assume that the reverse shock energy is radiated at a non-optical frequency, or . The typical frequency is proportional to , but the values of and are determined by the micro-physics and are likely to be universal. The difference of should be due to that and of the bursts are different from the “canonical” values, protons/cm3 and .
If and are smaller than the canonical values, is lower than since for GRB 990123. Using the normalization by the GRB fluence, the peak flux is
| (26) |
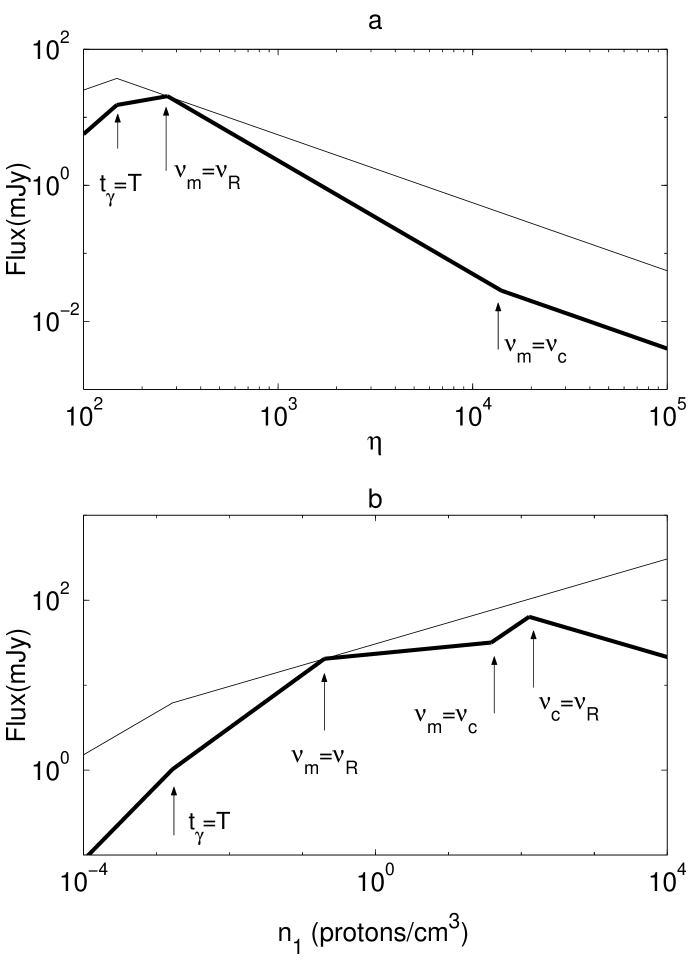
where the subscript 0 denotes that the parameters are scaled by the values of GRB 990123, ergs cm-2, ergs, sec, protons cm-3 and . The fireball is classified into the thin shell case if we assume very small or , thus the dependence of the peak flux on and changes to . and at the peak time are plotted in figure 4 as functions of and in the case of GRB 981121. The no detections by ROTSE give upper limits on and . Assuming protons/cm3, we get for GRB 981121 and for GRB 981223, or assuming , protons/cm3 for GRB 981121 and protons/cm3 for GRB 981223. The light curves with a low or are shown as the thin lines in figure 5b,c and 6 b,c.
If we assume a larger or than the canonical values, the peak flux is given by
| (27) |
The spectrum changes to the fast cooling if or is very large, the dependence on and changes to . For a further larger , can be lower than , then the dependence becomes . The no detections give lower limits, assuming protons/cm3, for GRB 981121 and for GRB 981223, or assuming , protons/cm3 for GRB 981121 and protons/cm3 for GRB 981223. The light curves for a large or are shown as the thick lines in figure 5b,c and 6b,c.
A large ISM density is an unlikely reason to explain the no detections, because we need to require several order larger density than the canonical and with the large density the peak power itself is very large (see figure 4b). However, there is a possibility of the extinction. Though we have normalized the optical flux according to the GRB fluence, gamma-rays do not suffer any kind of extinction. A half of x-ray afterglow bursts do not have optical afterglows, it might be due to the extinction. The reverse shock radiates at a closer region to the inner engine, it might be crucial. Within the six bursts to which the ROTSE group reported the no detections, only the location of GRB 980329 was determined precisely by BeppoSAX, and the optical afterglows were observed hours later. However, the ROTSE observation on this burst was not so sensitive. Future observations will provide some information to this effect.
5 Conclusions
We have constructed the full light curves of the reverse shock emission for a short burst (thin shell) and a long burst (thick shell). The typical synchrotron frequency increases rapidly as in the thin shell case while it is constant in the thick shell case. For a plausible moderate Lorentz factor, upto a few thousand, the synchrotron spectrum is the slow cooling throughout the evolution, with which spectrum we find that the flux must rise initially steeply as or in the thin shell case, and slowly as in the thick shell case.
The rise ends when the reverse shock crosses the shell. Only the exception is the low frequency emission from a thin shell which already begins to decrease when the rapidly changing typical frequency crosses the observe one. In the decay phase, the light curves are similar for both cases, though the hydrodynamics are very different. Then, the detection before the peak should be more useful to give a constraint on the initial properties of the fireball.
The prompt optical emission from GRB 990123 is well described by the reverse shock emission. The observations enabled us to determine the initial Lorentz factor and the ISM density. We found that GRB 990123 is a “luck” burst. Besides the exceptionally large energy, it has an optimized Lorentz factor to produce a bright optical flash. As the initial Lorentz factor increases, the peak power, , initially rises. However, with a moderate initial Lorentz factor the evolution changes to the thick shell case in which the Lorentz factor at the peak time no longer depends on the initial Lorentz factor. Then, the peak power drops since the number of the electrons in the shell continues to decrease. Therefore, the marginal case gives the brightest emission. GRB 990123 is the marginal case and the typical frequency just comes to the optical band.
The lack of the prompt optical detections by ROTSE for GRB 981121 and GRB 981223 does not give strong constraints on the initial Lorentz factors or the ISM densities. If the Lorentz factor is slightly different from that of GRB 990123, the peak flux becomes lower than the ROTSE thresholds. It is also possible to explain the no detections by a lower ISM density.
The author thanks Re’em Sari for helpful discussions, and Robert Kehoe for providing with the ROTSE data. This work was supported by the Japan Society for the Promotion of Science.
References
Akerlof,C.W. et al. 1999, Nature, 398, 400.
Akerlof,C.W. et al. 2000, ApJ, 532, L25.
Blandford,R.D. & McKee,C.F. 1976, Phys of Fluids, 19, 1130.
Freedman, D.L. and Waxman, E. 1999, astro-ph/9912214.
Granot, J., Piran, T. & Sari, R., 1999, ApJ, 527, 236.
Kobayashi,S., Piran,T. & Sari,R. 1999, ApJ, 513, 669.
Kobayashi,S. & Sari,R. 2000, ApJ, 543, in press.
Mészaros,P. & Rees,M.J. 1997, ApJ, 476, 231.
Sari,R. & Piran,T. 1995, ApJ, 455, L143.
Sari,R. & Piran,T. 1999a, ApJ, 520, 641.
Sari,R. & Piran,T. 1999b, ApJ, 517, L109.
Sari,R. & Piran,T. & Narayan,R. 1998, ApJ, 497, L17.
Wijers,R.A.M.J. & Galama, T.J. 1999, ApJ, 523, 177.