Absorption line systems on the line of sight from SN 1987A to SN 1993J and the intergalactic cloud in front of M 81
Abstract
We present an extended analysis of the high dispersion IUE spectra of SN 1993J in M 81, based on the improved data in the IUE final archive. Eight interstellar absorption components can be identified in the velocity range from km s-1 to km s-1. Column densities are determined for Fe ii, Mg i, Mg ii, O i, S ii, Si ii, and Zn ii. From the ion ratios, we estimate electron densities and temperatures of the gas in these components. In addition, we rederive column density profiles for the higher ionisation stages Al iii, Si iv, and C iv for the entire line of sight.
Of special interest are the absorption components at positive velocities, which are associated with the intergalactic medium (IGM) in the foreground of M 81. The medium has many gas components, as known from radio measurements, probably released in dynamical interactions by galaxies in the M 81 group. The IUE spectra contain the only UV absorption information on such gas. We find neutral and ionised gas absorption at the same velocity, having a metal content similar to a galactic disk.
We combine the spectra towards SN 1993J in M 81 with those towards SN 1987A in the LMC, the directions being essentially antipodes on the celestical sphere. Comparing the total profile with QSO spectra, we conclude that most absorption in QSO spectra occurs in diffuse clouds on those sight lines and is not similar to absorption by galactic disk gas. However, one absorption component towards SN 1993J is clearly very similar to some of the absorption components in QSO spectra.
Key Words.:
supernovae: individual: SN 1993J – Galaxy: halo – intergalactic medium – Galaxies: ISM – quasars: absorption lines – Ultraviolet: ISM1 Introduction
In recent years two supernovae occurred in nearby galaxies, SN 1987A in the LMC and SN 1993J in M 81. High resolution UV spectra of both supernovae have been taken with the IUE satellite in the full wavelength range from 1150 up to 3200Å. A large number of absorption lines from various metals is located in this part of the spectrum, providing valuable information on the Galactic and extragalactic interstellar medium along the lines of sight to the two neighbouring galaxies.
A first analysis of the ISM in the direction of SN 1993J using IUE spectra was made by de Boer et al. (deboer93 (1993)). Optical spectra of the supernova were analysed by Vladilo et al. (vladilo93 (1993), vladilo94 (1994)). High velocity clouds (HVCs) and intermediate velocity clouds (IVCs) are present. These designations refer to gas with velocity not compatible with what is expected from Galactic rotation. Rather arbitrarily, HVC is used for km s-1 and IVC for km s km s-1. We extend the previous analysis of IUE spectra by using the rereduced spectra from the final archive (IUEFA111WWW URL: http://iuearc.vilspa.esa.es) to determine column densities for the metals in the neutral components. We rederive the column density profiles for the high ion stages of Al iii, Si iv and C iv.
The absorption components at velocities km s-1 are of major interest here. Their velocities are uncommon for the Galactic sky in this direction and the absorption most likely originates in or near the M 81 galaxy group (distance of M 81 Mpc, Freedman et al. freedman94 (1994)). The column densities derived are used to estimate the density and temperature in these clouds and to find support for the proposed location. Appleton et al. (appleton81 (1981)) give a list of velocities for members of the M 81 group. M 81 itself has a systemic velocity of km s-1, with a rotational velocity of km s-1 at the position of SN 1993J (Rots rots75 (1975)). The velocity of M 82 is km s-1; that of NGC 3077 km s-1. Intergalactic molecular gas was found in CO emission southeast of the M 81 disk at a velocity of km s-1 (Brouillet et al. brouillet92 (1992)). Also, intergalactic gas at velocities of to km s-1 is detected in a tidal tail region connecting M 81 and M 82, north of the M 81 center (Appleton et al. appleton81 (1981), Yun et al. yun93 (1993)). The gas found in the SN 1993J absorption spectra fits into this range of velocities.
Combining the spectra towards SN 1993J with those towards SN 1987A (essentially on the opposite side of the sky) allows one to create the absorption spectrum through 3 galaxies. This total spectrum is compared with absorption as seen on QSO lines of sight. This provides a possibility to judge the origin of the absorptions.
2 The data
We analysed the IUE spectra provided by the ESA IUE Final Archive at VILSPA, Spain. Four spectra of SN 1993J were obtained: two each in the short and long wavelength range (SWP 47386, SWP 47394, LWP 25238, LWP 25250). The resolution of the spectra is about km s-1. The dates of the spectra are listed in Table 1. For a representative selection of absorption line spectra see Fig. 1. Due to the rapid decrease in UV flux in the supernova, the net flux is significantly weaker for those spectra which were taken later. This leads to a lower signal-to-noise ratio, even though these spectra have larger exposure times.
The SN 1993J data from IUE can be combined with published data from other wavelength regions. In particular, we use sodium column densities derived by Vladilo et al. (vladilo93 (1993), vladilo94 (1994)) and by Bowen et al. (bowen94 (1994)) from optical spectra. Bowen et al. (bowen94 (1994)) also derive column densities for Mg ii from HST GHRS spectra, at a higher resolution than that of the IUE. The Effelsberg H i 21 cm spectra (Vladilo et al. vladilo94 (1994)) are also taken into account.
A much larger number of spectra was taken for SN 1987A. Referring to the spectral atlas of Blades et al. (blades88a (1988)), we use the short wavelength spectrum SWP 30381, which has unsaturated net flux of FN in the echelle orders -. The spectrum was taken on 25 February 1987 with an exposure time of min. No long wavelength spectrum of SN 1987A is used.
| Image | 1993 Date | Time | Exp. time [min] |
|---|---|---|---|
| LWP 25238 | 30 March | 06:13 UT | |
| SWP 47386 | 30 March | 07:58 UT | |
| SWP 47394 | 31 March | 05:43 UT | |
| LWP 25250 | 01 April | 03:41 UT |

The spectra show the typical velocity profile seen along almost all sight lines towards the LMC (Savage & de Boer savage81a (1981); de Boer & Savage deboer80 (1980)): local Galactic gas around km s-1, a Galactic IVC and HVC at and km s-1, respectively, one absorption component of as yet unassigned location in front of the LMC at km s-1, and broad LMC absorption between and km s-1.
Metal column densities for SN 1987A were recently derived by Welty et al. (welty99 (1999)) using profile fitting. For the high ionisation states we use the analysis by Savage et al. (savage89 (1989)).
The SN 1993J spectra discussed here are reduced by the NEWSIPS algorithms, in contrast to the analysis published by de Boer et al. (deboer93 (1993)). This provides an improved background correction, especially in the higher, closely spaced echelle orders, an increased signal-to-noise ratio, and a higher spectral resolution (Garhart et al. garhard97 (1997)). We smoothed the data using a pixel wide boxcar algorithm. In the NEWSIPS spectra the zero intensity level of strong absorption lines appears to lie a few percent too low. We have generally lifted the zero level accordingly.
3 Lower ionisation stages in the SN 1993J spectra
3.1 Metal and H i column densities
| A | B | C | Da | Db | E | F | G | |
|---|---|---|---|---|---|---|---|---|
| [km s-1] | ||||||||
| Fe ii | ||||||||
| Mg i | – | – | – | |||||
| Mg ii | ||||||||
| O i | – | – | ||||||
| S ii | ||||||||
| Si ii | ||||||||
| Zn ii | – | – | ||||||
| [km s-1] a | 9 |
a -values are derived from curves of growth. Their uncertainties can be up to km s-1, depending on the scatter of the equivalent widths
The wavelength scale of the IUE spectra might be affected by pointing errors, resulting in a velocity shift for the absorption components. We therefore fix the velocity scale by aligning, for each transition, the absorption at and km s-1 with the corresponding clearly visible emission in the Vladilo et al. (vladilo94 (1994)) H i 21 cm spectra. All velocities are given with respect to the LSR.
For the identification of the absorption components we use the well exposed transitions of Si ii at 1304 Å and of Fe ii at 2382 Å. Due to the improved data reduction, we are able to resolve eight absorption components (see Fig. 1) with the velocities listed in Table 2. An additional component might be present at km s-1 in some transitions, but it is too weak for analysis. No absorption components are seen at velocities lower than km s-1 or larger than km s-1. Due to the low signal-to-noise ratio of the spectra, the centres of the absorption components vary slightly and we refer to the components by rounded radial velocities.
The component D around km s-1 in many cases splits into a strong component Da and a weak Db. These components, however, cannot be clearly distinguished in all transitions. Components A and B near and km s-1 are resolved, but still seem to blend in some transitions. We analyse them separately now, in contrast to the previous publication. The same holds for F and the weaker component G. The blending leads to larger uncertainties in the resulting column densities, especially for the weaker of these components. Component E was disregarded in the previous publication, but is clearly visible in most transitions.
The equivalent widths of the absorption lines are measured using a trapezium fit. Due to the faint continuum no better results would be achievable with Gaussian fitting. We account for uncertainties in the continuum by determining equivalent widths for a lowest and highest possible local continuum. Half of this variation is quadratically added to the error resulting from noise. Metal column densities are then determined using standard curve-of-growth methods.
We use the transitions of Fe ii (1608, 2260, 2344, 2374, 2382, 2586, and 2600 Å), Si ii (1260, 1304, 1526, and 1808 Å), Mg i (2852 Å), Mg ii (2796 and 2803 Å), O i (1302 Å), S ii (1250, 1253, and 1259 Å), and of Zn ii (2026 Å); values are taken from the compilation by Morton (morton91 (1991)), plus newer values from the review by Savage & Sembach (savage96 (1996)). The -value for each absorption component is fixed using the equivalent widths of the Si ii and Fe ii transitions. The remaining equivalent widths are then fitted to the appropriate theoretical curve of growth. Column densities and -values are given in Table 2. The errors listed represent minimum and maximum column densities possible within the range in , allowed by the errors in the equivalent widths. All subsequent error values follow from standard error propagation.
H i column densities from H i 21 cm emission spectra (Vladilo et al. vladilo94 (1994)) can only be derived for the components C at km s-1 and Da and Db around km s-1. The broad emission from the disk of M 81 makes it impossible to give reliable H i column densities for the absorption components at higher negative velocities. At positive velocities only upper limits follow from the cm spectra.
However, we can derive H i column densities for all absorption components from the column densities of the normally only slightly depleted sulfur and zinc, under the assumption of no depletion at all for these two metals. Although this assumption introduces an additional source of error, this method provides more reliable information on H i in the single components than the 21 cm radio spectra at large cloud distances, since these are based on integration over the full width of the radio beam. As shown in Table 3, the H i column densities calculated this way are in good agreement with the 21 cm measurements for those components, for which values are given by Vladilo et al. (vladilo94 (1994)). For the other components the column densities from the IUE data are equal to or larger than those from the radio emission spectra, which is expected for clouds at a larger distance that do not fill the radio beam. Based on these data, the metal abundances also listed in Table 3 can be calculated. The large depletion of metals in component Db is possibly the result of underestimated metal column densities due to blending with the strong component Da.
3.2 Physical conditions in the gas
Important information on the physical conditions in the interstellar clouds, such as temperatures and electron densities, can be inferred from the column density ratios of the atom’s different ionisation stages. The various spectra of SN 1993J provide column densities for two of these:
The ratio of can be read directly from the IUE spectra for most absorption components. If Mg i column densities cannot be determined from the IUE spectra, we take the values of Bowen et al. (bowen94 (1994)) from GHRS spectra. Since these data have a higher resolution, we have to identify their components with those found by us. We assume (velocities in km s-1)
A; B;
C; Da; Db;
E; F; G.
The resulting values are listed in Table 4. For Mg i in Da we assume the larger column density from Bowen et al. (bowen94 (1994)) as an upper limit. The larger value in E can be due to an additional component at km s-1 in the GHRS data. We will use the column density from IUE in this component. The other values agree within the ranges of the errors.
Comparing the Mg ii profile at 2803 Å from IUE and GHRS spectra, one finds in the IUE profile what looks like a feature between and km s-1 (see Fig. 1). Considering the superior quality of the GHRS spectra, this feature is probably not real. The effect of the feature on the resulting column densities, however, is negligible.
The ratio is not available from observations. We can, however, use as a substitute (Vladilo & Centurión vlad_cen94 (1994)). The only slight depletion of Zn ii and its ionisation potential of eV make it a good tracer of the neutral gas, while Na i is sensitive to the physical conditions in the gas.
| (Bowen) | ||||
|---|---|---|---|---|
| A | – | |||
| B | – | |||
| C | ||||
| Da | ||||
| Db | – | |||
| E | ||||
| F | ||||
| G |
| (Vladilo) | (Bowen) | ||||
| A | obs. | ||||
| B | – | obs. | |||
| C | obs. | ||||
| Da | obs. | ||||
| Db | – | Eq. (3.2) | |||
| E | – | obs. | |||
| F | obs. | ||||
| G | – | – | Eq. (3.2) | ||
Column densities for Na i are given by Vladilo et al. (vladilo94 (1994)) and by Bowen et al. (bowen94 (1994)). We equate the higher resolved optical velocity components with our IUE components as defined above for Mg i. Both optical data sets are quite similar. Bowen et al. (bowen94 (1994)), however, have spectra of a slightly higher resolution than those of Vladilo et al. (vladilo94 (1994)), resulting in a larger number of fitted Na i components.
In most cases, the Na i column densities from the two optical spectra, assigned to our component structure, are comparable (Table 5). The values disagree for the weak component Db, due to different velocity centres of the fitted components. We thus take the value from Vladilo et al. (vladilo94 (1994)) as an upper limit. A strong discrepancy is visible in the local component Da. The value of Vladilo et al. (vladilo94 (1994)) is assumed as a lower limit. No Na i is detected at km s-1 (component G).
In the components Db and G, where a column density for Zn ii cannot be determined, we use instead the linear approximation of Vladilo & Centurión (vlad_cen94 (1994))
based on only Na i. However, these values can only describe the general tendency and must not be overinterpreted.
Temperature and electron density in a gas are related to the ionisation ratio of an element X according to
| (2) |
where is the photoionisation rate and the recombination coefficient. As an initial approximation for , we use the values WJ1 of de Boer et al. (deboer73 (1973)), based on the mean Galactic radiation field of Witt & Johnson (witt73 (1973)). Additional contributions from charge exchange reactions (see e.g. Péquignot & Aldrovandi pequignot86 (1986)) can be neglected, since the density of the gas is low.
Radiative recombination coefficients are taken from Péquignot & Aldrovandi (pequignot86 (1986)). For magnesium we must also take into account the dielectronic recombination coefficient given by Shull & van Steenberg (shull82 (1982)), and the contribution of dielectronic recombination processes at lower temperatures calculated by Nussbaumer & Storey (nussbaumer86 (1986)).

For magnesium we therefore get a temperature dependent electron density of
| (3) |
while we use for sodium
| (4) |
with
| (5) |
assuming solar abundances. The left approximation in Eq. (5) is valid, because in neutral gas the first ionisation stages of sodium and zinc are far more abundant than the neutral forms.
Plotting these two functions into a diagram for each component, we can read the physical conditions in the gas from the line curve intersepts (Fig. 2). The resulting limits for temperatures and electron densities are given in Table 6. Exact limits could not be given for all components.
Only component C yields a well defined intersept that provides firm limits on and . For A, a value in the flat part of the diagram below K seems to be most probable. If was significantly higher in this cloud, one would expect a much higher state of ionisation and thus much higher electron densities in the gas, which would not fit with the diagram. Only Db seems to have a combination of high temperature and high electron density. For E and G we probably have temperatures between and K.
Since the curves of magnesium and sodium are nearly parallel below about K, we need additional information for a more precise temperature determination. According to Vladilo & Centurión (vlad_cen94 (1994)), can be used by itself as an indicator for temperature and electron density in the gas. In our data the column densities are not exact enough for to provide tight restrictions to these parameters, but we can at least assume cold gas around K for and warm gas for .
Under this criterion, we find that component Da and probably also F consist of cold gas. While A and C are still undecided, the gas in B is probably warm. For the gas in E and especially G we also get a tendency towards higher temperatures.
| [cm-3] a | [K] a | [cm-3] | [pc] | |
|---|---|---|---|---|
| A | ||||
| B | ||||
| C | ||||
| Da | ||||
| Db | ||||
| E | ||||
| F | ||||
| G |
a from Fig. 2
b adopting fully neutral H, free electrons mainly from C+
c adopting 3% H+
With known electron densities we can now roughly estimate hydrogen densities and hence the extents of the clouds. Assuming the hydrogen in the gas is totally neutral, most of the electrons stem from carbon, which is the most abundant ionised metal in the ISM. For cold gas at about K we thus can use the carbon abundance of dex (de Boer et al. 1987a ) to derive the hydrogen abundance. This probably is the case in components A, Da, and F. For warm gas of several K the fraction of ionised hydrogen can be % to %, depending on the level of ionising radiation in the environment (Vladilo & Centurión vlad_cen94 (1994); Kulkarni & Heiles kulkarni87 (1987)). Under this assumption, electrons from ionised hydrogen are by far dominant. However, the wide temperature ranges derived above and the lack of information on the radiation field in the clouds make it difficult to determine exact densities. For the probably warm components B, C, Db, E, and G with K, we assume a fraction of ionised hydrogen of %.
Based on the values derived for , we then calculate the line of sight extent of each cloud, with appropriate uncertainties. The results are listed in Table 6.
Due to the uncertain ionisation ratio of hydrogen, especially in the warm components, the derived densities could be smaller than listed in Table 6. McKee & Ostriker (mckee77 (1977)) assume a fractional ionisation of 15% for the warm neutral ISM, which would lead to a factor smaller hydrogen densities. In the cool components A, Da, and F a non-negligible fraction of ionised hydrogen could have an even larger effect on the hydrogen densities.
As a consequence, also the calculated cloud sizes strongly depend on the level of hydrogen ionisation assumed for the clouds. The warm clouds are about a factor larger if 15% of the hydrogen is ionised. Looking at the cool components, a fractional ionisation of only 1% already means a linear extent about a factor larger than stated in Table 6.
4 Higher ionisation stages towards SN 1993J
4.1 Column densities
The gas seen in the absorption lines of higher ions is likely spatially distinct from the lower ionised gas and has to be treated separately.
For the analysis, we determine apparent column densities, as described by, e.g., Savage & Sembach (savage91 (1991)): The optical depth at a wavelength is approximately
| (6) |
with the continuum intensity and the observed intensity at this wavelength. For each velocity bin of km s-1, which is the resolution of the IUE, the logarithmic column density apparently occuring in that bin then computes as
where is the transition probability and the wavelength of the transition.
We examine the doublet transitions of Al iii ( and Å), Si iv ( and Å), and C iv ( and Å). No absorption of the N v doublet at and Å is observed along this line of sight. This lack of N v absorption was also observed towards SN 1987A (Fransson et al. fransson87 (1987)) and was to be expected. The lower solar abundance of nitrogen and the lower -values for the N v transitions lead to a nominal line strength about a factor of lower than that of C iv, making N v hard to detect in the halo. Furthermore, the N v transitions are located at smaller wavelengths, where the UV flux from the supernova had already decreased, thus lowering the signal-to-noise ratio in this region of the spectra.
Reliable absorption profiles are calculated for each of the observed spectra. The comparison of the apparent column density profiles in each doublet shows no indication of saturation for any of the atoms, i.e., no unusual deviation in the peak heights. We thus take the mean of the four available profiles (two transitions in each of the two spectra) of each ion. Fig. 3 shows the resulting mean apparent column density profiles. C iv showed an unnaturally low column density at km s-1, which was disregarded.

Significantly larger errors for the mean apparent column densities at velocities lower than km s-1 (Al iii: km s-1) and larger than km s-1 (Al iii: km s-1) indicate a lack of absorption at these velocities. Only upper limits can be given here. Especially near km s-1, the rotational velocity of M 81 at the position of SN 1993J, no absorption is found.
We find a broad absorption component around km s-1 and another broad absorption between and km s-1, the latter probably due to at least clouds of velocities around and km s-1. Also, a weak component at km s-1 is visible. The integrated column densities for these components are listed in Table 7.
| [cm-2] | ||||||
|---|---|---|---|---|---|---|
| [km s-1] | ||||||
| C iv | ||||||
| Si iv | ||||||
| Al iii | – | |||||
4.2 Physical conditions in the gas
Ionisation of gas to the level of Si iv and Al iii can be explained by stellar photons. For C iv the necessary ionisation energy is too large to be provided by stellar radiation, but these ions can be easily produced, for example, in the cooling process of a galactic fountain.
Looking at the apparent column density profiles, we find similar profiles for Si iv and C iv in the negative velocity range, with a nearly constant ratio of about . The profile of Al iii differs, but this might be due to the weakness of the absorption. Both C iv and Si iv possibly exist in the same spatial environment, in a border region between hot, infalling fountain gas and cooler, photoionised or recombined, gas. This spatial coexistence seems to be a common phenomenon in halo gas, it was also found by Savage et al. (savage89 (1989)) on the line of sight to SN 1987A.
Nothing comparable is found in the positive velocity range. The profile of C iv clearly differs from that of Si iv. We probably have spatially distinct clouds at similar velocities here, possibly in the vicinity of M 81.
5 Spatial arrangement of the clouds
An estimate of the locations of the absorbing clouds is difficult for the highly ionised gas. However, we can distinguish three basic groups of gas: gas within the Milky Way, either in the disk or in its halo, gas in M 81, and intergalactic gas at some position in the space between M 81 and the Galaxy, probably near the M 81 group.
5.1 Gas in the Milky Way
In the low ion transitions, components C, Da, and Db are considered to be Galactic gas. Their velocities and their clear visibility in the cm radio emission spectra let any other interpretation than nearby gas seem improbable.
Component C, from its velocity of km s-1, is by definition an IVC in our Galaxy, probably part of the Low Latitude Intermediate Velocity (LLIV) Arch (Kuntz & Danly kuntz96 (1996)). The large -value and column density indicate a possible blend of more than one cloud.
Component Da shows the typical parameters for cold local disk gas.
Component Db may represent absorption by gas of the Local Cloud, in which our solar system is imbedded. For Local Cloud gas in the direction of M 81, Génova et al. (genova90 (1990)) find a temperature around K and a hydrogen density of cm-3 at a velocity of km s-1. The magnesium column density has a low value of only . The extent of this gas is about pc. These parameters agree nicely with our results.
In the profiles of the highly ionised atoms we find additional Milky Way absorption components: The absorption around km s-1 has its origin probably in Galactic disk gas, possibly in gas of the Local Bubble, surrounding the Local Cloud. The gas seen around km s-1 could be related to the IVC component C in neutral gas. A transition between neutral and ionised gas also would explain the coexistence of C iv and Si iv found in Chapter 4.2. We obviously have no contribution from the nearby Galactic HVC Complex C, which, in this general direction, shows velocities of km s-1 and below (Wakker wakker91 (1991)).
5.2 Gas in M 81
We find neutral gas in absorption at velocities near km s-1. From the radiointerferometry map of M 81 gas by Rots (rots75 (1975)), this is the rotational velocity of the galaxy at the position of the supernova. Peak-shaped emission is not visible in the H i 21 cm emission spectra at this velocity, but rather only broad background emission from the disk of M 81. The gas in absorption is thus probably located at a large distance, at which it could not be detected separately in the radio beam of the Effelsberg telescope. For these reasons the components A and B can be assumed to be located in the disk or the lower halo of M 81.
In component A, the H i column density is comparable to local gas. The metal column densities in this component are very similar to those in Milky Way gas. We probably see cold M 81 disk gas at km s-1 here.
Also assuming a location in M 81, component B can be interpreted as an IVC or a blend of such clouds, at a velocity of km s-1 relative to the M 81 disk.
No highly ionised gas is detected that would have to be associated with a location near M 81.
5.3 Intergalactic gas in front of M 81
The three absorption components E, F, and G seen at positive velocities can hardly be assigned to the Galaxy or M 81 itself. They must be intergalactic clouds, located probably in the IGM of the M 81 group. The gas seen in the highly ionised atoms at positive velocities is associated with intergalactic clouds as well.
The hydrogen column density of the cooler component E is comparable to that of the IVC components B and C, with metal depletions in a normal range.
In the cold component F we find a hydrogen column density about one order of magnitude smaller than for the local Galactic component Da. The depletion is low, with presumably no depletion at all for oxygen. This is an indicator for a low dust content in the gas. If we assume a location in the vicinity of M 81, the interpretation as an infalling M 81 HVC is possible. The low temperature, however, contradicts an origin from a galactic fountain mechanism.
Component G shows warm gas of very low hydrogen column density and low metal depletion. Similar to component E, it could be high velocity gas still in its cooling phase, infalling towards M 81.
We find very low electron densities for the warm neutral gas components E and G at positive velocities. This is unusual, since our calculations are based on the Galactic disk radiation field, which is too large for halo gas. The disk radiation fields of the Galaxy and M 81 should be comparable. However, if the components are located at some distance from the disk of M 81, as assumed from their velocities, the level of radiation should be significantly lower, leading to even lower electron densities than derived above. We thus conclude that an enhanced level of ionising radiation exists at the location of the components E and G, at least at the level of a disk radiation field. Evidence for enhanced ionising radiation in a range typical for the Galactic disk was also inferred by Vladilo et al. (vladilo94 (1994)) from the ratio.
Radiation from hot disk stars is an improbable source of energy for this level of ionisation. The interpretation of typical HVCs seems unlikely under these conditions. If located in the foreground of M 81, the dynamic intergalactic medium of the M 81 group itself could provide the energy needed. The source of energy is unclear, but could be shocks or plasma effects like magnetic reconnection (Birk et al. birk98 (1998)). Also mixing effects at the border region between hot intergalactic gas and cooler tidal debris are possible.
The low pressure in the IGM would explain the probably large extent of the hot component E. Component F, from its velocity assigned to this intergalactic gas, is possibly the cold, shielded core of some intergalactic cloud. This would explain the high hydrogen density at a low extent. The high density cm-3 derived assuming free electrons solely from carbon might indicate that at least a small fraction of hydrogen is ionised in this component. This would mean a lower density and a larger extent, rather typical for an extended cold cloud.
The gas seen in the high ion absorption lines at velocities larger than km s-1 must also be located in front of M 81. Bregman (bregman80 (1980)) predicts mainly negative velocities in Galactic neutral gas in the direction of M 81. Of course, the highly ionised gas cannot be identical to this neutral gas. Nevertheless, if both ionisation stages are only different states of infalling gas, their velocities should be comparable. Positive velocities around km s-1, however, have been found by Yun et al. (yun93 (1993)) in the tidal tail region connecting M 81 and M 82.
Since we find indicators for a high energy environment from the lower ionisation stages, the coexistence of highly and low ionised gas and cold, shielded cloud cores in the M 81 group IGM is plausible. Similar conditions were recently found by Sembach et al. (sembach00 (2000)) in the Magellanic Stream and in outer Galaxy HVCs, where neutral H i gas is visible together with O vi at the interface to the surrounding hot medium.
6 Combined SN 1987A to SN 1993J line of sight
6.1 Line of sight and velocity structure
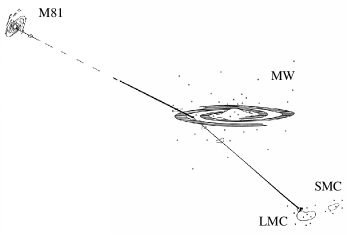
The antipodal directions of the two supernovae allow us to combine their lines of sight into a single one that traverses three galaxies in a direction nearly perpendicular to the plane of the Local Group (Fig. 4). As noted by de Boer et al. (1987b ), the position of SN 1987A is on the backside of the LMC. Starting there, the line of sight crosses the local LMC gas, the HVCs and IVCs of the southern Galactic halo, the full disk of the Milky Way, and its northern halo with the IVC. It continues on, sampling the intergalactic medium towards the M 81 group and the halo of M 81, before it reaches the disk of M 81 itself at the location of SN 1993J. The total length of this line of sight is about Mpc, sampling gas at a total velocity width of km s-1.
To create a spectrum over the combined line of sight we merge the absorption line spectra of the two supernovae. We examine the transitions of Si ii at , and Å, as well as the C iv transition at Å. For the combination we use the ripple corrected spectra and sum over the absorption in each velocity bin. We do lose some equivalent width in those absorption components which are saturated. It is shown below (Sect. 6.2), however, that this loss has a negligible effect on the total equivalent width. It is not neccessary for this examination to add the optical depths and generate Voigt profiles of the absorption, which is the mathematically correct procedure. Fig. 5 shows the combined absorption profiles for the total line of sight. We see a complex blending of absorptions from the different galaxies in the absorption profile. Without knowledge about the individual galaxies it is impossible to associate individual absorption components with a particular galaxy.

6.2 Column densities
We obtain the equivalent widths for the complete absorption structure by a trapezium fit. For Si ii we can fit these values to a theoretical curve of growth with a doppler parameter of km s-1. A -value that large was to be expected for such massive blending of absorption components. The total absorption leads to a column density of . If we just sum over the equivalent widths of the single components and fit these to a curve of growth, we get the same value of , but with a -value of km s-1. Obviously, the column density for these data is not very sensitive to changes in the equivalent width. This justifies the procedure of just adding the absorption profiles instead of correctly adding the optical depths.
From the sum over the single column densities we get , which is about a factor of larger than from the curve of growth. This deviation shows that, in absorption profiles with heavy line blending, the total column density can easily be underestimated by a significant amount.
No reliable total column density can be determined for C iv. With only one data point we cannot use the curve of growth method. The apparent column density method is not suitable here, due to the saturation of the profile. The sum over the single column densities is , using the value of (Savage et al. savage89 (1989)) for SN 1987A and the values from Table 7 for SN 1993J.
7 Comparison with quasar lines of sight
Complex absorption structures seen in the spectra of quasars are commonly identified with absorption by galaxies, galactic halos, or other diffuse objects such as dwarf galaxies along the line of sight (see, e.g., Savage & Jeske savage81b (1981), York et al. york86 (1986), Yanny & York yanny92 (1992)). We now compare typical quasar absorption with the absorption structure found on our Local Group line of sight. We use equivalent widths listed for three different quasar sight lines from Savage & Jeske (savage81b (1981)) and those of one quasar in the Hubble Deep Field South from Savaglio (savaglio98 (1998)). The velocity widths of the absorption complexes are between and km s-1, which is comparable to the km s-1 found for the local absorption. The data are listed in Table 8.
| [cm-2] | Note a | ||||
| Si ii | C iv | ||||
| QSO 1756$+$237 | 1.673 | a | |||
| QSO 0002$-$422 | 2.302 | 14.9 | 14.9 | 0.0 | b |
| PKS 2126$-$158 | 2.638 | 14.8 | c | ||
| 2.769 | 14.3 | 14.7 | 0.4 | c | |
| QSO J2233$-$606 | 1.787 | 14.3 | d | ||
| 1.869 | 14.5 | d | |||
| 1.928 | d | ||||
| 1.943 | d | ||||
| 2.077 | d | ||||
| 2.198 | 13.8 | d | |||
| 2.206 | 14.2 | d | |||
| SN 1987A to SN 1993J | |||||
| LMC gas | |||||
| Clouds F+G to SN 1993J | |||||
a Data from (a) Turnshek et al. (turnshek79 (1979)); (b) Sargent et al. (sargent79 (1979)); (c) Young et al. (young79 (1979)); (d) Savaglio (savaglio98 (1998))
b Gas at km s-1, from Welty et al. (welty99 (1999))
c Gas at km s-1, from Savage et al. (savage89 (1989))
The column densities in Si ii are generally lower on the quasar sight lines than in the SN 1987A - SN 1993J gas, while in C iv the values are similar. The relation of lower to higher ionisation stages is thus significantly lower on the quasar sight lines. Both results are expected, since the local line of sight is an extreme case of three galactic disks along one line of sight. Most of the neutral gas is found in the disks of galaxies, so this explains the high column density in Si ii. The halos of galaxies are far more extended than the disks, so the probability of sampling halo gas in a quasar sight line is far higher than for disk gas. This leads to the observed relation of lower to higher ionisation stages in the quasar absorption complexes and to the generally lower column density in the less dense halo gas.
Dwarf galaxy gas or gas of any other diffuse nature may also produce absorption lines. Substantial Si ii may be present in dwarf galaxies, as in the case of the LMC. Free gas outside galaxies containing metals is most likely material expelled by such galaxies.
The ratio C ivSi ii could possibly be used as an indicator for halo gas along lines of sight. For local gas we get a value of dex, while the values for quasar absorption complexes range between and dex. This ratio can be influenced by different depletions of the elements, however, especially since both ionisation stages exist in completely different environments.
In particular, we can compare the cloud complex F+G located in the intergalactic medium in front of M 81 with these results. Since we do not detect high ions at the velocity of M 81 component E, we consider only the ratio for components F and G alone (see Table 8). In contrast to the total line of sight, the ratio of C ivSi ii for the intergalactic cloud complex is very similar to those from QSO absorption systems, with comparably low column densities.
8 The intergalactic clouds in front of M 81
The cloud complex F+G found in the foreground of M 81 does not show a low density, metal poor structure as one usually assumes for intergalactic gas. Instead, it shows a mixture of cold and warm, normal density, metal rich gas, in coexistence with highly ionised hot components, as normally expected on lines of sight crossing a galactic disk. This indicates that the F+G complex probably contains gas of galactic disk origin.
The complex extragalactic gas features of the M 81 group have been mapped in emission of both H i (see, e.g., Cottrell cottrell77 (1977); Appleton et al. appleton81 (1981); Appleton & van der Hulst appleton88 (1988)) and CO (e.g., Brouillet et al. brouillet91 (1991)). Identifying gas as lying in front of the bright M 81 disk, however, is difficult from emission. The existence of a separate cloud would follow from the difference of its velocity with respect to the velocity of the gas of the background object (here M 81), either in H i or in CO. The UV absorption lines show that the detected gas is indeed in front of M 81. Furthermore, they provide us with full information on metallicities and ionisation ratios in the intergalactic gas in this foreground region.
Molecular gas was found in the intergalactic medium surrounding M 81 (Brouillet et al. brouillet92 (1992); Walter & Heithausen walter99 (1999)). We do not know if molecules exist in component F+G, since no radio molecules were looked for and the visual spectra of SN 1993J gave only upper limits for CH+ (Vladilo et al. vladilo94 (1994)). Given the low temperature of absorption component F (see Sect. 3.2), the existence of molecular gas in the F+G cloud complex is possible.
The origin of the gas on our line of sight is possibly M 82. The absorption velocities are comparable to the ones found by Yun et al. (yun93 (1993)) for the H i tidal tail connecting M 81 and M 82. A recent simulation by Sofue (sofue98 (1998)) indicates that M 82 could have lost its complete disk in an encounter with M 81. If this were so, we would expect processed disk gas in the foreground of M 81, possibly also containing stars. The Sofue scenario could thus explain the metallicities as well as the galaxy disk-like ionisation structure of the gas. We note here, that another stripping event may have taken place in the M 81 group. Walter & Heithausen (walter99 (1999)) found CO gas displaced with respect to the optically well-defined galaxy NGC 3077, i.e., here without indications for associated stars.
Our procedure to derive electron densities in the gas components is based on the average Milky Way disk radiation field. The level of radiation should be different in intergalactic space far away from galaxy disks. Nevertheless, the intergalactic absorption components show signs for ionisation comparable to that in the radiation field of the Galaxy or even larger. Another explanation for the observed level of ionisation could be the presence of a stellar component in the gas, not unrealistic in a scenario of material ripped from M 82 in a close encounter. If M 82 indeed lost its spiral arms, stars could well be present in the intergalactic medium of the M 81 group.
The detection of highly ionised gas in the complex F+G demonstrates that neutral and ionised gas are mixed, very similar to what is seen in QSO absorption line systems. It is unclear, however, just where exactly the ionised gas is situated. It is either in the border region of the hot intergalactic plasma, thermally excited by collisions, or it is gas excited by a radiation source somewhere within the M 81 system.
Acknowledgements.
OM is supported by Deutsche Forschungsgemeinschaft grant Bo 779/24. The data used in this paper were provided by the ESA IUE Final Archive at VILSPA, Spain. We thank the referee for comments which helped to improve the paper.References
- (1) Appleton P.N., Davies R.D., Stephenson R.J., 1981, MNRAS 195, 327
- (2) Appleton P.N., van der Hulst J.M., 1988, MNRAS 234, 957
- (3) Birk G.T., Lesch H., Neukirch T., 1998, MNRAS 296, 165
- (4) Blades J.C., Wheatley J.M., Panagia N., et al., 1988, ApJ 334, 308
- (5) Boggess A., et al., 1978, Nat 275, 372 and 377
- (6) Bowen D.V., Roth K.C., Blades J.C., Meyer D.M., 1994, ApJ 420, L71
- (7) Bregman J.N., 1980, ApJ 236, 577
- (8) Brouillet N., Baudry A., Combes F., Kaufman M., Bash F., 1991, A&A 242, 35
- (9) Brouillet N., Henkel C., Baudry A., 1992, A&A 262, L5
- (10) Cottrell G.A., 1977, MNRAS 178, 577
- (11) de Boer K.S., Savage B.D., 1980, ApJ 238, 86
- (12) de Boer K.S., Koppenaal K., Pottasch S.R., 1973, A&A 28, 145
- (13) de Boer K.S., Jura M.A., Shull J.M., 1987a, in: Scientific Accomplishments of the IUE, ed. Y.Kondo, Reidel Publ. Comp., p. 485
- (14) de Boer K.S., Richtler T., Savage B.D., 1987b, in: ESO Workshop on SN 1987A, ed. I.Danziger, ESO, Garching, p. 549
- (15) de Boer K.S., Rodriguez Pascual P., Wamsteker W., et al., 1993, A&A 280, L15
- (16) Fransson C., Grewing M., Cassatella A., Panagia N., Wamsteker W., 1987, A&A 177, L33
- (17) Freedman W.L., Hughes S.M., Madore B.F., et al., 1994, ApJ 427, 628
- (18) Garhart M.P., Smith M.A., Levay K.L., Thompson R.W., 1997, IUE NASA Newsletter 57
- (19) Génova R., Molaro P., Vladilo G., Beckman J.E., 1990, ApJ 355, 150
- (20) Kulkarni S.R., Heiles C., 1987, in: Interstellar Processes, eds. D.J.Hollenbach, H.A.Thronson, ASSL Vol. 134, Reidel Publ. Comp., p. 87
- (21) Kuntz K.D., Danly L., 1996, ApJ 457, 703
- (22) McKee C.F., Ostriker J.P., 1977, ApJ 218, 148
- (23) Morton D.C., 1991, ApJS 77, 119
- (24) Nussbaumer H., Storey P., 1986, A&AS 64, 545
- (25) Péquignot D., Aldrovandi S.M.V., 1986, A&A 161, 169
- (26) Rots A.H., 1975, A&A 45, 43
- (27) Sargent W.L.W., Young P.J., Boksenberg A., Carswell R.F., Whelan J.A.J., 1979, ApJ 230, 49
- (28) Savage B.D., de Boer K.S., 1981, ApJ 243, 460
- (29) Savage B.D., Jeske N.A., 1981, ApJ 244, 768
- (30) Savage B.D., Sembach K.R., 1991, ApJ 379, 245
- (31) Savage B.D., Sembach K.R., 1996, ARAA 34, 279
- (32) Savage B.D., Jenkins E.B., Joseph C.L., de Boer K.S., 1989, ApJ 345, 393
- (33) Savaglio S., 1998, AJ 116, 1055
- (34) Sembach K.R., Savage B.D., Shull J.M., et al., 2000, ApJ 538, L31
- (35) Shull J.M., van Steenberg M., 1982, ApJS 48, 95
- (36) Sofue Y., 1998, PASJ 50, 227
- (37) Turnshek D.A., Weymann R.J., Williams R.E., 1979, ApJ 230, 330
- (38) Vladilo G., Centurión M., 1994, A&AS 105, 421
- (39) Vladilo G., Centurión M., de Boer K.S., et al., 1993, A&A 280, L11
- (40) Vladilo G., Centurión M., de Boer K.S., et al., 1994, A&A 291, 425
- (41) Wakker B.P., 1991, A&A 250, 499
- (42) Walter F., Heithausen A., 1999, ApJ 519, L69
- (43) Wamsteker W., Rodrigues P.M., Gonzales R., et al., 1993, IAU Circ. 5738
- (44) Witt A.N., Johnson M.W., 1973, ApJ 181, 363
- (45) Welty D.E., Frisch P.C., Sonneborn G., York, D.G., 1999, ApJ 512, 636
- (46) Yanny B., York D.G., 1992, ApJ 391, 569
- (47) York D.G., Dopita M., Green R., Bechtold J., 1986, ApJ 311, 610
- (48) Young P.J., Sargent W.L.W., Boksenberg A., Carswell R.F., Whelan J.A.J., 1979, ApJ 229, 891
- (49) Yun M.S., Ho P.T.P., Lo K.Y., 1993, ApJ 411, L17