Environmental effects on Gas and Galaxy Evolution in Clusters
Abstract
The cluster environment is the site of important transformations in galaxies at a relatively recent cosmological epoch: the galactic morphological types and star formation activity have evolved significantly during the last few Gyrs. How is this related to the galactic gas content? The first part of this paper briefly presents the optical observations of galaxies in distant clusters, while the second part focuses on the link between the H i content and the star formation activity, presenting the results of a multiwavelength study of the cluster A2670 (z=0.08) where 42 galaxies have been detected in H i. We show the star formation properties of the H i-normal and H i-deficient galaxies and discuss their dependence on the location within the cluster. Finally, we compare A2670 with clusters at intermediate redshift and with the Coma cluster.
Oss. Astron., vicolo dell’Osservatorio 5, 35122 Padova, I
Dep. of Astron., Columbia University, New York, NY 10027
1. Galaxy evolution in clusters at optical wavelengths
Galaxy evolution in clusters has some interesting characteristics:
a) it is rapid, because significant evolution is observed already between and ;
b) it mainly involves disk galaxies. As we will discuss, most of the action is taking place in spiral and S0 galaxies while not much happens to the bulk of the ellipticals except passive evolution, at least up to .
c) from the optical point of view two types of galaxy evolution are observed: a transformation of the galactic morphologies (i.e. Hubble types) and a change in the star formation activity, therefore the stellar population content.
Most of the distant cluster work presented in this section is a result of the MORPHS collaboration (involving W. Couch, A. Dressler, R. Ellis, A. Oemler, B.M. Poggianti and I. Smail) that studied 10 rich clusters at using WFPC2-HST imaging and ground-based optical spectroscopy (Smail et al. 1997, Dressler et al. 1999 [D99]).
1.1. Morphological evolution
The relative frequency of the various Hubble types evolves with redshift. Roughly speaking, spirals are a factor of 2 to 3 more abundant at than at , while S0 galaxies are proportionally less abundant in the distant clusters (Dressler et al. 1997 [D97]). Hence, a large number of the S0 galaxies we observe in clusters today seem to have evolved from the numerous spirals observed at (see also Fasano et al. 2000 [F00]). In contrast, the fraction of ellipticals at is already as large or larger than in the nearby universe (D97). Furthermore, many of the spirals have disturbed morphologies, in some cases due to an obvious interaction/merger.
The morphology-density relation changes with redshift as well: at low z it was found to be valid in all types of clusters (Dressler 1980), while at higher redshift a qualitatively similar relation exists only in centrally concentrated clusters and is absent in low-concentration ones (D97, F00).
1.2. Stellar population evolution
The first evidence for strong evolution of the stellar populations came from photometric data and was uncovered by Butcher & Oemler (1984), who found an excess of blue galaxies in clusters at . The large number of spectra now available has allowed to study the star formation histories of the cluster galaxies in greater detail (Poggianti et al. 1999 [P99]).
| Type | [Oii] | Comments | Distant | Distant | A2670 | |
|---|---|---|---|---|---|---|
| Å | Å | clusters | field | |||
| Non star-for.: | ||||||
| k | absent | passive, elliptical-like | 0.480.04 | 0.300.07 | 0.730.08 | |
| k+a | absent | post-SB/post-starfor. | 0.210.02 | 0.060.03 | 0.080.03 | |
| =E+A | ||||||
| Spiral-like: | ||||||
| k(e) | weak | early-spiral like | see e(c) | see e(c) | see e(c) | |
| e(c) | moderate | spiral-like | 0.140.02 | 0.290.06 | 0.160.04 | |
| Starbursting: | ||||||
| e(a) | weak-mod. | dusty SB | 0.110.02 | 0.110.04 | 0.00 | |
| e(b) | any | 40 | SB w. strong emi. lines | 0.050.01 | 0.160.05 | 0.020.01 |
Galaxies in distant clusters show a large variety of spectral characteristics (D99, see Table 1), namely:
– totally passive spectra without signs of current or recent star formation, that resemble those of nearby ellipticals (k-type).
– post-starburst/post-starforming galaxies with no ongoing star formation, that were forming stars at some time during the last Gyr. These are known as “E+A” galaxies, and will be called “k+a”’s in this paper;
– spectra of star-forming galaxies that resemble those of normal, quiescent nearby spirals (e(c) type);
– starburst galaxies (e(b) and e(a) types). The e(a) spectra are characterized by a peculiar combination of spectroscopic features (Table 1) and have been proposed to be spectra of starburst galaxies that are highly obscured by dust (P99, Poggianti & Wu 2000). It is important to note that by definition the difference between e(a) and k+a galaxies is the presence of the [OII] emission. Neverthless, it is possible that some of the k+a’s are extreme e(a) galaxies in which the [OII] line is totally extincted by dust (Smail et al. 1999, see also Owen’s contribution in these proceedings).
The fraction of galaxies as a function of the spectral class are given for the MORPHS clusters and field in Table 1 (P99). In clusters at , we observe a large fraction of k+a galaxies (21% of the total cluster population) and globally a much higher proportion (30%) of star-forming galaxies than at , of which about 1/3 are dusty starbursts (10%). Post-starburst galaxies are much more frequent in the distant cluster environment (21%) than in the distant field (6%), while the proportion of star forming galaxies is higher in the field and dusty starburst spectra are present in both environments with a similar incidence (11%).
Comparing the morphological and spectral classifications, the majority of Es and S0s have stellar populations that are old, passively evolving (k type), while most of the post-starburst and of the star-forming spectra belong to spiral galaxies. Overall, the star formation properties of the spirals are quite surprising: only 10% of them have spectra similar to nearby field spirals, about 20% are starbursting and the majority (%) are not currently forming stars, being either k+a or k types.
These results are consistent with field spirals/groups infalling into the clusters and having their star formation rate truncated by some mechanism related to the cluster environment, and then turning into S0s at some later time. The fact that most of the k+a spectra belong to galaxies that are still classified as spirals indicates that the process responsible for halting the star formation must not affect the morphology, or at least not on the same timescale. A process acting only on the gas content of an infalling galaxy – such as an ICM-ISM interaction – is therefore a good candidate for producing k+a spiral galaxies (see Bower’s and Vollmer’s contributions in these proceedings).
Finally, it is important to note that – although the most obvious effect of the cluster environment is the halting of the star formation (k+a galaxies) – these results do not exclude that at the same time the cluster could provoke an enhancement of SF in some subset of galaxies.
2. A multiwavelength study of Abell 2670
The physical mechanism, or mechanisms, responsible for the observed evolution still need to be identified. The H i information can be very valuable in discriminating among the candidate processes because it can provide the link between the evolution of the morphologies/star formation and the gas content and can aid reconstructing the building history of the cluster.
We and a number of other collaborators are carrying out an H i+optical study of 20 clusters out to z=0.2; here we present the results of the first of these clusters, Abell 2670, obtained in collaboration with K. Dwarakanath, R. Guhathakurta, A. Shambrook, R. Sharples. Abell 2670 is a rich cluster at z=0.08 which at first sight appears a relaxed, dynamically evolved cluster from the optical and the X-ray data. However, the cD galaxy has a large offset from the cluster mean velocity and there is evidence for substructure from a statistical analysis of the redshift catalog which shows the presence of at least 2 and probably 3 subsystems merging almost along the line of sight (Bird 1994).
Our group has acquired VLA H i imaging, CTIO UBVRI wide-field imaging and Keck images of selected areas of A2670 and has analyzed optical spectra from Sharples et al. (1988) and ROSAT archive images (Hobbs & Willmore 1997). The VLA imaging consists of 3 pointings,, mapping the entire volume of the cluster and covering the whole velocity space of cluster members over an area 5 Mpc by side down to a limit of of H i. The VLA data also provide as a by-product radio continuum information.
We begin by comparing in Table 1 the star formation properties of A2670 with those of the MORPHS clusters for galaxies down to the same absolute magnitude. The two main differences are that k+a galaxies are much less abundant and that e(a) spectra are missing among the luminous galaxies of A2670.


The total H i image is presented in Fig. 1 (left panel), where the 42 H i detections are shown as contours. A group of very rich H i galaxies with H i masses up to more than is visible in the north-east region. This group has a small velocity dispersion and its mean velocity is higher than the cluster mean and close to the velocity of the cD galaxy. This appears to be a subsystem that hasn’t gone through the cluster centre yet. There are somewhat sparser H i detection SW and there are no H i detections within the central 250 kpc. This lack of detections in the core is not due to the morphology-density relation, because in this region of the cluster there are at least 5 bright spirals of types Sb or later that fall within the H i velocity range and yet are undetected.
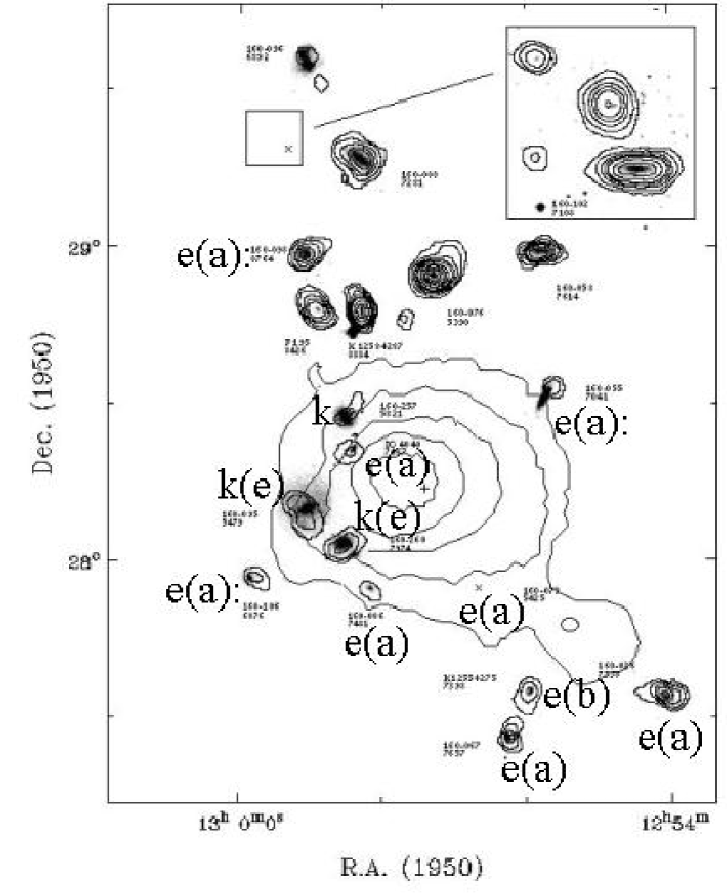
The H i image of the central is presented in Fig. 2 (right panel) together with the ROSAT contours and the spectral types of the H i galaxies. The six galaxies in projection closest to the cluster centre have asymmetric H i distributions and in some cases the H i is displaced from the optical. Their H i masses are in the range . The star formation properties of these galaxies show a bimodal behaviour: 2 of them are starbursts (optically faint e(b) and e(a)) while the other 4 are rather passive (k and k(e) types). None of them has a vigorous, spiral-like star formation (e(c) type). In contrast, the H i-rich group at NE comprises many e(c) and k(e) types, as one would expect for a group of field galaxies composed of early and late type spirals.
It is worth noticing the existence of a population of k-type, yet gas rich galaxies. Their spectral classification is confirmed by their red colors as shown in Fig. 1 (right panel). This figure shows that in general there is a good correlation between the spectral type and the color, with the k, k(e), e(c), e(a) and e(b) types becoming progressively bluer.
Among the H i detections there aren’t any secure k+a galaxies and this is consistent with the post-starburst/post-starforming galaxies being devoid of significant amounts of neutral gas. K+a galaxies are also undetected in radio-continuum: out of the 23 cluster members with radio continuum emission, 17 have spiral-like star formation (e(c)’s) and 6 are totally passive (k’s).
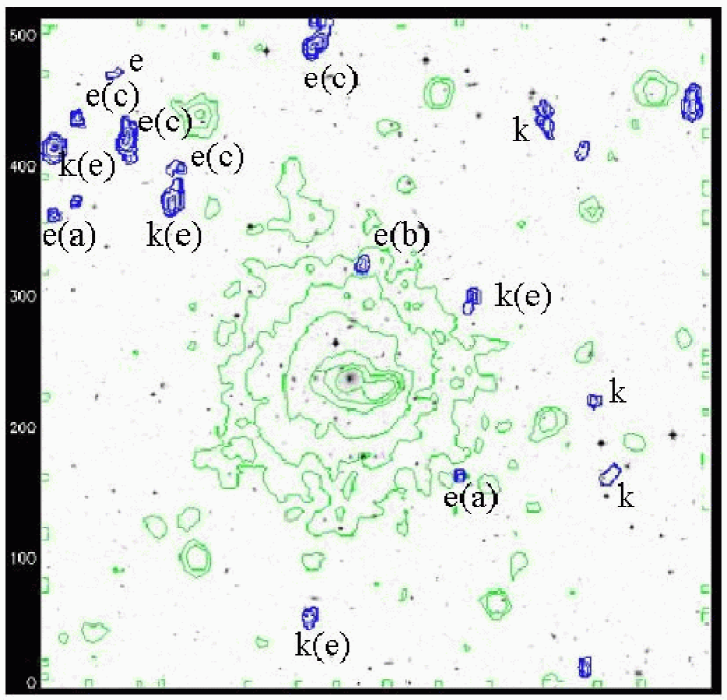
It is interesting to contrast the results of A2670 with those of the Coma cluster, in which Bravo-Alfaro et al. (2000) have carried out a detailed H i imaging study of 19 spirals (see also Bravo-Alfaro et al. in these proceedings) finding that the H i properties of the cluster galaxies are strongly correlated with the projected distance from the cluster centre. The most strongly H i-deficient galaxies are located roughly within the extent of the central X-ray emission and show asymmetries in the H i distribution and often a shift between the optical and the H i position. Surprisingly, in Coma most of the H i-detected galaxies with disturbed H i morphology – which are likely to be currently interacting with the ICM – have e(a) spectra (Fig. 2, left panel). Those that are not dusty starbursts are rather passive (1 k and 2 k(e) types).
The H i and optical data together are consistent with clusters accreting groups of galaxies that have both their gas content and their SF properties altered by the impact with the X-ray IGM. H i-detected galaxies in the outskirts of A2670 – those undisturbed in their H i content and morphology – have SF properties typical of field spirals, while both in A2670 and in Coma those galaxies that still retain some gas – but appear to be already affected by the cluster environment in their H i content – are either passive or starbursting with significant amounts of dust. The relative proportions in the two clusters are different: Coma has numerous starbursts among the H i-disturbed galaxies while A2670 has mostly passive spectra, as if Coma has been “caught in the act” and A2670 is seen after/before an infalling group begins to be affected by the ICM. This is suggestive of a SF enhancement due to the interaction with the IC gas in Coma.
Here we have presented an H i-optical comparison of two low-z clusters. In the nearby universe we are observing the tail of evolutionary processes that are prominent in clusters at slightly higher redshift, hence it will be extremely interesting to study the H i content in more distant clusters, at z=0.2 and beyond, where the populations of infalling star-forming galaxies are a significant fraction of the global cluster population.
References
Bird, C., 1994, ApJ, 422, 480
Bravo-Alfaro, H., Cayatte, V., van Gorkom, J.H., Balkowski, C., 2000, AJ, 119, 580
Butcher, H., Oemler, A., 1984, ApJ, 285, 426
Dressler A., Oemler A., Couch W.J., Smail I., Ellis R.S., Barger A.J., Butcher H., Poggianti B.M., Sharples R.M., 1997, ApJ, 490, 577
Dressler A., Smail I., Poggianti B.M., Butcher H., Couch W.J., Ellis R.S., Oemler A., 1999, ApJS, 122, 51
Fasano G., Poggianti B.M., Couch W.J., Bettoni D., Kjærgaard P., Moles M., 2000, ApJ, in press (astro-ph 0005171)
Hobbs, I.S., Willmore, A.P., 1997, MNRAS, 289, 685
Poggianti B.M., Smail I., Dressler A., Couch W.J., Barger A.J., Butcher H., Ellis R.S., Oemler A., 1999, ApJ, 518, 576
Poggianti B.M., Wu, H., 2000, ApJ, 529, 157
Sharples, R.M., Ellis, R.S., Gray, P.M., 1988, MNRAS, 231, 479
Smail, I., Dressler, A., Couch, W. J., Ellis, R. S., Oemler, A. Jr, Butcher, H., Sharples, R. M., 1997, ApJS, 110, 213
Smail, I., Morrison, G., Gray, M.E., Owen, F.N., Ivison, R.J., Kneib, J.-P., Ellis, R.S., 1999, ApJ, 525, 609