The Chemical Evolution of the Universe I:
High Column Density Absorbers
Abstract
We construct a simple, robust model of the chemical evolution of galaxies from high to low redshift, and apply it to published observations of damped Lyman-alpha quasar absorption line systems (DLAs). The elementary model assumes quiescent star formation and isolated galaxies (no interactions, mergers or gas flows). We consider the influence of dust and chemical gradients in the galaxies, and hence explore the selection effects in quasar surveys. We fit individual DLA systems to predict some observable properties of the absorbing galaxies, and also indicate the expected redshift behaviour of chemical element ratios involving nucleosynthetic time delays.
Despite its simplicity, our ‘monolithic collapse’ model gives a good account of the distribution and evolution of the metallicity and column density of DLAs, and of the evolution of the global star formation rate and gas density below redshifts . However, from the comparison of DLA observations with our model, it is clear that star formation rates at higher redshifts () are enhanced. Galaxy interactions and mergers, and gas flows very probably play a major rôle.
1 Introduction
Observational studies of the formation and evolution of galaxies are making great strides forward. Unfortunately, understanding of the wide range of physical processes involved in this key astrophysical problem is far from complete. There is a pressing need for a simple yet robust framework in which to interpret the new observations.
The prevailing view is that galaxies form in dark matter halos that trace primordial density fluctuations, but subsequent mergers, gas flows and star formation certainly play an important role in galaxy evolution. Great efforts have been made in the ‘semi-analytic’ approach to modelling galaxy evolution, as summarised by [\astronciteBaugh et al.1998]. This sophisticated technique uses statistical methods to follow the growth of dark matter halos, and physically motivated rules to describe the gaseous and stellar processes within them. Ab initio calculations of galaxy evolution in hierarchical cosmological models are constrained by local galaxy luminosity functions, enabling statistical and cosmological predictions such as galaxy survey redshift distributions, and the cosmic star formation history, to be made.
Our approach is different. We have produced a simple, robust model for galaxy formation and evolution intended to meet the constraints of the observed chemical evolution of the Universe. In particular, in this paper we investigate the detailed gas phase abundances of quasar damped Lyman absorption line systems (DLAs) to – (defined as those with neutral hydrogen column densities above ). We improve upon elementary global calculations (e.g. [\astroncitePei and Fall1995, \astronciteEdmunds and Phillipps1997]) by modelling the enrichment of gas in separate gravitational potential wells. We adopt as far as possible the ‘best’ descriptions of the different physical processes involved, based upon reliable observations and theory. Our eventual aim is to predict the outcome of future observations – particularly in the IR and submm, with very large telescopes and adaptive optics – that will allow chemical analysis of directly detected individual galaxies or galaxy fragments at high redshifts.
The DLA systems have been linked to proto-galactic clouds ([\astronciteWolfe et al.1986]), low surface brightness galaxies ([\astronciteJiménez et al.1999]), the outer regions of galactic disks ([\astronciteBergeron1986, \astronciteBergeron and Boissé1991, \astronciteSteidel1995]), sub-galactic star forming regions, and dwarf galaxies ([\astronciteYanny and York1992]). DLAs are currently known at redshifts , which probably spans the era of major galaxy formation, and have observed HI column densities up to . We do not attempt to address the precise nature of the absorbers, but treat them as clouds of gas (with associated stars and dust) irrespective of what kind of (proto)-galaxy they may represent. We have compiled a database of redshifts, HI column densities and abundances of all the DLA systems with published measurements. We have produced synthetic surveys for overall statistical comparisons, and models of individual systems, and hence predicted directly observable system properties.
The layout of this paper is as follows. In § 2, we outline our initial model for the formation and evolution of the galaxy systems, using the Simple chemical evolution model. In § 3, we discuss the dust optical depth, and add a simple representation of galaxy internal structure to our model, in the form of exponential disk gradients in stars, gas, metallicity and dust. In § 3, we consider the opacity of galaxies and possible effects upon the quasar optical surveys. In § 5, we use the Holmberg relation for galaxy luminosity and size to make a preliminary calculation of the evolution of the galaxy population as a whole. In § 6, we compare detailed model predictions with observations of DLAs, including the chemical evolution of individual elements, and study other relevant data such as the properties of Local Group dwarf galaxies, and the star formation history of the Universe. In § 7, we take a critical look at the limitations of our initial model, and how these might affect our conclusions. In § 8, we summarise our conclusions. (Unless otherwise stated, our calculations assume with , and .)
2 A Galaxy Chemical Evolution Model
We wish to focus upon chemical evolution, and so we construct a simple, yet physically reasonable model of a galaxy, without imposing particular structural or dynamical properties. We consider a spherically symmetric cloud of gas which, at a redshift determined by its density, breaks away from the Hubble flow and collapses to form a gravitationally bound system. Given a redshift, the density required for a region to collapse is ([\astroncitePeebles1993])
| (1) |
where the density contrast over the mean background density , and is the mass density of the Universe (for cosmologies with ). Guided by detailed 3D numerical self-gravitating hydrodynamical calculations of the formation of galactic systems (e.g. [\astronciteChurches1999]), we assume that the cloud collapses by a factor of 10 from an initial radius over a free-fall time, halting at and evolving at constant radius thereafter. The free-fall time of the cloud, is
| (2) |
where is the density of the cloud as it breaks away from the Hubble flow at the turnaround redshift, . The radius of the cloud, , is given (for ) by
| (3) |
We model clouds with total gravitational mass in the range . We fix the baryonic fraction to be universally , so that each cloud contains dark, non-baryonic mass which does not form stars, nor contribute to the gas column density. For clouds of uniform density, the initial cloud radius (at the onset of collapse) is therefore a known function of cloud mass and the turnaround redshift (Eqn 1).
We use a Schmidt star formation law ([\astronciteSchmidt1959]), with the star formation rate a power-law function of , the gas volume density, given by
| (4) |
where is the volume star formation density, and and are constants which determine the star formation efficiency. Kennicutt has shown that such prescriptions are a good representation of star formation over a wide range of physical conditions in present-day galaxies ([\astronciteKennicutt1988, \astronciteKennicutt1998]). We fix the slope at a convenient value, , guided by Kennicutt’s prefered slope . We fix the absolute efficiency , which gives reasonable present-day gas/star mass ratios across a range of initial model galaxy cloud masses (confirmed by detailed self-consistent numerical galaxy models ([\astronciteChurches1999])). The star formation rate in all our calculations therefore varies only as a function of the gas density.
The total baryonic mass of the model galaxy cloud is . Initially, just after turnaround, the cloud baryonic mass is purely gas, so the mass of gas in the cloud , and the mass of stars, . Star formation proceeds during collapse and subsequent galaxy evolution and we assume that a fraction, , of the gas which is consumed by star formation remains in long-lived stars and stellar remnants. Therefore, the rate of change of the mass in stars is given by
| (5) |
at all times. Substituting for the volume star formation rate, , from Eqn 4, and the current radius of the cloud, , from Eqn 3 and noting that we find
| (6) |
for the cloud collapse phase, and
| (7) |
for the constant radius cloud evolution phase, where is the initial volume of the model galaxy cloud. Both these equations may be solved explicitly to give
| (8) |
and
| (9) |
for the collapse and constant radius phases respectively, where is the time since the end of the collapse phase.
2.1 Chemical Evolution: Testing the Model
The fundamental aim of this work is to make testable predictions about the chemical evolution of galaxies at high redshift, and in the first instance, to understand the properties of high column density (damped Lyman alpha) quasar absorption line systems. Therefore, we need to calculate the basic observable properties of galaxies which appear as DLAs. These are: the absorption redshift , the gas phase metallicity, (mass fraction of metals in the interstellar medium) and the column density in neutral hydrogen, , in the ISM. The absorption redshift is simply determined by the turnaround redshift of the model galaxy cloud, its age, and the cosmology. We can also readily calculate an average metallicity and column density for any cloud.
The metallicity can be estimated from the Simple Model of ‘closed box’ chemical evolution ([\astroncitePagel1997]). The standard Simple result is that the metallicity, , follows the relation
| (10) |
where is the yield (the mass of heavy elements in the processed gas returning from stars to the ISM per mass locked up in long-lived stars and stellar remnants), and is the fraction of baryons in gas (hereafter, the ’gas fraction’). Throughout our calculations, we assume a constant, uniform heavy element yield, .
The column density of neutral hydrogen, can then be estimated from the cloud gas mass (allowing for primordial helium, and assuming a typical cloud size ) as , giving
| (11) |
where is the mass of a hydrogen atom. This is an upper limit, since molecular hydrogen will form in the densest regions, and there will be some ionisation.
We now have a basic framework of galaxy formation and evolution, and in particular, a robust formalism to study the chemical enrichment history of any given model galaxy cloud. We next need to study the dust optical depths that can be expected (§ 3) (which may affect quasar surveys (§ 4.1)), and to allow for internal structure within our galaxy clouds (§ 3.2).
3 Gradients and Dust
A significant fraction of the heavy elements in our Galaxy are locked up in the solid phase, particularly as small dust grains in the ISM. We can predict the evolution in the opacity of our model clouds due to absorption by these grains, , in terms of and gas fraction, . If a cloud is to be detected as a DLA, we must first detect the background quasar, often in a survey at blue wavelengths; the dust must not redden and obscure the quasar beyond survey and spectroscopic magnitude limits ([\astroncitePei and Fall1995]).
3.1 Average Dust Opacity
The optical depth of a cloud due to dust where is the typical grain absorption cross-section ( is a typical grain radius) and is the column density of dust grains. For a typical line of sight, the column density of dust , where is the number density of grains and is the characteristic size of the cloud. Therefore, the dust optical depth can be estimated from the assumed typical grain properties, and global cloud properties
| (12) |
If is the total mass of dust in the cloud then we can write ([\astronciteEdmunds and Eales1998], using our symbols) , where is the mass fraction of metals in the gas phase, is the fraction of metals which have condensed into dust and is the cloud gas mass. We can also write , where is the volume of the cloud; if the typical density of a dust grain is then the typical mass of a dust grain is . Therefore, equating our two expressions for ,
| (13) |
Thus, combining Eqn 13 with the expression for dust opacity (Eqn 12), and using the relationship between gas fraction and metal mass fraction for the Simple Model (Eqn 10), the optical depth due to dust may be written as
| (14) |
The cloud gas mass and column density are related by Eqn 11 so we can eliminate cloud gas mass in the expression for optical depth (Eqn 14). The typical dust optical depth in a model galaxy cloud is therefore
| (15) |
Theoretically, we calculated the gas fraction, , and hence, the column density, . Observationally, we measure column density and the metallicity. We can therefore use Eqn 15 to infer average dust opacities for model galaxy clouds and observed systems, if we make some assumptions about the properties of the dust. Our knowledge of the Galaxy suggests that taking as representative values (the fraction of metals in dust), (the local stellar yield, ), (the radius of a typical ‘classical’ dust grain) and . With these values, the typical dust optical depth of a cloud is
| (16) |
where . This prescription indicates that a model galaxy cloud representative of our Galaxy, with a gas fraction and an HI column density given by will have a average dust optical depth, . It is possible that the fraction of heavy elements locked up in dust in the ISM () is a function of galaxy evolution, but initial estimates suggest that this is not a significant effect for purposes of the present calculation ([\astronciteEdmunds2001]).
3.2 Gradients
Our calculations so far have implicitly assumed that the dust is uniformly distributed. We now allow for radial exponential gas, metallicity and opacity gradients, as found in disk galaxies.
We assume that the metallicity distribution does not vary azimuthally, and that can be parameterised as , where is the central metallicity of the disk and the slope, dex/scalelength ([\astronciteGarnett1998]). Equivalently,
| (17) |
where is the stellar exponential scalelength of the disk. We calibrate using the Galactic measurement at the Solar circle, kpc. Then, if is the absolute blue magnitude of the Galaxy, the central metallicity of a galaxy with absolute blue magnitude , is
| (18) |
For a typical galaxy, the neutral hydrogen is also distributed in an exponential disk, and the HI scalelength and the stellar scalelength are roughly the same: kpc. Then and the opacity gradient is therefore (from Eqn 15)
| (19) |
The central HI column density, and opacity, are uncertain because conversion to molecular hydrogen may promote the formation of dust, especially in cooler regions ([\astronciteValentijn and van der Werf1998]). Substituting in numerical values as in the previous section and normalising to the column density at one scalelength (meaning that cm-2) gives
| (20) |
where the column density measure, is directly calculated in our model. This relation predicts an average optical depth at the Solar circle in our Galaxy of , which is again consistent with azimuthal averages in external galaxies ([\astronciteDomingue et al.1999], [\astronciteKuchinski et al.1998]).
4 Line-of-sight Optical Depth
The analysis of galaxy opacity gradients presented above suggests that, for a present-day galaxy, the disk optical depth becomes low enough to allow the detection of an underlying quasar in typical optical surveys at disk scalelengths; hence of the disk surface area will be ‘optically thick’ to quasars (see § 4.1). We can therefore set an upper limit on the fraction of the sky which is covered by the optically thin regions of disk galaxies. The probability that a random line of sight passes through a given region of a galaxy varies with redshift as
| (21) |
where is the number density of galaxies, and is the geometric cross-section of the relevant region of the galaxy ([\astroncitePeebles1993]). In general, and will be (probably decreasing) functions of redshift, but to determine a firm upper limit, we can assume that and are constant in redshift. In an Einstein-de Sitter universe, , and so the probability that a random sightline intersects the outer regions of a galaxy where there is insufficient dust to obscure an quasar, yet sufficient neutral hydrogen to give rise to a DLA is
| (22) |
We take ([\astronciteBinney and Merryfield1998]). From our opacity gradient calculations ( 3.2), the optically thin cross-sectional area of a typical face-on disk is . Therefore, our firm upper limit on the probability of a line of sight intersecting such a region is , for a quasar at an emission redshift . Of all the quasars that have been discovered, of quasars which have been spectroscopically surveyed have damped absorption features ([\astronciteWolfe et al.1995]). This very simple analysis would therefore suggest that all DLAs are caused by the outer regions of galaxies. How is this conclusion affected by our a priori assumptions? We have assumed that all galaxies are oriented face-on, which gives an upper bound to the optically thin cross-section. Implicit in the above reasoning is the assumption that the population of quasars forms a shell at high redshift (e.g. ), maximising the intersection probability. We assume no evolution in the number density of the disk population, but if the epoch of disk formation falls at , the number density at earlier times will be lower. All these factors lead to overestimation of the probability of intersection. Hence, the covering fraction on the sky of suitable regions of galaxies (optically ‘thin’, ‘high’ ) is probably insufficient to explain the frequency of DLAs. The DLA progenitors are probably a heterogeneous population, with some absorption features forming in the outer regions of galaxies, but others forming, for example, in the central regions of dwarf galaxies, or in low surface brightness galaxies.
4.1 Quasar Selection Biases
Intervening galaxies with the dust properties discussed above (§ 3) may cause selection effects in quasar and DLA surveys. These effects will depend upon quasar survey wavelengths and magnitude limits, and upon spectroscopic follow-up magnitude limits, and upon the density and luminosity distribution of quasars.
The form and evolution of the luminosity function of optically selected quasars is quite well known. The shape of the quasar optical luminosity function (QOLF) can be well parameterised as a double power-law ([\astronciteBoyle et al.1988]; see Fig 1a). The optical QLF has just one characteristic feature, the ‘knee’ , which enables us to distinguish between luminosity and density evolution in the quasar population. The QOLF moves monotonically towards higher luminosity as a power law in redshift, , where the evolution parameter is (see recent determinations by [\astronciteFranca and Cristiani1997, \astronciteMaloney and Petrosian1999], and Fig 1b). Interestingly, this intrinsic brightening of the characteristic quasar rather closely balances the effects of cosmological dimming (Fig 1c).
[INSERT FIGURE 1 HERE]
The QOLF is calculated from quasars discovered in magnitude-limited blue surveys (e.g. the LBQS, [\astronciteHewett et al.1995]). Quasar numbers are dominated by those fainter than the characteristic luminosity at all redshifts. The level of foreground obscuration which will dim an quasar below the typical survey magnitude limit is subject to uncertainties in the adoption of cosmological and quasar evolution models. However, for median values of all the parameters, in the redshift range it would take foreground extinction of only to push an quasar below an apparent magnitude limit (Fig 1d).
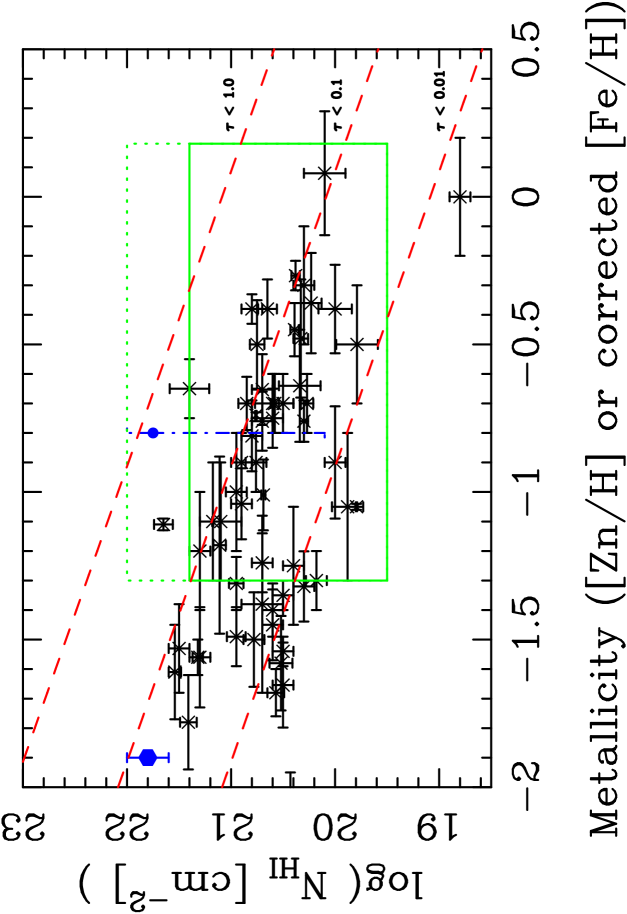
In Fig. 2, we compare the typical opacities calculated from metallicity and HI column density in § 3.1 with observed properties of DLAs and nearby galaxies. The majority of known DLAs have , which will not cause a significant number of quasars to be lost from optical quasar surveys. However, it is intriguing to note that the DLA data points cluster along a line of constant opacity, approximated . Despite other existing evidence to the contrary (e.g. Ellison et al. (in preparation), and see § 6.2.1, the simplest interpretation of this analysis is that many DLAs do exist with higher opacities, but are missing from our catalogues because they obscure background quasars beyond optical quasar survey magnitude limits.
[INSERT FIGURE 2 HERE]
5 The Evolution of the Galaxy Mass Distribution
To make statistical statements about the DLA population, we need to understand the form and evolution of the mass function of galaxies. In our model, the metallicity evolution of a galaxy is only a function of its turnaround redshift, which uniquely determines the gas density (Eqn 1). To break this degeneracy, we need a relationship between mass (or equivalently, radius), and turnaround redshift. We can obtain such a relationship (following [\astroncitePhillipps and Edmunds1996]), from the Holmberg radius-luminosity relation ([\astronciteHolmberg1975]):
| (23) |
where is the Holmberg radius, is the luminosity, and the parameter . Assuming a constant mass-to-light ratio, the Holmberg relation implies a mass-radius relation ( is a constant, is the initial cloud radius) and hence a mass-density relation. We can therefore calculate the (unique) turnaround redshift for each galaxy mass. Since we are not including galaxy mergers in this calculation, and we know the present day galaxy luminosity function, we can construct a history of galaxy formation in the universe. Large numbers of low mass dwarf galaxies form first, with higher mass galaxies forming at progressively lower redshifts in ever decreasing numbers.
We can substitute our mass-radius relation into the expression for the turnaround redshift (Eqn 1), and re-arrange to obtain mass as a function of turnaround redshift:
| (24) |
The overall present-day space density of galaxies of mass in mass interval is well modelled by the Schechter luminosity function
| (25) |
where and are the characteristic galaxy number density and mass, respectively. The amount of mass per co-moving unit volume bound up in galaxies which form at a given redshift is given by
| (26) |
Unfortunately, this result is extremely sensitive to the slope, , chosen for the Holmberg relation (Eqn 23). A value of produces a universe populated by galaxies that are too young and metal poor, whereas (Holmberg’s own value) produces a universe populated by over-evolved galaxies. The necessity for fine tuning of this parameter is unsatisfactory. Another serious problem is that Holmberg’s original tight correlation between radius and luminosity ([\astronciteHolmberg1975]) is much less convincing in large modern datasets (Gavazzi, private communication). There is considerable scatter, and selection biases which are caused by the difficulty in discriminating between stars and high luminosity compact galaxies on one hand, and insensitivity to low surface brightness galaxies on the other, suggesting that the Holmberg relation may be no more than a selection effect. We may be able to side-step these problems entirely by using the Extended Press-Schechter theory in our galaxy formation models, and including hierarchical galaxy evolution through mergers (see § 7). We will consider this model in our next paper (Baker et al. 2001). Nevertheless, our simpler “Holmberg” model is surprisingly successful in explaining the observed chemical evolution of DLAs, as we now discuss.
6 Observations Confront Theory
We are now ready to confront our preliminary theoretical predictions with the observed properties of damped Ly absorber systems from the literature (e.g. absorption line survey data [\astronciteRao and Turnshek2000, \astronciteStorrie-Lombardi et al.1996a, \astronciteLanzetta et al.1995, \astronciteJunkkinarien et al.1991, \astronciteLanzetta et al.1991, \astronciteWolfe et al.1986], reports of metallicity measurements [\astronciteCenturion et al.2000, \astroncitePettini et al.2000, \astronciteBoissé et al.1998, \astronciteCenturion et al.1998, \astronciteMolaro et al.1998, \astronciteMatteucci et al.1997, \astroncitePettini et al.1997, \astronciteLu et al.1996, \astronciteSmette et al.1995, \astronciteLu et al.1995, \astronciteMeyer et al.1995, \astroncitePettini et al.1995, \astroncitePettini et al.1994, \astronciteMeyer and York1992], and metallicity measurements with 8m-class telescopes [\astronciteOutram et al.1999, \astroncitePettini et al.1999a, \astronciteProchaska and Wolfe1999, \astronciteProchaska and Wolfe1997, \astronciteProchaska and Wolfe1996]) The free parameters of the model clouds are the turnaround or formation redshift (which fixes the density), and the mass of the collapsing halo, which together uniquely determine the initial cloud radius. After commenting upon metallicity indicators (§ 6.1), we will now discuss our simulations of DLA survey data (§ 6.2) in some detail, including (§6.2.2) implied global properties (star formation, gas density). In § 6.3, we examine fits to individual DLAs, then (§ 6.4) briefly compare the properties of DLAs with dwarf galaxies in the Local Group. In § 6.5 then consider the chemical evolution of time-delayed species.
6.1 Gas Phase Metallicity Indicators
Zinc has been considered as a fair and useful indicator of the gas phase metallicity because Zn is measured to follow Fe in Galactic stars, suggesting that Zn might track the stellar nucleosynthesis of Fe in Type Ia supernovae ([\astronciteArnett and Thielemann1985, \astronciteThielemann and Arnett1985]). However, recent measurements in metal poor and thick disk stars find a ratio of [Zn/Fe] ([\astronciteet al.2000]), perhaps consistent with an origin in Type II supernovae ([\astronciteArnett1996]). Whatever its stellar origin, Zn is expected to be far less depleted onto dust grains than Fe ([\astroncitePettini et al.1999b]). Unfortunately, the weakness of the observationally accessible ZnII transitions, whilst circumventing problems of saturation, means that Zn is extremely difficult to measure at ([\astronciteProchaska and Wolfe2000]). Current measurements of DLA abundances show [Zn/Fe], whereas [Zn/Cr], implying depletion factors of 4 and 2 for Fe and Cr respectively if Zn is undepleted. As accurate measurements of [S/Si] become available for DLAs with [Zn/Cr] , it will be possible to test for metallicity-dependent depletions ([\astroncitePettini et al.2000]). In the meantime, we too will use Zn as our primary metallicity indicator.
6.2 Simulated DLA Surveys
The principle observations which we are attempting to explain are the redshifts, column densities and metallicities of DLA systems. To compare our model with these observations, we created artificial surveys of 1000 DLAs, including overall observational selection effects in redshift, column density and metallicity. We consider our model in two simple yet representative cosmologies: the Einstein-de Sitter (EdS; ), and a low density cosmology with , ; and in both cases111We assume that the contributions of matter, cosmological constant and curvature are such that .. We have sampled the model DLA galaxies at random impact parameters along the gas and metallicity radial gradients. The results, in terms of and [Z/H], are summarised in Figures 4 and 6, with the observed data points, and simulated survey number density contours. Absorption redshift is the random input parameter for each model DLA system, and we use the redshift selection function shown in Fig. 3, representing the combined redshift survey path lengths of the DLA surveys of [\astronciteLanzetta et al.1995, \astronciteStorrie-Lombardi et al.1996b] and [\astronciteRao and Turnshek2000]).
It is clear that, in the EdS cosmology, our model is a poor description of the data for redshifts (see Fig. 4), and we will concentrate on our other representative model, the ‘low density’ cosmology, in the rest of this discussion.
[INSERT FIGURE 3 HERE] [INSERT FIGURE 4 HERE]
For HI column density, the observational detection threshold is set at in all statistically complete DLA surveys. For metallicity, the sensitivity limit depends upon HI column density, and there is no uniform Zn equivalent width limit applied to observational surveys. Therefore, we have estimated the effective metallicity selection function from the surveys of Pettini et al. to be [Zn/H] ([\astroncitePettini et al.2000] and references therein; [\astronciteProchaska and Wolfe2000] quote a similar combined limit, that [Zn/H] ). These selection functions are indicated in Fig. 4 as dashed lines, and have been folded into Figs. 5 and 6.
6.2.1 Cumulative distributions
The cumulative distributions of redshift, column density and metallicity for the low density cosmological model are shown in Fig. 5. The smoother line is the distribution of simulated DLA systems and both curves are normalised to show the fraction of ‘surveyed’ systems included up to a given parameter value. The observed and model cumulative redshift distributions agree well.
The column density measurements are subject to a Malmquist type bias, but for the column density distribution function calculated by [\astronciteStorrie-Lombardi et al.1996a] and the existing absorption redshift survey path lengths, , only about one spurious extra DLA system is expected to be scattered into the lowest column density bin. Again, the model and observed column density distributions agree well.
The cumulative metallicity density distributions (Fig. 5c)), show that we have a deficit of low metallicity systems ([Zn/H] ). This may relate to star formation at high redshifts, a point which we return to in § 6.2.2.
The predictions in the low density cosmology are clearly a significantly better representation of the data that those in the EdS cosmology, especially at redshifts where the Zn measurements exist. The well-known observed deficit in high HI column density systems () at high redshifts () is reproduced (Fig. 6a), because the sequence of turnaround redshift in our model is a strict function of galaxy mass. The metallicities are well described by this model, including the lack of strong correlation of metallicity with redshift at the current level of observational accuracy ([\astroncitePettini et al.1997]; our Fig. 6b). Despite our deficit of low metallicity systems, we predict that there are numerous absorbers with metallicities in the range [Zn/H] waiting to be discovered with column densities . We also find that all our model absorbers have internal dust opacity (with below ). This result can be interpreted in two very different ways. Taking our current model at face value, we predict that there are no significant selection effects in optical quasar surveys due to obscuration in foreground galaxies (see § 4.1). However, the current model does not consider interacting, starbursting systems which are expected to have much higher opacity, and which we will examine in a future paper ([\astronciteBaker et al.2001]).
[INSERT FIGURE 5 HERE] [INSERT FIGURE 6 HERE]
6.2.2 Global Properties of the Universe
The evolution of the global properties of the Universe (as previously calculated e.g. by [\astronciteWolfe et al.1995, \astronciteStorrie-Lombardi et al.1996b, \astronciteSteidel et al.1999]) emerge ‘for free’ from our model. The star formation history is shown in Fig. 8, with data points derived from UV observations (as summarised by [\astronciteSteidel et al.1999], without attempted dust corrections) shown for comparison with our independently derived smooth prediction. Our simple model is a remarkably good representation of all the data at redshifts , but the real Universe appears to form more stars more quickly at the earliest observable times. Therefore, we would expect our high redshift () metallicities to underpredict the observations, which indeed they do, as shown in Fig. 7.
[INSERT FIGURE 7 HERE]
Our detailed prediction of the star formation history depends upon the adopted Holmberg relation and star formation parameter values. The observations are at optical and UV wavelengths, which are particularly sensitive to steady, normal star formation or star formation bursts with low dust obscuration, and are strongly biased against heavily dust-embedded star formation, as seen in interacting and starbursting systems. Such embedded stellar energy generation is certainly comparable to that detectable at UV/optical wavelengths ([\astroncitePuget and et al.1996, \astronciteHauser and et al.1998], and may be particularly important at higher redshifts (). Our models do not include any effects of gas inflows, such as those triggered by interactions and mergers of galaxies, which appear to be the driving force behind dust embedded starburst activity. Therefore, it is particularly interesting that the global star formation history of our model (with steady, non-bursting star formation) is broadly similar, for redshifts , to the best UV/optical observations currently available. We compare our calculations to the UV/optical data without the uncertain observational dust reddening corrections, both because these corrections are so uncertain, and because they are likely to be small in UV-bright star formation regions. Galaxy evolution calculations which account for interactions, mergers and gas flows are required to study to true, total star formation history of the Universe.
[INSERT FIGURE 8 HERE]
In Fig. 9, we summarise the evolution of the baryons in our model clouds, as distributed between gas, stars, metals and dust (Fig. 9). Our prediction of the total gas contribution in bound systems (dashed line) is in reasonable accord with the data (points from [\astronciteStorrie-Lombardi et al.1996b]), which are based upon observations of HI in DLAs. Again, the data are consistent with more star formation at .
[INSERT FIGURE 9 HERE]
6.3 Detailed fits to individual DLAs
We now move from broad-brush, statistical comparisons (6.2) to detailed study of individual DLA features. We can only model systems in which the absorption redshift, , the HI column density, and the metallicity ([Z/H], as measured by [Zn/H], or [Fe/H] corrected for [Zn/Fe]) are known. We then take a slice in redshift space though our simulated universe at (the most precisely determined observable) and extract all the galaxies with and [Z/H] which are consistent with the observations. This gives sets of model galaxy parameters, including turnaround redshifts, masses, and impact parameters to the QSO line-of-sight. The results of our galaxy chemical evolution models for each observed DLA yield detailed star formation histories, which can then be used with a stellar spectral synthesis code ([\astronciteBruzual and Charlot2000]) to predict observable galaxy properties at the DLA absorption redshift, and indeed, any other epoch.
We can now select a well-defined sample of DLAs for further observational followup. Of the 63 DLAs with complete (, , [Z/H]) data, we could simultaneously obtain good fits to the observed redshift, column density and metallicity of the DLA galaxy in 18 () cases (i.e. within the quoted (1 ) errors). It is likely that many of the other (unfitted) DLAs have undergone significant bulk gas flows, possibly involving merger-driven star formation events. For those DLAs which we can fit well, the galaxy masses are – , the galaxies are at impact parameters of kpc, and will have apparent magnitudes of . We therefore predict that a large fraction of DLAs are caused by sub- galaxies sitting almost directly in front of the QSO. This prediction implies that the galaxy associated with the absorber Q22331310 () by Steidel and others ([\astronciteSteidel et al.1995, \astronciteDjorgovski et al.1996]), about kpc from the quasar sight line (in the same cosmology as our individual model fits) is either atypical, or is not the true absorber.
For each DLA we can fit well, we have selected up to three candidate model galaxies which bracket the plausible mass distribution, and evolved these from formation to their absorption redshift, using stellar synthesis to estimate key observables such as the galaxy K-band apparent magnitude (in the appropriate cosmology). The predicted galaxy properties for each DLA are summarised in Table 1, with typical uncertainties being kpc in the impact parameter and in the absolute and apparent magnitudes.
[INSERT TABLE 1 HERE]
As would be expected from our galaxy formation prescription, galaxy luminosity is broadly anticorrelated with (absorption) redshift. We predict that some DLA galaxies will be too faint and too close to the quasar to be detectable even with near-IR detectors on 8m telescopes. But there is a small, accessible population with predicted , and kpc at redshifts . The optical–infrared colours are generally moderate (BK 5.5), but up to a third of these DLAs arise in rather red (6 BK 8.5) objects, typically at redshifts .
These results demonstrate the importance of detailed galaxy chemical evolution modelling in the design of large telescope programmes to observe DLAs and galaxies. For example, [\astronciteAragón-Salamanca et al.1996] (AEO) use a 4m-class telescope to image 10 DLA quasars at K, and found two candidate DLA galaxies, towards Q (which has 3 DLA systems) and Q, with and kpc; they set magnitude limits of – for the others. We predict that the true absorbing galaxy towards Q () has a mass , with and impact parameter of only kpc. The closest DLA towards Q is at , and we predict an absorbing galaxy with mass , with and impact parameter of only kpc (the system will be very similar). The other DLAs in the AEO sample are also probably sub- galaxies at small impact parameters, well beyond the apparent magnitude and angular resolution limits of AEO. We therefore do not believe that AEO have (nor could have) detected the true DLA absorbers in the DLAs they studied. Without spectroscopic galaxy redshifts, we can only speculate that the AEO galaxies may be in the same cluster as the true DLA absorbing galaxies.
6.4 Local Group dwarf galaxies
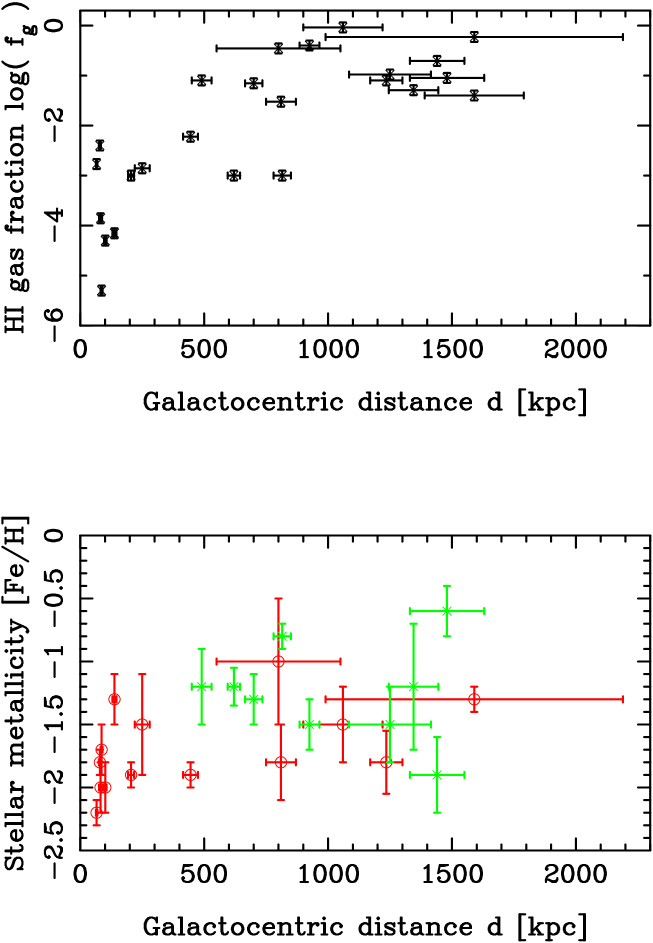
We can do ‘backyard cosmology’ by comparing the properties of the dwarf galaxies in the Local Group with our models. If we believe that dwarf galaxies give rise to a significant fraction of the observed DLAs, then we must explain why many dwarfs in the Local Group are too gas-poor to produce the column densities in DLAs. This may be an environmental effect. The Local Group dwarf galaxies clearly separate into two classes ([\astronciteMateo1998]): gas-poor dwarfs, those within kpc of the Milky Way or Andromeda; and gas-rich dwarfs, which lie further out, as shown in Fig 10a. Dwarfs near giants have probably had their gas stripped by tidal interactions.
The stellar metallicities in the Local Group dwarf galaxies are the mean values measured for old and intermediate-age stars (Fig 10b), and thus reflect the gas-phase metallicities 1 – 10 Gyr ago. The observed values, [Fe/H] , are similar to the properties of DLAs at redshifts , which in our low density cosmology corresponds to a look-back time Gyr. There may be a hint that the lowest mass dwarf galaxies () have the lowest metallicities, although the circum-Galactic dwarfs dominate the statistics. Low mass galaxies may be subject to the suppression of star formation and hence chemical evolution due to supernova winds, leaving gas-poor, low metallicity systems. Alternatively, low mass galaxies may simply have very low star formation rates, giving a gas-rich, low metallicity system. The gas fraction of the majority of Local Group dwarf galaxies are comparable to those inferred for DLA absorbers from our models.
[INSERT FIGURE 10 HERE]
We therefore conclude that there are dwarf galaxies in the bulk of the volume of the Local Group which have gas fractions and metallicities compatible with those of DLAs. Further investigation would be desirable, but we do not attempt the necessary more detailed modelling of Local Group dwarfs here.
6.5 Time delayed elements
The main sources of heavy elements are thought to be Type II supernovae, which enrich the interstellar medium ‘promptly’ on timescales of yr, and Type Ia supernovae, which are ‘delayed’ by up to Gyr. The elements predominantly produced in massive stars are thought to include Si, O, Mn and Zn. It is thought that Fe is partly produced in SNII, but that SNIa may be at least twice as efficient Fe producers. We have therefore modelled the evolution of element ratios by calculating a delayed metallicity as well as the standard prompt metallicity which we compare with [Zn/H] measurements throughout this paper. The evolution of ‘Promptium’ (which can masquerade as e.g. O, S, Si) with respect to an element, ‘Delaydium’, which is one third prompt and two thirds delayed (e.g. Fe) can be calculated for different relative time delays, such as 0.25, 1 and 3 Gyr.
[INSERT FIGURE 11 HERE]
At early times (high redshift, low metallicity) in the model systems, only the prompt portion of iron has been produced, and so [Pr/De] . After Gyr, the delayed portion of iron starts to build up and [Pr/De] falls towards the final cosmic value, [Pr/De]. To reach higher values such as [Pr/De] would require that Delaydium only has e.g. prompt component.
In Fig. 11, we compare the model predictions for the build-up of iron (Delaydium) relative to oxygen, sulphur and silicon (Promptium) for a time delay Gyr in the low density cosmology with the best currently available data, as a function of (a) absorption redshift and (b) metallicity as measured by iron (Delaydium). These data are clearly subject to the usual uncertainties about depletions, and the putative prompt production pathways. Ironically, the most theoretically useful prompt element is oxygen, for which the observations are still subject to particularly significant ambiguities ([\astronciteProchaska and Wolfe2000]). At this stage, all we can say is that our synthetic DLA survey predictions are in reasonable agreement with the available data. More informative investigations of element ratios must await abundance measurements with an accuracy , which are starting to become available ([\astronciteProchaska and Wolfe2000]).
7 Limitations of the Model
We have made no attempt in this paper to model the rôle of mergers in the formation and evolution of galaxies. However, it is clear from infrared surveys (which are efficient at finding interacting galaxies ([\astronciteClements et al.1996])), and from theoretical work ([\astronciteBarnes and Hernquist1996]), that mergers are a fundamental galaxy formation process. Why is it therefore that our model galaxies do so well in reproducing the observational data for DLAs? As a step towards answering this question, we outline a scenario in which mergers do play a rôle.
Suppose that the first generation of bound objects in the Universe were small sub-galactic units of mass – which somehow produce stars. These low-mass star forming units are likely to lose their gas in supernova-driven winds after only a few generations of star formation. If we allow some of these gas-poor, low-mass stellar systems to merge, they would form larger bound systems, embedded in halos of lightly processed ejected gas. A fraction of this lightly enriched halo gas could settle into a disk around the merged stellar systems, and more familiar population I and II star formation could proceed.
The statistics of the merging systems and the subsequent synthesis of giant galaxies can be described by the Press-Schechter model of galactic structure formation ([\astroncitePress and Schechter1974]). The interesting point about the scenario outlined above, is that only a small amount of star formation takes place prior to the formation of the disk galaxy. In our simple model, very little star formation takes place during the collapse phase. This suggests that the present day state of a giant galaxy as predicted by this type of model may be insensitive to the details of its formation mechanism ([\astronciteKatz and Gunn1991]), and hence, our preliminary model can still appropriately describe the data.
8 Conclusions and Next Steps
We have constructed a simple, robust model of galaxy chemical evolution, which we quite successfully applied to the study of galaxies detected as damped Ly systems in the spectra of quasars. We have modelled the evolution of neutral hydrogen column density, metallicity and hence, dust opacity, in clouds of initially primordial gas from the point where they begin to collapse under self gravity, up to the present. We find that the outer regions of model giant galaxies, and model sub- galaxies are able to produce absorbers with column density and metallicity typical of DLAs, and remain optically thin. We have studied the specific properties of individual DLAs and find that the models of the underlying galaxies are in good agreement with the limited imaging observations which currently exist, making sense of the relative lack of success in detecting DLAs (e.g. [\astronciteAragón-Salamanca et al.1996]). Contrary to some expectations ([\astronciteWolfe et al.1995]), we predict that a significant proportion of the DLA systems at moderate redshifts () arise in sub- galaxies. We have therefore initiated a new programme of infrared imaging using the Gemini North telescope, which is capable of detecting these fainter galaxies at smaller impact parameters around DLA quasars.
Our ‘monolithic’ models provide a reasonable account of the chemical evolution of the Universe at redshifts below . However, in attempting to use the Holmberg relation to constrain the cosmic history of galaxy formation, we have exposed the limitations of our model assumption concerning the unimportance of galaxy mergers, particularly in promoting star formation at high redshifts (). Our next step is therefore to a slightly more sophisticated galaxy formation scenario, including mergers, to search for observable effects, including changes in predicted DLA properties.
Acknowledgements
The authors thank Max Pettini for stimulating and useful discussions, Dave Clements for comments on draft versions of this MS, and Roger Philp for advice in code optimisation. ACB is supported by PPARC and GPM acknowledges a Cardiff University Physics and Astronomy research studentship.
References
- [\astronciteAragón-Salamanca et al.1996] Aragón-Salamanca, A., Ellis, R. S., and O’Brien, K. S.: 1996, MNRAS 281, 945
- [\astronciteArnett1996] Arnett, D.: 1996, Supernovae and Nucleosynthesis, Princeton University Press
- [\astronciteArnett and Thielemann1985] Arnett, W. D. and Thielemann, F.-K.: 1985, ApJ 295, 589
- [\astronciteBaker et al.2001] Baker, A. C., Mathlin, G. P., Churches, D. K., and Edmunds, M. G.: 2001, MNRAS (in preparation)
- [\astronciteBarnes and Hernquist1996] Barnes, J. E. and Hernquist, L.: 1996, ApJ 471, 115
- [\astronciteBaugh et al.1998] Baugh, C. M., Cole, S., Frenk, C. S., and Lacey, C. G.: 1998, ApJ 498, 504
- [\astronciteBergeron1986] Bergeron, J.: 1986, A&A 155, L8
- [\astronciteBergeron and Boissé1991] Bergeron, J. and Boissé, P.: 1991, A&A 243, 344
- [\astronciteBinney and Merryfield1998] Binney, J. and Merryfield, M.: 1998, Galactic Astronomy, Princeton University Press
- [\astronciteBoissé et al.1998] Boissé, P., Brun, V. L., Bergeron, J., and Deharveng, J.-M.: 1998, A&A 333, 841
- [\astronciteBoyle et al.1988] Boyle, B. J., Shanks, T., and Peterson, B. A.: 1988, MNRAS 235, 935
- [\astronciteBruzual and Charlot2000] Bruzual, G. and Charlot, S.: 2000, (in preparation)
- [\astronciteCenturion et al.1998] Centurion, M., Bonifacio, P., Molaro, P., and Vladilo, G.: 1998, ApJ 509, 620
- [\astronciteCenturion et al.2000] Centurion, M., Bonifacio, P., Molaro, P., and Vladilo, G.: 2000, ApJ 536, 540
- [\astronciteChurches1999] Churches, D. K.: 1999, Ph.D. thesis, University of Wales College of Cardiff
- [\astronciteClements et al.1996] Clements, D. L., Sutherland, W. J., McMahon, R. G., and Saunders, W.: 1996, MNRAS 279, 477
- [\astronciteDjorgovski et al.1996] Djorgovski, S. G., Pahre, M. A., Bechtold, J., and Elston, R.: 1996, Nature 382, 234
- [\astronciteDomingue et al.1999] Domingue, D. L., Keel, W. C., Ryder, S. D., and White, R. E.: 1999, AJ 118, 1542
- [\astronciteEdmunds2001] Edmunds, M. G.: 2001, MNRAS (in preparation)
- [\astronciteEdmunds and Eales1998] Edmunds, M. G. and Eales, S. A.: 1998, MNRAS 299, L29
- [\astronciteEdmunds and Phillipps1997] Edmunds, M. G. and Phillipps, S.: 1997, MNRAS 292, 733
- [\astronciteet al.2000] et al., J. X. P.: 2000, astro-ph/0008075
- [\astronciteFranca and Cristiani1997] Franca, F. L. and Cristiani, S.: 1997, AJ 113, 1517
- [\astronciteGarnett1998] Garnett, D. R.: 1998, in D. Friedli, M. Edmunds, C. Robert, and L. Drissen (eds.), ASP Conference Series, Vol 147
- [\astronciteHauser and et al.1998] Hauser, M. G. and et al.: 1998, ApJ 508, 25
- [\astronciteHewett et al.1995] Hewett, P. C., Foltz, C., and Chaffee, F.: 1995, AJ 109, 1498
- [\astronciteHolmberg1975] Holmberg, E.: 1975, in A. Sandage and M. S. amd J. Kristian (eds.), Galaxies and the Universe
- [\astronciteJiménez et al.1999] Jiménez, R., Bowen, D. V., and Matteucci, F.: 1999, ApJL 514, L83
- [\astronciteJunkkinarien et al.1991] Junkkinarien, V., Hewitt, A., and Burbidge, G.: 1991, ApJS 77, 203
- [\astronciteKatz and Gunn1991] Katz, N. and Gunn, J. E.: 1991, ApJ 377, 365
- [\astronciteKennicutt1988] Kennicutt, R. C.: 1988, ApJ 334, 144
- [\astronciteKennicutt1998] Kennicutt, R. C.: 1998, ApJ 498, 541
- [\astronciteKuchinski et al.1998] Kuchinski, L. E., Terndrup, D. M., Gordon, K. D., and Witt, A. N.: 1998, AJ 115, 1438
- [\astronciteLanzetta et al.1991] Lanzetta, K. M., McMahon, R. G., Wolfe, A. M., Turnshek, D. A., Hazard, C., and Lu, L.: 1991, ApJS 77, 1
- [\astronciteLanzetta et al.1995] Lanzetta, K. M., Wolfe, A. M., and Turnshek, D. A.: 1995, ApJ 440, 435
- [\astronciteLu et al.1996] Lu, L., Sargent, W. L. W., Barlow, T. A., Churchill, C. W., and Vogt, S. S.: 1996, ApJS 107, 475
- [\astronciteLu et al.1995] Lu, L., Savage, B. D., Tripp, T. M., and Meyer, D. M.: 1995, ApJ 447, 597
- [\astronciteMaloney and Petrosian1999] Maloney, A. and Petrosian, V.: 1999, ApJ 518, 32
- [\astronciteMateo1998] Mateo, M.: 1998, Annual Reviews of Astronomy & Astrophysics 36, 435
- [\astronciteMatteucci et al.1997] Matteucci, F., Molaro, P., and Vladilo, G.: 1997, A&A 321, 45
- [\astronciteMeyer et al.1995] Meyer, D. M., Lanzetta, K. M., and Wolfe, A. M.: 1995, ApJL 451, 13
- [\astronciteMeyer and York1992] Meyer, D. N. and York, D. G.: 1992, ApJL 399, 121
- [\astronciteMolaro et al.1998] Molaro, P., Centurión, M., and Vladilo, G.: 1998, MNRAS 293, L37
- [\astronciteOutram et al.1999] Outram, P. J., Chaffee, F. H., and Carswell, R. F.: 1999, MNRAS 305, 685
- [\astroncitePagel1997] Pagel, B. E. J.: 1997, Nucleosynthesis and Chemical Evolution of Galaxies, CUP
- [\astroncitePeebles1993] Peebles, P. J. E.: 1993, Principles of Physical Cosmology, Princeton University Press
- [\astroncitePei and Fall1995] Pei, Y. C. and Fall, S. M.: 1995, ApJ 454, 69
- [\astroncitePettini et al.1999a] Pettini, M., Ellison, S. L., Steidel, C. C., and Bowen, D. V.: 1999a, ApJ 510, 586
- [\astroncitePettini et al.1999b] Pettini, M., Ellison, S. L., Steidel, C. C., and Bowen, D. V.: 1999b, ApJ 510, 576
- [\astroncitePettini et al.2000] Pettini, M., Ellison, S. L., Steidel, C. C., Shapley, A. E., and Bowen, D. V.: 2000, ApJ 532, 65
- [\astroncitePettini et al.1995] Pettini, M., Lipman, K., and Hunstead, R. W.: 1995, ApJ 451, 100
- [\astroncitePettini et al.1994] Pettini, M., Smith, L., Hunstead, R. W., and King, D. L.: 1994, ApJ 426, 79
- [\astroncitePettini et al.1997] Pettini, M., Smith, L. J., King, D. L., and Hunstead, R. W.: 1997, ApJ 486, 665
- [\astroncitePhillipps and Edmunds1996] Phillipps, S. and Edmunds, M. G.: 1996, MNRAS 281, 368
- [\astroncitePress and Schechter1974] Press, W. H. and Schechter, P.: 1974, ApJ 187, 425
- [\astronciteProchaska and Wolfe1996] Prochaska, J. X. and Wolfe, A. M.: 1996, ApJ 470, 403
- [\astronciteProchaska and Wolfe1997] Prochaska, J. X. and Wolfe, A. M.: 1997, ApJ 474, 140
- [\astronciteProchaska and Wolfe1999] Prochaska, J. X. and Wolfe, A. M.: 1999, ApJS 121, 369
- [\astronciteProchaska and Wolfe2000] Prochaska, J. X. and Wolfe, A. M.: 2000, astro-ph/0002513
- [\astroncitePuget and et al.1996] Puget, J.-L. and et al.: 1996, A&A 308, L5
- [\astronciteRao and Turnshek2000] Rao, S. and Turnshek, D.: 2000, ApJS (accepted)
- [\astronciteSchmidt1959] Schmidt, M.: 1959, ApJ 129, 243
- [\astronciteSmette et al.1995] Smette, A., Robertson, J. G., Shaver, P. A., Reimers, D., Wisotzki, L., and Koehler, T.: 1995, A&AS 113, 199
- [\astronciteSteidel1995] Steidel, C. C.: 1995, in G. Meylan (ed.), QSO Absorption lines
- [\astronciteSteidel et al.1999] Steidel, C. C., Adelberger, K. L., Giavalisco, M., Dickinson, M., and Pettini, M.: 1999, ApJ 519, 1
- [\astronciteSteidel et al.1995] Steidel, C. C., Pettini, M., and Hamilton, D.: 1995, AJ 110, 2519
- [\astronciteStorrie-Lombardi et al.1996a] Storrie-Lombardi, L. G., Irwin, M. J., and McMahon, R. G.: 1996a, MNRAS 282, 1330
- [\astronciteStorrie-Lombardi et al.1996b] Storrie-Lombardi, L. G., McMahon, R. G., and Irwin, M. J.: 1996b, MNRAS 283, L79
- [\astronciteStorrie-Lombardi and Wolfe2000] Storrie-Lombardi, L. J. and Wolfe, A. M.: 2000, ApJ (accepted)
- [\astronciteThielemann and Arnett1985] Thielemann, F.-K. and Arnett, W. D.: 1985, ApJ 295, 604
- [\astronciteValentijn and van der Werf1998] Valentijn, E. and van der Werf, P.: 1998
- [\astronciteWolfe et al.1995] Wolfe, A. M., Lanzetta, K. M., Foltz, C. B., and Chaffee, F. H.: 1995, ApJ 454, 698
- [\astronciteWolfe et al.1986] Wolfe, A. M., Turnshek, D. A., Smith, H. E., and Cohen, R. D.: 1986, ApJS 61, 249
- [\astronciteYanny and York1992] Yanny, B. and York, D. G.: 1992, ApJ 391, 569
| DLA | Absorption | Impact | Mass | Mass | ||||
|---|---|---|---|---|---|---|---|---|
| name | redshift | parameter | (baryons) | (stars) | ||||
| (kpc) | ||||||||
| 010013000 | 2.309 | |||||||
| 011203000 | 2.423 | |||||||
| 014933500 | 1.613 | |||||||
| 045403600 | 0.860 | |||||||
| 05282500A | 2.140 | |||||||
| 08411256A | 2.375 | |||||||
| 08411256B | 2.476 | |||||||
| 115106800 | 1.774 | |||||||
| 121533300 | 1.999 | |||||||
| 122317530 | 2.466 | |||||||
| 122902100 | 0.395 | |||||||
| 124726700 | 1.223 | |||||||
| 132830700 | 0.692 | |||||||
| 133117040 | 2.800 | |||||||
| 22061990B | 2.076 | |||||||
| 234412400 | 2.538 | |||||||
| 234814440 | 2.279 | |||||||
| 23590220B | 2.152 |
Figure Captions
Figure 1 The evolution of the quasar optical luminosity function (QOLF), and the effects of obscuration. (a) A parametric fit to the QOLF at redshift ; (b) A pure luminosity parameterisation of the evolution of the characteristic quasar luminosity (); (c) The apparent magnitude of the ‘knee’ in the QOLF, accounting for PLE and cosmological dimming (error bar indicates approximate overall uncertainties); (d) The foreground optical depth required to dim an quasar below a survey apparent magnitude limit (and uncertainties).
Figure 2 Typical dust opacity predicted from the gas phase metallicity and the neutral gas column density. The dashed lines correspond to typical dust optical depths . The solid box shows the region occupied by normal galaxies (with a possible extension into the dotted box). The data points at [-1.8, 21.8] and [-1.6, 21.8] are I Zw 18 and the LMC. The remaining data points are all known DLAs for which metallicity measurements are available ([Fe/H] measurements have been corrected for [Zn/Fe] (see § 6)).
Figure 3 The model redshift selection function, which is a fit to the combined redshift survey path lengths, X(z), of the existing large, well defined DLA surveys (see text).
Figure 4 Comparison of DLA observations (points) with the predictions of our model (contours) using Monte Carlo simulations in Einstein-de Sitter cosmology. The dashed lines indicate the approximate selection effects which affect the data (derived from DLA surveys, including the metallicity measurements of Pettini and collaborators; see text).
Figure 5 Cumulative distributions of observed and synthetic DLAs in (a) redshift, (b) column density and (c) metallicity in the low density universe. Identical selection effects, empirically derived from DLA surveys (including the metallicity measurements of Pettini and collaborators; see text), have been applied to the model and the data.
Figure 6 Comparison of DLA observations (points) with the parameter space density of systems predicted by our model (contours) using Monte Carlo simulations in low density cosmology. Identical selection effects, empirically derived from DLA surveys (including the metallicity measurements of Pettini and collaborators; see text), have been applied to the model and the data.
Figure 7 Comparison of DLA metallicities as a function of redshift from observations (points, [Zn/H] and [Fe/H]) and our model (contours), as in Figure 6 but with no selection effects applied.
Figure 8 The star formation history of the Universe. The data points are for UV observations, taken from Steidel 1999 and not corrected for extinction. Our model prediction is shown as a (smoothed) curve. The curve has not been fitted to these data.
Figure 9 The global properties of our model Universe. The fraction of the closure mass density supplied by baryons in galaxies, (solid line); gas in galaxies, (dashed) ; in stars, (dotted); in metals, (dash-dot), in dust, (dash-dot-dot-dot). The contribution from total mass in galaxies, . The contribution from mass not yet formed into galaxies, , where the overall mass contribution in our low density cosmology. The data points are the inferred in DLAs ([\astronciteStorrie-Lombardi et al.1996a, \astronciteRao and Turnshek2000, \astronciteStorrie-Lombardi and Wolfe2000]).
Figure 10 Local Group dwarf galaxies as a function of distance from the Milky Way (a) HI gas fraction (b) Stellar metallicity [Fe/H] for dwarf galaxies with mass (open circles) and (crosses).
Figure 11 Ratios of prompt element (Promptium, Pr) to delayed element abundances(Delaydium, De) for simulated DLA survey (points as dots), with data for [O/Fe] (circles), [S/Fe] (‘S’ shapes) and [Si/Fe] (triangles), with errors) as a function of a) absorption redshift b) metallicity ([De/H] or [Fe/H]).