FAR ULTRAVIOLET IMAGERY OF THE EDGE-ON SPIRAL GALAXY NGC 4631
Abstract
Far ultraviolet () imagery of the edge-on, Sc/SBd galaxy, NGC 4631 reveals very strong emission, resulting from active star formation, uniformly distributed along the galactic mid- plane. Multi-band imagery, H I and H II position-velocity curves and extinction considerations all imply that the emission is from the outer edges of the visible galaxy. The overall morphology of this edge-on disk system is remarkably similar to those of the so-called “chain galaxies” evident at high redshift, thus suggesting a similar interpretation for at least some of those distant objects. and magnitudes, measured for 48 star forming regions, along with corresponding and measurements are used to construct diagnostic color-color diagrams. Although there are significant exceptions, most of the star forming regions are less massive and older than 30 Doradus. Comparison with the expectations from two star formation models yields ages of 2.7 to 10 Myr for the instantaneous burst (IB) model and star formation cut-off ages of 0 to 9 Myr for the continuous star formation (CSF) model. Interpreted in terms of the IB model the photometry implies a total created mass in the 48 star forming regions of 2.5107 M☉. When viewed as resulting from constant star formation the photometry implies a star formation rate of 0.33 M☉ yr-1. These results are compared to those derived from FIR and radio observations. Corrections for emission reprocessed by interstellar grains are estimated.
A large ring, 3 kpc in diameter, of 14 star forming regions is concentrically located with an expanding H I shell (Rand & van der Hulst, 1993) toward the eastern end of the galaxy. Our observations imply that the shell may have been generated primarily by supernovae arising from 5.3104 OB stars in a massive star forming region beginning about 20 Myr ago, and that the presently observed bright emission is due to second generation stars.
1 Introduction
The group of galaxies including NGC 4631 provides an outstanding example of a galaxy interaction accompanied by intensive star formation. Far Ultraviolet () imagery of the Sc/SBd galaxy NGC 4631, recorded by the Ultraviolet Imaging Telescope (UIT), exhibits very bright emission from sources corresponding to the H II regions cataloged by Crillon & Monnet (1969) along with substantial diffuse light. The observed emission is, in our experience, extraordinary in that NGC 4631 is observed nearly edge-on, and strong attenuation of light by dust in the galactic disk would be anticipated. Such is the case for NGC 891, another highly inclined galaxy and M82, an edge-on starburst galaxy – both of which show very little detectable emission. (Images of NGC 891 and M82 are accessible at http://archive.stsci.edu/astro/uit/index.html). Together with the imagery obtained by Rand et al. (1992) the results signify widespread intensive star formation along the observable disk of NGC 4631. The overall morphology is remarkably similar to those of the so-called “chain galaxies” that have been observed at high redshift (Cowie et al., 1995). It may be that a significant fraction of these distant sources is composed of highly inclined disk galaxies rather than dynamically unstable chains of sub-galactic clumps. See Smith et al. (1997) for further details.
Observations of the radio halo imply that the galactic-wide star formation in NGC 4631 is sufficiently intense as to supply cosmic rays to the halo through bursting supershells formed by supernovae and stellar winds in the disk (Dahlem et al., 1995; Golla & Hummel, 1994). Optical images reveal a patchy distribution of dust rather than a well defined dust lane. Thus, the extensive emission may result from the combined dispersal of dust by these bursting supershells and by forces generated through tidal interactions NGC 4631 and NGC 4656 (Combes, 1978).
There is also evidence for an inner disk or torus (r50) revealed most clearly in CO(1-0) and CO(2-1) line emissions (Golla & Wielebinski, 1994; Sofue et al., 1989, 1990). The radio continuum emission coincides spatially with the CO emission and has a substantial non-thermal component (Duric et al., 1982). There also appears to be a region of enhanced star formation near the center (R360 pc) of NGC 4631 (Duric et al., 1982; Sofue et al., 1989) coinciding closely with the center of the galaxy as measured in the infrared by Aaronson (1978). More recently, Wang et al. (1995) reported the ROSAT detection of soft X-rays extending out to 8 kpc above the galactic midplane. When interpreted in terms of the burst supershell model, this observation implies substantial star formation near the center of NGC 4631. Indeed, considering mostly the radio data, Golla & Wielebinski (1994) view NGC 4631 as a galaxy with a mild central starburst.
Of interest is a supershell with a diameter of 3 kpc detected at 21 cm by Rand & van der Hulst (1993). The shell corresponds to a distortion in the disk near the eastern end of the galaxy appearing in all optical images and in a particularly obvious way in both the and images. A preliminary explanation for the shell is that it is produced by the combined effects of stellar winds and supernovae from OB associations containing (1-3.5)104 OB stars (Rand & van der Hulst, 1993). Alternatively, these authors suggest that the eastern cavity may have been punched into the galactic disk by a high velocity cloud (HVC) which itself originated from the tidal stripping of the galactic disk during a prior interaction with NGC 4656. A collision with a dwarf galaxy could have also produced the same result.
In this paper we present the imagery of NGC 4631. Using these data together with recently obtained optical imagery, we infer the star formation history of the bright emitting associations including those circumscribed by the Rand and van der Hulst super shell. The implications of these results on the ultraviolet emission morphology, local and global star formation, and the viability of the starburst shell and HVC impact hypothesis are discussed. In all subsequent discussions, we place the galactic center at RA(2000) = 12h39m 398, DEC(2000) = +32°48′48″, adopt a galactic distance of 7.5 Mpc (Golla & Hummel, 1994) and abbreviate the H II regions observed by Crillon & Monnet (1969) as CM(#).
2 Observations
NGC 4631 was observed by the UIT through the B1 filter ( = 152.0 nm; = 35.4 nm) for 1140 seconds on March 10, 1995 during the Spacelab ASTRO-2 mission. The instrument is completely described in Stecher et al. (1992, 1997). images, intensified and down-converted to visible wavelengths by a two stage magnetically focussed intensifier, were recorded on IIa-O film, digitized with a PDS microdensitometer, and reduced as described in Stecher et al. (1992, 1997). The plate scale of 1′ mm-1 together with a microdensitometer aperture of 0.021 mm resulted in a pixel size of 1.26″. The FWHM of the point spread function was 3.4″ over a circular 40′ field-of-view.
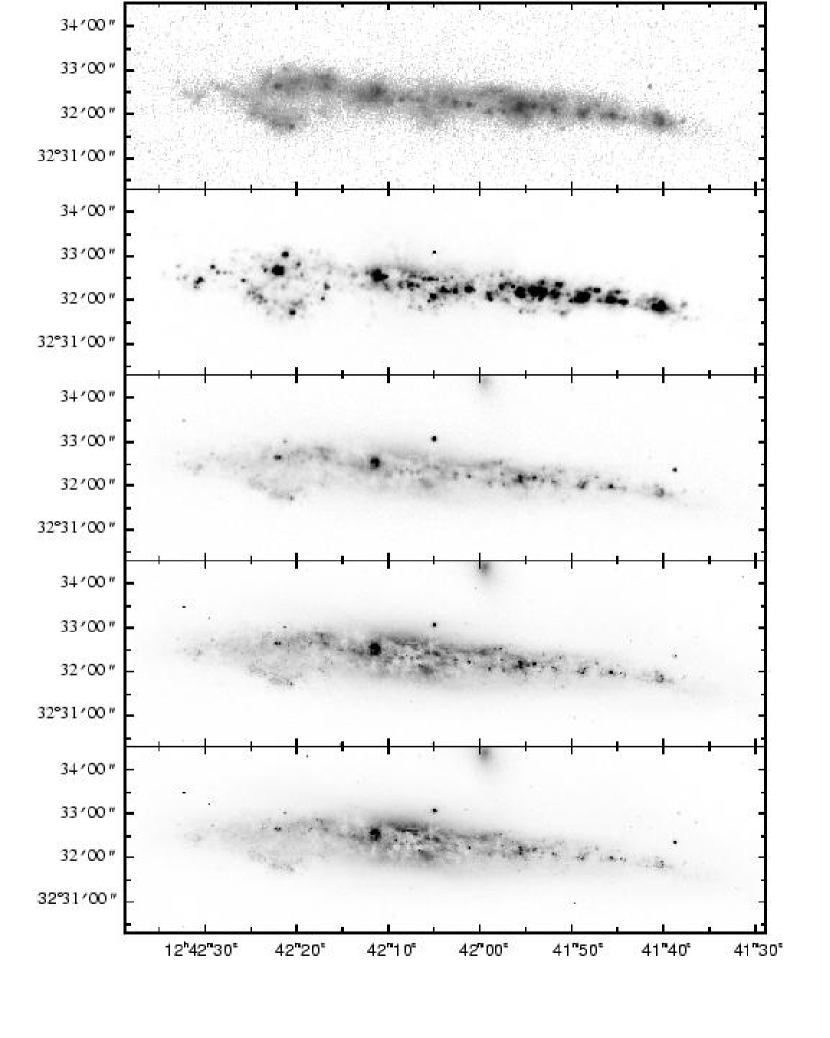
Ground based images of NGC 4631 were also recorded in the standard and bandpasses and in and line emission. The observations are summarized in Table 1. The , and -band images are shown in Figure 1.
The absolute sensitivity of the UIT was determined by observations of stars the spectra of which were measured by the IUE (Stecher et al., 1997). This procedure resulted in an uncertainty in the absolute flux measurements of 10%. Relative sensitivity throughout the B1 passband was measured in the laboratory. Relative transmissions anywhere in the passband were accurate to 2% at transmission levels above 1% of the maximum transmission. At 320 nm the instrument response is reduced from the maximum response by more than 5 dex and at 330 nm by more than 8 dex.
The UIT image was corrected for geometric image (“S”) distortion according to the formulation developed by Greason et al. (1994). Each of the ground based images was then transformed to the same plate scale and orientation as the UIT image.
The absolute sensitivity of the and band images was determined using observations of the spectrophotometric standard star BD+33 2642. After establishing the calibration using the spectrophotometry of Stone (1977), the and magnitudes were cross checked against the broad band measurements recorded by Klemola (1962). The values match within 5%.
Astrometry of the broad band and images was determined using stars in common with the Digitized Guide Star Catalog of Lasker et al. (1990). The astrometric solution of the UIT image was based on positions of star forming knots in common with the KPNO U-band image yielding a positional uncertainty of 0.74 arcseconds.
Continuum subtraction in the image was performed using foreground stars in both on-line and off-line images. Observations of the planetary nebula NGC 7027 were used for absolute calibration. Astrometry for the image was adopted from Rand et al. (1992), and differs from the broad-band astrometry by no more than 1.1 arcseconds.
The on-line and off-line images were separately calibrated using the spectrophotometric standard star, Kopff 27 (Stone, 1977). After absolute calibration, a scale factor of 1.22 was applied to the off-line image to allow removal of continuum sources, i.e. star images from the field. After continuum subtraction was performed, the flux of the UV-bright region in the disk of NGC 4631, CM-67, as measured through a 21″ diameter synthetic aperture was 2.3410-13 ergs s-1 cm-2. This value is 6% greater than the equivalent measurement by Roy et al. (1991).
3 Morphology
Inspection of the V and B images shows dust silhouetted against the red stars of the nuclear bulge. Most of the dust appears to be concentrated near the galactic center; its morphology corresponds roughly to the distribution of CO in an interior disk as measured by Golla & Wielebinski (1994), Sofue et al. (1990), and of the dust as observed by Braine et al. (1995), in 1.3 mm continuum emission. Its distribution is chaotic extending above the galactic midplane by as much as 1.3 kpc. The B, V and images show that the cores of some of the CM H II regions are silhouetted against the dust patches, implying that much of the bright emission originates edgeward from the central 4 kpc of NGC 4631.
This impression is reinforced by the measured H I and H II velocity-position curves. The H I velocity-position curves (Weliachew et al., 1978; Sofue et al., 1990) imply a constant H I velocity at distances greater than 1′ from the galactic center. However, at these distances the data of Crillon & Monnet (1969) show a linear increase in the observed velocity as a function of increasing distance from the galactic center. Such behavior would result if the H II gas velocity were constant beyond 1′ from the galactic center, and the emission was from gas located at an approximately constant galactocentric radius. Since the bright FUV/H II regions extend 24 kpc along the entire major axis of the imaged galaxy, we deduce that most of the H II regions are located near the galactic periphery.
We also note that if the presently observed emission regions were to be further obscured by dust in an interstellar gas of density 0.5 cm-3, as indicated by Rand’s (1994) 21 cm measurements of the NGC 4631 midplane, an effective gas depth of 1.2 kpc would cause more than half of the observed UV-bright regions to be undetectable by the UIT. To obtain this result, the relationship
(Bohlin et al., 1978), determined from measurements along 75 lines-of-sight in the Galaxy, is assumed to be valid. We do not include the molecular gas density in our estimate since this quantity is unknown; its inclusion would further reduce the effective gas depth. We also assume that a detection would be at the 2 level. Even though the dust is observed to be patchy, the fact that the entire major axis is delineated by bright emission requires that many of the emission regions are near the visual periphery of the galaxy.
Finally we note that peripheral H II regions and emitting sources are commonplace in many Sc-Sd type galaxies, including M101 (Waller et al., 1997a), M74 (Cornett et al., 1994) and M83 (Bohlin et al., 1983).
Generally, the emission coincides closely with the emission, much of which shows significant departures from the midplane as defined by the symmetric distribution of H II regions about the major axis (see Crillon & Monnet (1969)). If this coincidence is related to the distribution of young, massive stars, and contributions to the observed light from distant regions of the galaxy are masked by the UV opacity of the displaced gas then star formation must be occurring at substantial distances ( 36, 1.3 kpc) above the galactic midplane. This does not include the even greater extent of Rand’s shell 1 perpendicular to the galactic midplane (z 1.7 kpc). Some unknown fraction of the high diffuse emission at high altitude is likely due to dust scattered light.
Comparison of the and images indicates that the sizes of the H II and star forming regions are about the same as well as being co-spatial. This implies that the B-type stars which account for most of the light have not moved far from their birth place. Typically, a star forming region which appears to be a single rounded area unblended with other regions in the UIT image subtends an angle of about 8 arcseconds corresponding to a linear distance of 291 pc at the assumed distance of 7.5 Mpc. Moving with a speed of 10 km s-1 stars would disperse to a width of 291 pc in 14 Myr. Although some of the bright regions are clearly blends of smaller regions making geometric comparisons impossible, we expect that many of the star forming regions must be on the order of 14 Myr old or younger.
4 Photometry
4.1 and Visual Photometry of 48 Regions
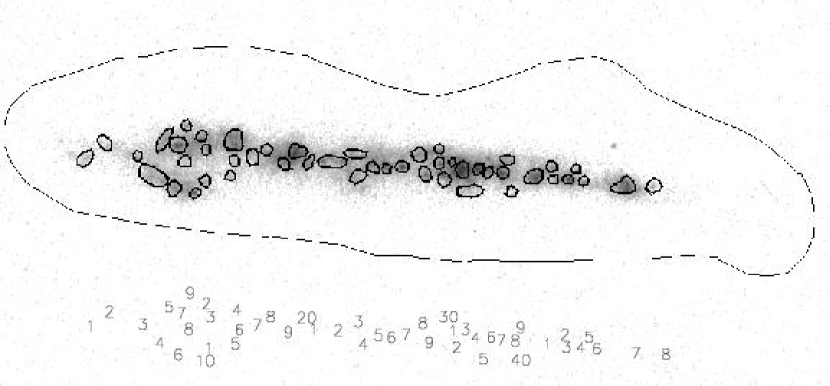
Figure 2 is the image which shows hand-drawn boundaries and numbering of the apertures in which photometry was performed. The criteria for establishing the numbered boundaries were (1) that each should include at least one unresolved emission region that is also seen clearly in the B image, (2) that each should include all the reflection nebulosity belonging to the selected emission regions, and (3) that each should include all the compact H II regions and filaments apparently belonging to the selected associations and not to the general background. The boundaries thus determined were also applied to the , , , and images. The intent was to delineate those data which will yield a consistent model of star formation within each boundary. Similarly, a large aperture drawn around the entire galactic image in each broad band and emission line permitted global quantities to be computed from spatially integrated fluxes.
The sky background, subtracted from each image, is determined from the responses in 50 rectangular apertures distributed over the entire field-of-view and located in clear regions between stellar images. The apertures are 3131 pixels2 and the standard deviation of the distribution of the pixel responses within an aperture were taken to indicate the rms variation in the pixel-to-pixel response. In flux density units the pixel-to-pixel variation is 4.3 10-18 ergs cm-2 s-1 Å-1 in the image and 1.4 10-18 ergs cm-2 s-1 Å-1 in the , and images. The sky background is the average of the responses in the 50 apertures. The standard deviation of the average responses in the 50 apertures is taken to indicate the uniformity of the sky over the field-of-view. This variation is 5.110-19 ergs cm-2 s-1 Å-1 in the FUV image and 3.610-19 ergs cm-2 s-1 Å-1 in the , and images. The variation in sky uniformity makes a negligible contribution to the total random error in the derived flux densities. However, the contribution of the pixel-to-pixel variation can be as large as 28%, although it is generally less than 10%.
Correction for scattered light and sky background within the individual apertures was achieved in the following manner. Each aperture was expanded by 2 pixels (2.5 arcseconds) at its edge to create annuli between the original and expanded apertures. Histograms of the pixel response to the background included in the annulus were made from which the mean value was taken to be representative of the background from all sources underlying the emission from the recently formed stars and the gas excited by those stars. The total background was simply the mean value multiplied by the number of pixels encompassed by the original aperture.
Other than the correction for the sky background, no further correction was made to the integrated flux density of each image within the large aperture. Expanding and shrinking the large aperture by 8 pixels or 20 arcseconds changes the integrated flux by 1% or less in all of the broad-band images. Thus, the integrated flux is quite insensitive to the actual position of the large aperture on the sky.
The contribution to the observed continuum arising from two photon emission in the ionized gas was evaluated and found to be generally at the 1% level with a maximum of 4% of the observed continuum. This effect was neglected in subsequent calculations.
Error will be made to the extent that the stellar emission, associated reflected light and line emission from the individual regions cannot be uniquely isolated from light emitted from the rest of the galaxy. This is particularly true for the , , and images and is exacerbated by the edge-on aspect of the object. The problem is so severe for the -band image that the aperture photometry is very inaccurate, and is for this reason not included in the subsequent analysis. In addition, uncertainties arising from the background correction procedure can be substantial, particularly for faint sources. Some indication of the magnitude of this systematic error can be had by expanding and contracting the apertures by 2 pixels (2.5 arcseconds). The result is that sky corrected flux densities change by an average factor of 1.5 for the broad-band photometry and factors of 1.4 and 1.7 respectively for the and line photometry.
Listed in Table 2 are the photometry results corrected for background and extinction in the Galaxy. The latter correction was accomplished using the Galactic value of E(B-V) = 0.007 (de Vaucouleurs et al., 1991) (see note b, Table 2) with the Seaton (1979) extinction law. The aperture number as in Figure 2 and CM H II regions included in each aperture are listed in column 1 and 2 respectively. The observed (152 nm), and fluxes in units of 10-15 ergs cm-2 s-1 Å-1 are listed in columns 3, 4, 5 and 6 respectively, and the and fluxes in units of 10-15 ergs cm-2 s-1 are listed in columns 7 and 8 respectively. Values of computed from the Balmer Decrement are given in column 9. The second number in each column is the 1 standard deviation due to random errors in the measurements only. The next to last row shows the sums of each column for columns 2 through 7, i.e. the sum of the fluxes in all 48 apertures. The last row shows the flux values integrated over the entire galactic image inside the large aperture.
The color excesses were computed from Balmer Decrement and from the difference between the measured colors and colors determined from models of evolving star forming clusters. The models (see Section 5, below) describe the evolution of clusters in which the stars are all coeval, sometimes called “instantaneous burst”, or IB models. In principle, the derivation of in this way is more realistic than using the Balmer Decrement since it is related to the extinction of stellar continuum light rather than the extinction of emission from nearby excited gas. However, the method suffers from the the need for a priori knowledge of the correct IB model parameters in order to infer . With the present data-set, the models were characterized only by their burst ages which were determined from the ratio of the number of Lyman continuum photons to the luminosity, and these latter quantities were determined from the and observations corrected for dust extinction. Values for all other model parameters were assumed as described below in Section 5.
The distribution of values determined from the Balmer Decrements is shown by the red line in Figure 3. A single gaussian fit to the distribution results in a mean value of 0.39. Though the distribution is sharply peaked, there are broad wings at low occurrence levels extending to unrealistic negative values. We take these broad wings to be the result principally of significant errors in the flux density measurements. The less important part of the error is statistical; the most important part, as discussed above, is due to our inability to identify the relevant emission, and is estimated by the variable aperture photometry. Because of these errors we conclude that use of the individual color excesses to correct the measured flux densities for extinction is inappropriate. Rather, we determine a mean value to be applied to all the photometry by means of an iterative procedure. As an initial step, we use the mean value of the distribution computed from the Balmer Decrement to correct the and measurements in each region for extinction using the extinction law of Calzetti et al. (1994). From these corrected values we compute models for each region which are characterized by unique burst times. Subsequently, values are derived from the modeled and observed colors for each region from which a new mean value is determined. This process is repeated until the mean values of converge. The final distribution of values, shown as a black line in Fig 3, exhibits occurrence levels in the wings lower than those associated with the Balmer Decrement measurements, and a mean value of 0.28 which is less by a factor of 0.7 than the value derived from the Balmer Decrement measurements. Qualitatively, this difference in derived values of is characteristic of stars in regions of active star formation. However, the factor by which results of the two methods differ is usually smaller, being about 0.44 (Calzetti et al., 1994; Fanelli et al., 1988). The 2 width of the Gaussian function fitted to the final distribution is 0.36 mag.
Several photometric quantities, which have been corrected for internal extinction, are listed in Table 3. As in Table 2, the aperture number appears in column 1. Magnitudes in the and bands are listed in columns 2, 3, 4 and 5 respectively. The luminosity, the log of the ratio of the number of Lyman continuum quanta to the luminosity, log10(NLyc/L152), and the M152-, M152- and M152- colors are listed in columns 6, 7, 8, 9 and 10 respectively. The associated formal random measurement errors (1),excluding those arising from the extinction corrections are listed adjacent to each quantity in each column. Uncertainty in the extinction correction will result in significant uncertainty in the listed quantities. Increasing or decreasing the mean value of by the standard deviation in the distribution changes the , , and magnitudes by 0.80, 0.50, 0.43 and 0.36 mag respectively, the luminosity by a factor of 2 and the M, M and M colors by an average of 0.37 mag. The change in aperture sizes results in an average change in broad-band magnitudes of 0.56 mag, a change in the H luminosity by 35%, and an average change in the M, M and M colors of 0.37 mag. In general, random errors in quantities expressed as magnitudes are comparable to the changes induced by variation of the aperture sizes. The errors do not include the systematic errors associated with the absolute calibration or the choice of the reddening law.
4.2 Integrated Photometry of NGC 4631
The last line in Table 2 gives the integrated photometry of that part of NGC 4631 which can be observed, in particular all of the image inside the large aperture. A comparison with two possible analog galaxies, M101 (Sc(s)I) and M83 (SBc(s)II)), both observed face-on is given in Table 4. Results from integrated UIT photometry of two additional face-on galaxies, M74 (Sc(s)I) and M51 (Sbc(s)I-II), are also listed. Excepting NGC 4631, the luminosities have been derived from the results of Waller et al. (1997b), with corrections only for extinction arising in the Galaxy, and with modifications to take into account differences in the galactic distances listed by Waller et al. (1997b) and those used in this paper. The NGC 4631 152.1 nm flux is a factor of 1.1 brighter than the 155.0 nm flux (9.8110-13 ergs cm-2 s-1 Å-1) measured by Code & Welch (1982) using the University of Wisconsin experiment on the first Orbiting Astronomical Observatory (OAO). The measured NGC 4631 luminosity is dimmer by factors of 1.2 and 4.0 than the measured luminosities of M83 and M101 respectively.
Far infrared (FIR) luminosities after Rice et al. (1988), adjusted for the differences in distances between that publication and this paper, are listed in column 5. The ratios of FIR to luminosity are listed in column 6. The comparatively high LFIR/LFUV ratio of NGC 4631 compared to M101, M74 and M51 is expected because of its edge-on aspect. If, when viewed face-on, the LFIR/LFUV ratio for NGC 4631 were similar to that of M101, i.e 4, then we can surmise that the luminosity would be 2.3109 L☉ . If the face-on LFIR/LFUV ratio were more nearly like that of M74 or M51, then the luminosity would be 1.1109 L☉. The exceptional galaxy in this group of five is M83 which shows a comparatively large LFIR/LFUV ratio (nearly equal to that of NGC 4631) even though it is viewed face-on. It may be that the dust in M83 provides especially efficient conversion of light into FIR radiation primarily because of its distribution relative to the hot, young stars. The distribution of dust in M101 may also account for the comparatively small LFIR/LFUV ratio in that galaxy.
5 Cluster Ages, Masses, and Star Formation Rates
The photometric results can be combined with models of star forming clusters to explore some aspects of the star formation processes in NGC 4631. The cluster models we will use are discussed in detail in Hill et al. (1994). Here, we will summarize that discussion. The models are those of Landsman (1992), which are based on the work of Lequeux et al. (1981) who derive spectral energy distributions and masses of evolving star clusters. The models use the Geneva stellar evolutionary tracks (Meynet et al., 1994) and the models of Kurucz (1991) at log10(Z/Z☉) = -0.3. In our work, the form of the IMF is (M) = dn(M)/d(lnM) M-x for 1.8 M☉ M 120 M☉ and M-0.6 for 0.007 M☉ M 1.8 M☉. We assume an upper IMF slope of x = 1.35 conforming to the Salpeter (1955) IMF. For our purposes, an instantaneous burst (IB) model of a cluster of co-eval stars is a spectral energy distribution (SED), LIB(), corresponding to a given elapsed time from a burst of star formation. It is the sum of the SEDs of all the stars in the cluster at age weighted by the assumed IMF and normalized to an astrated mass of 1 M☉. Its units are ergs s-1 Å-1 M☉-1. The ionizing photon luminosity is computed by integrating LIB()/hc over shortward of 912 Å. The observed ionizing photon luminosity is given by
| (1) |
where LHα,0 is the luminosity obtained from the observed flux corrected for both extinction and distance. The factor 2.206 is derived under the assumption of case B recombination at 10,000K. The luminosity, LIB(1520 Å,), is defined as LIB() integrated over the response curve of the UIT. The age of a cluster is simply determined by finding that value of at which the observed and model ratios of NLyc/LIB(1520 Å,) are equal. The total astrated mass inferred from the IB model is simply the observed luminosity divided by the normalized IB model SED integrated over the response curve for each broad band.
If continuous star formation (CSF)has occurred at an essentially constant rate over a period of time, the star formation rate, SFR, can be computed by integrating the IB models over time; i.e.
| (2) |
where Lobs,λ is the measured spectral luminosity in ergs s-1 Å-1 and LIB() is the IB model defined above. The integration in time is over the interval of star formation.
5.1 Instantaneous Burst Models
Plots of the observed colors, M152-, M152-, and M152-, (corrected for extinction), vs. log10(NLyc/L152) are shown in Figure 4, a, b, and c. Numbers adjacent to the data points in Figure 4c identify the aperture corresponding to each datum. Error bars indicate the 1 random photometric errors. The points which have been plotted meet the conditions that the signal to noise ratios in the M colors are greater than 3 and the color changes due to variations in the aperture sizes are less than the 1 errors.
The triangle symbols represent the colors computed from IB models where each triangle corresponds to a time in the past when the star burst occurred in integer units of 1 Myr beginning at 2 Myrs on the right and ending at 11 Myrs on the left. The arrow indicates the direction points would move if were to increase by 0.18 mag which is the 1 width of the relevant distribution (black line) shown in Figure 3. All three colors derived from the observations of the selected star forming regions tend to be more positive than those derived from the models. This behavior may be due to our use of an inappropriate reddening curve or possibly to the assumptions regarding the model input parameters. However, in view of the random and systematic errors such distinctions are problematical. For example, increasing the mean value of by about 0.11 mag, which is the adopted uncertainty in this quantity for integrated values as explained below, brings the data in reasonably good agreement with the models. A comparison of the observational results with the IB model indicates that if the star formation occurs in bursts then the bursts occurred from 2.7 to 10 Myrs in the past. It will be noted that the burst times are strongly dependent on log10(NLyc/L152). On average, the change in aperture size will move the points to the left or right an amount equivalent to 1 Myr. The implication of the uncertainty in the extinction correction is that star formation for some regions may have occurred 2.7 Myr further in the past, or 2.3 Myr toward the present.
Individual burst times, determined from the measured log10(NLyc/L152) values are computed for each aperture. The average variation in burst times attributable to the photometric standard deviation is 0.71 Myr, which is about the same as variation due to changes in the aperture sizes. The total astrated mass is determined for all apertures from photometry in the four wide bands as outlined above. The masses summed over the 48 apertures for each broad band are similar; the largest deviation, 20%, is associated with the photometry. This result is remarkable in that the mass of the stars producing the light constitutes a small part of the total mass of stars producing light in the optical bands, and it implies that an average of the summed masses in each band is justified. Random errors in the masses summed over all the apertures for each band are on the order of a percent whereas changes in the aperture sizes cause the summed masses to vary by a factor of 1.41. For integrated quantities corrected for extinction internal to NGC 4631 we adopt, somewhat arbitrarily, an uncertainty in of 0.11, which is equal to the difference between the mean values of the distributions derived from the Balmer Decrements and from the stellar continua. This difference results in an uncertainty in the summed masses by of factor of 2.8. When the aperture size variation is combined with the extinction uncertainty the summed burst mass is uncertain by a factor of 3.9.
5.2 Continuous Star Formation Models
Calzetti (1997) has suggested that in active star forming regions such as described here, B type stars, which supply large amounts of radiation but little , migrate away from the dust clouds of their origin where star formation is continuing to produce massive O stars. A typical migration time of 50 Myr corresponds to a linear dimension of 500 pc and a stellar velocity of 10 km s-1. Such a picture can explain why the color excesses measured from stellar continuum colors are often less than those measured from Balmer Decrements in the gas surrounding Lyman continuum emitting stars. From our observations we estimate that the smallest, most compact UV-bright regions in NGC 4631 can not have begun forming stars substantially more than 14 Myr ago purely on the basis of the morphological similarity of the H and FUV images. The crossing time of the largest region is equivalent to a turn-on time of 48 Myr in the past. However, the FUV image must be composed in part of many spatially unresolved clusters, and with the available data we can not disentangle effects due to the diffusion of stars from those due to the distribution of stellar birth sites. The impression of comparative youth is enhanced by the similarity of the mean E(B-V) values determine by the Balmer Decrements and the integrated stellar continua of each star forming region. Nevertheless, there is likely to be a spread in turn-on times among the UV-bright regions. The analysis presented in Section 6 implies that the large eastern shell may have resulted from a star burst which ocurred 20 Myr ago. Somewhat arbitrarily, we assume that the most representative turn-on time is 14 Myr in the past, but that this representative turn-on time could vary by at least 5 Myr.
Shown in Figure 4 a, b, and c are colors determined from CSF models with star formation beginning 14 Myrs ago and ending at times indicated by circles plotted in 1 Myr intervals from the present (0 Myrs) on the right to 9 Myrs ago on the left. The data points indicate a similar range in turn-off times. Star formation turn-off times and astration rates computed from relation (2) for each passband and the line are listed in Table 5, columns 8 through 13. The rate averaged over all four passbands and the is listed in column 14. Omitted from this compilation are the rates for region 28, which shows a turn-off time so close to the onset of star formation that the rate is unrealistically high. Stated differently, region 28 must be considered a star burst. The average star SFR summed over all the star formation regions is 0.33 M☉ yr-1. If the representative turn-on time was 20 Myr ago, then the total SFR would be about half this rate, or 0.15 M☉ yr-1. The average variation of the summed SFR due to the change in the aperture sizes is 0.17 M☉ yr-1, whereas error in the extinction correction (0.11 mag) results in an uncertainty in the summed SFR of a factor of 5.5. The random error in the summed average SFR is about 1%.
The diagnostic diagrams derived for the CSF models are very similar to those derived for the IB models, their differences being significantly smaller than the dispersion of the data. The observed colors agree with the model colors within the limits defined by the estimated errors. The slope displayed by the CSF models is flatter and less variable than that of the IB models, particularly at the most recent turn-off times (or burst times). This circumstance arises from the fact that most of the FUV flux is provided by B-type stars with lifetimes longer than 14 Myrs. Therefore, the relative proportion of B and later type stars does not vary significantly over the 14 Myr baseline, thus yielding approximately constant UV colors which vary smoothly with turn- off time.
6 The Eastern Supershell
McCray & Kafatos (1987) have developed a quantitative picture of the dynamics of supershells, which can be used to interpret our results and reinterpret those of Rand & van der Hulst (1993). The picture is one in which the supershell was formed and driven to its present size primarily by supernovae occurring in an extraordinarily large collection of associations and clusters resembling those we observe. Combining equations (3) and (4) of McCray & Kafatos (1987) gives an expression
| (3) |
where t7, in units of 10 Myr, is the time required for the shell to expand to a radius, Rs, with a terminal velocity of Vs. Adopting Rs = 1.5 kpc and Vs = 45 km s-1 (Rand & van der Hulst, 1993) we find t7 = 1.96 or about 20 Myr. During this interval, only those stars with mass equal to or greater than M∗ will become supernovae and contribute to the shell expansion. M∗ is given approximately by the relation M∗ 10 M☉ (t7/3)-0.625 (McCray & Kafatos, 1987), and is 13 M☉ for the assumed conditions. The total number of stars, N∗, contributing to shell expansion is given by
| (4) |
where E51 is the energy input to the ISM from each supernovae event in units of 1051 ergs, here assumed to be unity, and n0 is the density of the ambient ISM, which is assumed to be uniform. Substituting the numerical values for Rs and t7 gives N∗ = 2.7105 n0 stars with masses 13 M☉. If n0 = 0.2 cm-3, consistent with the estimate of Rand & van der Hulst (1993), then N∗ = 5.3104 stars (M 13 M☉). This number is somewhat larger than the estimate of Rand & van der Hulst (1993) (1 - 3.5)104 stars, and in absolute terms is extraordinarily large. For example, Kennicutt (1984) has estimated that in 30 Doradus the total mass of OB stars between 10 and 100 M☉ is 50,000 M☉. Assuming a Salpeter (1955) IMF, the total number of OB stars between 13 M☉ and 100 M☉ is 1.54103, a factor of about 34 less than our estimated number of OB stars responsible for the large shell. We find that the light emitted from region 20, which includes the giant H II region CM 67, is produced by stars with a total mass of 2.7106 M☉. If our assumed IMF is valid, then this region contains approximately 1.3104 stars between 13 M☉ and 120 M☉, a number which approaches that inferred for the ancestral stars of the large shell. We infer an even larger number of stars (1.5104) for region 28.
In this picture of shell formation, the UV-bright regions associated with the shell, namely those delineated by apertures 3 through 16, must arise from second generation star formation. As McCray & Kafatos (1987) point out, the shell will probably burst at high galactic latitudes before third generation stars are formed. In fact, as Rand & van der Hulst (1993) suggest on the basis of a break in the H I emission observed on the north side of the shell (their Figure 3), this breakout may have already occurred. These authors also point out that a shell of 3 kpc diameter can be produced initially only if there is significant gas pressure and/or magnetic pressure at high z. These conditions seem plausible when taking into account the obvious tidal effects of the interaction between NGC 4631 and NGC 4656 manifested in the H I emission maps of Weliachew et al. (1978) and Rand & van der Hulst (1993).
If the stars in the vicinity of the supershell were made from a reservoir of gas, most of which was swept up into the shell, then it is possible to make an estimate of a star formation efficiency, here defined as Mstellar/(Mstellar + Mgas), in the supershell region by referring to the Rand & van der Hulst (1993) estimate of the hydrogen supershell mass. The average total stellar mass in the shell region (apertures 3 through 16) inferred from our observations in the , , , and bands is 1.6107 M☉ based on the IB model. Comparison with the estimated hydrogen shell mass of (1-2)108 M☉ implies an efficiency of 0.047. This efficiency represents an upper limit since the contribution of a molecular gas has not been taken into account.
7 Discussion
Interpreted in terms of an instantaneous burst model, the light in all the numbered apertures and in all four wavelength bands implies a total created mass of 2.5107 M☉ within a factor of 3.9. This number may be underestimated by a comparatively small amount due to the absorption of light by interstellar grains as discussed below. Our estimate can be compared to the equivalent number of 5.2106 M☉ in the Magellanic irregular, NGC 4449, which exhibits intense star formation (Hill et al., 1994). The difference between the two galaxies is even greater than indicated here because NGC 4449 is observed nearly face-on revealing more of its star-forming regions than does NGC 4631 which is observed almost edge-on.
The interior disk of NGC 1068 exhibits numerous starburst knots surrounding the nucleus. Bruhweiler et al. (1991) have estimated the total mass of nine of the brightest of these knots, assuming an IB scenario, to be 2.4107 M☉, a number comparable to that derived for our observed 48 regions in NGC 4631. Thus, while the masses deduced for the star-forming regions of NGC 4631 are extraordinarily large, they are not uniquely so.
We also compare the star formation activity of the individual star forming regions with the prototypical giant H II region, 30 Doradus. Using an aperture of 370 pc (d=50 kpc), Kennicutt (1984), obtained L1.51040 ergs s-1 and an estimated total mass of 50,000 M☉ for all stars with individual masses between 10 and 100 M☉ . Extending this Kennicutt estimate over a larger mass range by using the Salpeter IMF we find a total stellar mass between 0.007 and 120 M☉ of 1.11106 M☉. If it is assumed that this mass was produced in a burst, we can compare the total mass estimate with the IB model mass estimates for the individual star forming regions listed in columns 3, 4, 5 and 6 of Table 5. Of the 48 aperture delineated H II regions listed, 6 exhibit derived total masses, averaged between the four wide-band images, in excess of the 30 Doradus value. Taking into account our estimated error, this number can be increased to 26. Of these 6 regions, none exhibit luminosities comparable to 30 Doradus. Again, the photometric uncertainty allows this number to be increased to 3. The luminosity of region 20 is about two-thirds that of 30 Doradus, but its mass is about a factor of 2.5 greater. Region 20 incorporates the bright H II region CM 67 and is associated with a giant molecular cloud, both of which have been tentatively identified with the tip of a bar (Roy et al., 1991). Regions 41 and 47 show both luminosities and masses comparable to 30 Doradus, and we note also that the luminosity of region 41 is comparable to that of the supergiant H II region in M101 (NGC 5461), which has an luminosity uncorrected for extinction of 2.71040 ergs s-1 (Waller, 1990). However, with some significant exceptions such as those highlighted above, most of the NGC 4631 star forming regions are less massive and older than 30 Doradus. Even when the upper limit on is used to correct for internal extinction only 7 regions exhibit luminosities about equal to or exceeding that of 30 Doradus.
A “short term” star formation rate (SFR) averaged over the range in burst times exhibited by the data, i.e. 7.3 Myrs, can be computed using the created masses summed over all 48 apertures and averaged over the four broad bands. This rate is 3.5 M☉ yr-1 which is substantial. As discussed below, it is about equal to the global SFR determined from FIR measurements, and a factor of 7 less than the total SFR measured by Dahlem et al. (1995).
In summary, when the and optical imagery is interpreted in terms of the instantaneous burst paradigm it is obvious that NGC 4631 incorporates exceptionally large star formation activity.
Interpretation of our results in terms of CSF models points to a galaxy of a more ordinary variety. The total average star formation rate determined from the data summed over the 48 apertures for NGC 4631 is 0.33 M☉ yr-1, which is a factor of 2.7 less than than the equivalent NGC 4449 rate (0.88 M☉ yr-1). However, our assumed uncertainty in the mean value of allows our derived SFR to exceed the NGC 4449 rate by a factor of 2. Thus, that part of NGC 4631 which is observable and has incorporated star formation within the past 14 Myr creates stars at a rate comparable to the total rate of the face-on starburst galaxy, NGC 4449. Assuming that the turn-on time was 20 Myr ago, which results in an SFR equal to 0.15 M☉ yr-1, does not change this conclusion. The NGC 4631 results can also be compared to the high rate of 2.4 M☉ yr-1 found by Bruhweiler et al. (1991) when interpreting in terms of a CSF scenario their observations of the star forming regions found in the disk of NGC 1068. Assuming constant star formation, our observations indicate a total mass created in 14 Myr of about 4.6106 M☉, which is less than the mass inferred from the IB model (5.1107 M☉) by a factor of 5.5. This factor increases to 8.4 if the turn-on time was 20 Myr ago.
Dahlem et al. (1995) have related radio continuum observations of the halos of several edge-on galaxies, including NGC 4631, to the rates of supernovae occurring within the galactic disks. The inferred supernova rate for NGC 4631 is 0.23 yr-1. Assuming equilibrium between the birth rate and death rates of supernovae producing stars and a Salpeter (1955) IMF over the mass range between 0.007 and 120 M☉ we find that this result implies a star formation rate of 24 M☉ yr-1.
A significantly smaller rate is derived from the FIR luminosity. For stars with masses greater than 10 M☉
| (5) |
(Sauvage & Thuan, 1992). In the case of NGC 4631, SFRFIR(M☉ 10) = 1.3 M☉ yr-1. Employing the Salpeter IMF described in Section 5, the SFR for stellar masses between 0.007 M☉ and 120 M☉ is 8.1 M☉ yr-1 or 4.5 M☉ yr-1 if 45% of the FIR luminosity is from the diffuse interstellar medium.
The total continuous SFR, summed over the 48 apertures in our data set, 0.33 M☉ yr-1, is far smaller than the rate inferred from Dahlem’s radio observations. It, of course, refers only to the star forming activity delineated by the 48 apertures. If it is assumed that the recorded emission from the whole galaxy arises from star formation, then multiplication of the 0.33 M☉ yr-1 rate by the ratio of the observed flux in the large aperture to the observed flux summed over all 48 small apertures increases the continuous SFR to 2.2 M☉ yr-1, still a very small SFR compared to the Dahlem value but one that approaches the FIR rate.
It is possible that a large portion of the newly created stars are so heavily shielded by dust that there is no indication of their existence in any of our wavelength bands. For example, Bruhweiler et al. (1991) estimate that the emerging UV light from bright knots in the disk of NGC 1068 implies an SFR which is only 7% of the true value. This estimation was based on the relative FIR and UV knot luminosities and the assumption that most of the FIR emission is reprocessed UV radiation from hot stars absorbed and reradiated by interstellar grains. Unfortunately, no far infrared observations of NGC 4631 exist at a spatial scale which would allow the isolation of FIR emission from the galactic background for any of the star formation regions. An alternative procedure for approximating the relative contribution of reprocessed UV radiation in NGC 4631 star-forming regions is to measure the ratio of integrated and FIR luminosities of face-on galaxies. The galaxy M74 (NGC 628) is ideal for this purpose since the required luminosities are known and 0.33 over much of the galaxy (Cornett et al., 1994), a value which is similar to the mean value of the color excesses measured for the NGC 4631 star-forming regions. The ratio of the total integrated FIR luminosity from IRAS measurements (Rice et al., 1988) to the integrated luminosity from UIT measurements (Waller et al., 1997b) is 8.5 (see Table 4). Similar ratios for other face-on galaxies are also listed in Table 4.
It is likely that the dust emitting the radiation is heated in part by the interstellar radiation field, with an approximate contribution to the total heating budget of 45% (Sauvage & Thuan, 1992); though see contrary arguments of Devereux & Young (1992) and Devereux & Scown (1994) who claim that almost all of the radiation is reprocessed emission. Assuming that such processes are occurring in NGC 4631, and adopting the M74 / luminosity ratio of 8.5 (the average / luminosity ratio for the face-on spiral galaxies M83, M101, M74, and M51 is 8.8) and an interstellar to total radiation energy density ratio of 0.45, we find that the SFR determined from the extinction corrected FUV luminosity will be increased by a factor of only 1.21 when taking into account the stellar light absorbed by the interstellar grains. Thus, the total SFR for the 48 star forming regions alone becomes 0.40 M☉ yr-1 with a large uncertainty. If the integrated emission within the large aperture is assumed to arise entirely from star formation then the total estimated SFR in that part of NGC 4631 which we are able to observe becomes 2.7 M☉ yr-1.
The correction is not sensitive to assumptions about the IR heating budget. For example, if all the observed FIR light was reprocessed light from star formation instead of only 55% as we have assumed then the correction factor would increase by only 16%. On the basis of observations of M83 and M101 the uncertainty in the value of R, i.e. the applicable value of the ratio of observed FIR to light, induces an uncertainty in the correction factor of 12%. However, the correction is still quite uncertain since FIR observations of NGC 4631 with spatial resolution comparable to those of the UIT have not been made.
If all the FIR light is reprocessed light, then the SFR inferred from the light in the large aperture becomes 3.1 M☉ yr-1, again with large uncertainties, which should be compared to the SFR computed from the observed FIR emission via relation (5) of 8.1 M☉ yr-1. The result that the SFR summed over the 48 apertures is from factors of 11 to 25 less than the SFR determined from the FIR observations is not surprising considering the edge-on aspect of NGC 4631. Although the amount of created stellar mass differs by a factor of 5.5 there is no reason for distinguishing between the applicability of the IB and CSF models on the basis of the diagnostic diagrams in Figure 4. The fact that the large aperture photometry leads to an SFR about equal to that derived from the FIR within a factor of 2 is surprising, and may indicate that most of the FUV light arises from short term star bursting activity, i.e. that the exclusive application of the CSF model is not appropriate.
By contrast, the SFR inferred from the radio halo (Dahlem et al., 1995) is a factor of at least 5 larger than that associated with either the large aperture FUV photometry or the FIR results (assuming only 55% of the observed FIR is reprocessed FUV light). We speculate that the SFR derived from the radio observations is too large because the assumption of equilibrium between the birth and death rates of the supernovae producing stars is invalid, and that the radio halo is due to a starburst and not continuous star formation.
Finally, to the extent that the IB paradigm is valid, our conclusions regarding the formation of the supershell in NGC 4631 indicates that strong starburst activity has occurred in that part of NGC 4631 approximately 20 Myrs ago.
8 Summary
A far ultraviolet image of the galaxy NGC 4631 centered on 152.1 nm was recorded by the Ultraviolet Imaging Telescope. The image, combined with similar images in the and bands and in and , is used to study star formation in this late type (Sc/SBd) galaxy, viewed nearly edge-on, with the following results.
1. For a disk galaxy seen edge-on, NGC 4631 is extraordinarily bright at wavelengths. The attenuation of light from 48 star forming regions located uniformly along the whole length of the visible galactic disk is low with the mean value of 0.28. Dust is seen silhouetted against the cool star population, and the star forming regions appearing in emission are seen silhouetted against the dust. These facts together with our interpretation of previously measured H I and H II position-velocity curves indicate that the emission arises near the edge of the observable galaxy, as is observed in the face-on Sc/SBc galaxies M101 and M83.
The overall morphology of this edge-on disk galaxy is remarkably similar to that of the so-called chain galaxies that have been recently observed at high redshift, thus implying a similar interpretation for at least some of those distant sources (see Smith et al. (1997)).
2. Photometric data is presented in the form of diagnostic diagrams showing the M, M and M colors plotted against log10(NLyc/L152). The data exhibit considerable dispersion due to errors made in the determination of the relevant background and extinction corrections. Both instantaneous burst (IB) models with burst ages ranging from 2.7 to 10 Myr and continuous star formation (CSF) models with star formation beginning 14 Myr ago and terminating from 0 to 9 Myr ago fit the data equally well. The uncertainties permit the burst ages and turn-off times to be extended 1 to 3 Myrs to earlier times.
3. The ratio of the mean value of determined from the continua of stars to that found from measurements of Balmer Decrements is 0.7, and is thus greater than the value of 0.44 quoted by Calzetti (1997) as being typical of regions exhibiting active star formation. This result is compatible with our conclusion on the basis of emission morphology that the observed star formation is young, i.e. that the stars have not had much time to migrate from their birth site.
4. If the observational results are interpreted with the IB models, the inferred stellar masses created in each star forming region are substantial. As determined by our analysis, the inferred stellar masses of 6 regions exceed the mass of 30 Doradus. Errors permit this number to increase or decrease by up to 20. The region of the second largest derived mass, 2.7106 M☉ , incorporates the bright H II region CM 67 and is associated with a giant molecular cloud, both of which have been tentatively identified with the tip of a bar (Roy et al., 1991). Of these 6 regions, none exhibit luminosities equal to that of 30 Doradus. Photometric uncertainties permit this number to increase to 3. The luminosity of region 41 is comparable to that of the supergiant H II region in M101 (NGC 5461). The total created stellar mass deduced from the light emitted from the star forming regions is 2.6107 M☉ to within a factor of 2.3, which is about equal to the stellar mass (2.4107 M☉) of the UV emitting knots in the disk of NGC 1068 (Bruhweiler et al., 1991) and is a factor of 5 greater than the stellar mass (5.2106 M☉) associated with the emitting knots in NGC 4449 (Hill et al., 1994). Using the range in burst times of 7.3 Myrs, we derive an average “short term” star formation rate of 3.5 M☉ yr-1.
5. Based on previously obtained data, application of the shell generation theory of McCray & Kafatos (1987) shows that the number of supernova producing stars which could generate the 3 kpc diameter ring of and H I emission near the east end of the galactic image is 5.3104, which is somewhat greater than the range (1 to 3.5)104 estimated by Rand & van der Hulst (1993) based on the dynamics of a hydrogen supershell surrounding the stellar ring. While this number is extraordinarily large, it is comparable to the same number, 1.3104, associated with the intense star forming region delineated by aperture 20, a region that includes the giant H II region CM67. Those FUV bright regions on and within the periphery of the large shell (apertures 3 through 16) must represent second generation star formation, and this conclusion together with the shell analysis implies that strong star formation occurred approximately 20 Myrs ago in that part of NGC 4631 incorporating the large shell.
6. Analysis of the , , , and photometry in the context of the CSF paradigm yields a total SFR for the 48 individual star forming regions equal to 0.33 M yr-1, uncertain by a factor of 8.2. Approximate accounting for UV light which is absorbed by interstellar grains leads to a corrected rate of 0.40 M yr-1. Under the assumption that 55% of the observed FIR is from reprocessed light this corrected rate is about a factor of 11 less than the SFR inferred from the measured total (4.5 M☉ yr-1), which is not surprising considering the edge-on aspect of NGC 4631. If the observed light integrated over that part of the galaxy we are able to observe is assumed to arise in constant star formation, then the SFR equals 2.6 M☉ yr-1 when approximate accounting for the reprocessing of light by interstellar grains is taken into account. This is a surprising result in that one would expect the SFR inferred from the integrated data to be significantly less than the global SFR determined from the FIR observations, and the photometric uncertainties exacerbate the problem. We interpret this paradox to indicate that the emission should not be seen exclusively in terms of the CSF model, but that much of the observed global light arises in star bursts. This interpretation is consistent with the inference of star bursting activity near the galactic center drawn by Golla & Wielebinski (1994) and in an inner disc (r50) by Duric et al. (1982).
References
- Aaronson (1978) Aaronson, M. 1978, PASP, 90, 28
- Bohlin et al. (1983) Bohlin, R. C., Cornett, R. H., Hill, J. K., Smith, A. M., & Stecher, T. P. 1983, ApJ, 274, L53
- Bohlin et al. (1978) Bohlin, R. C., Savage, B. D., & Drake, J. F. 1978, ApJ, 224, 132.
- Bothun & Thompson (1988) Bothun, G. D., Thompson, I. B. 1988, AJ, 96, 877
- Braine et al. (1995) Braine, J., Krugel, E., Sievers, A., & Wielebinski, R. 1995, A&A, 295, L55
- Bruhweiler et al. (1991) Bruhweiler, F. C., Truong, K. Q., & Altner, B. 1991, ApJ, 379,596
- Burstein & Heiles (1984) Burstein, D., & Heiles, C. 1984, ApJS, 54, 33
- Calzetti (1997) Calzetti, D. 1997, in AIP Conf. Proc. 408, The Ultraviolet Universe at Low and High Redshift: Probing the Progress of Galaxy Evolution, ed. W. H. Waller, M. N. Fanelli, J. E. Hollis, & A. C. Danks (Woodbury: AIP),403
- Calzetti et al. (1994) Calzetti, D., Kinney, A. L., & Storchi-Bergmann, T. 1994, ApJ, 429, 582
- Code & Welch (1982) Code, A. D. & Welch, G. A. 1982, ApJ, 256,1
- Combes (1978) Combes, F. 1978, A&A, 65,47
- Cornett et al. (1994) Cornett, R. H., O’Connell, R.W., Greason, M. R., Offenberg, J. D., Angione, R. J., Bohlin, R. C., Cheng, K. P., Roberts, M. S., Smith, A. M., Smith, E. P., Talbert, F. D., & Stecher, T. P. 1994, ApJ, 426, 553
- Crillon & Monnet (1969) Crillon, R. & Monnet, G. 1969, A&A, 2, 1
- Cowie et al. (1995) Cowie, L. L., Hu, E. M., & Songaila, A. 1995, AJ, 110, 1576
- Dahlem et al. (1995) Dahlem, M., Lisenfeld, U., & Golla, G. 1995, ApJ, 444, 119
- Devereux & Young (1992) Devereux, N. A., Young, J. S. 1992 AJ, 103, 784
- Devereux & Scown (1994) Devereux, N. A., Scowen, P. A. 1994 AJ, 108, 1244
- de Vaucouleurs et al. (1991) de Vaucouleurs, G., de Vaucouleurs, A., Corwin, H.G., Buta, R.J., Paturel, G., & Fouque, P. 1991, Third Reference Catalogue of Bright Galaxies (RC3) (New York: Springer-Verlag).
- Duric et al. (1982) Duric, N., Crane, P. C., & Seaquist, E. R. 1982, AJ, 87, 1671
- Fanelli et al. (1988) Fanelli, M. N., O’Connell, R. W., & Thuan, T. X. 1988, ApJ, 334, 665
- Feldmeier & Ciardullo (1997) Feldmeier, J. J., & Ciardullo, R. 1997, ApJ, 479, 231
- Fitzpatrick (1985) Fitzpatrick, E. L. 1985, ApJ, 299, 219
- Golla & Hummel (1994) Golla, G. & Hummel, E. 1994, A&A, 284, 777
- Golla & Wielebinski (1994) Golla, G. & Wielebinski, R. 1994, A&A, 286, 733
- Greason et al. (1994) Greason, M. R., Offenberg, J. D., Cornett, R. H., Hill, R. S., & Stecher, T. P. 1994, PASP, 106, 1151
- Hill et al. (1994) Hill R.S., Home A. T., Smith A. M., Bruhweiler, F. C., Cheng, K. P., Hintzen, P. M. N., & Oliversen, R. J. 1994, ApJ, 430, 568
- Home (1997) Home, A. T. 1997, Ph.D. Thesis, Catholic University of America.
- Kennicutt (1984) Kennicutt, R. C. 1984, ApJ, 287, 116
- Klemola (1962) Klemola, A. 1962, AJ, 67, 740
- Kurucz (1991) Kurucz, R. L. 1991, in The Stellar Populations of Galaxies, ed. B. Barbuy & A. Renzini (Dordrecht: Kluwer), 225
- Landsman (1992) Landsman, W. 1992, private communication
- Lasker et al. (1990) Lasker, B. M., Sturch, C. R., McLean, B. J., Russell, J. L., & Jenker, H. 1990, AJ, 99, 2019
- Lequeux et al. (1981) Lequeux, J., Maucherat-Joubert, M., Deharveng, J. M., & Kunth, D. 1981, A&A, 103, 305
- McCray & Kafatos (1987) McCray, R. & Kafatos, M. 1987, ApJ, 317, 190
- Meynet et al. (1994) Meynet, G., Maeder, A., Schaller, G., Schaerer, D. & Charbonnel, C. 1994, A&A, 103, 97
- Pierce (1994) Pierce, M. J. 1994, ApJ, 430, 53
- Rand et al. (1992) Rand, R. J., Kulkarni, S. R., & Hester, S. J. 1992, ApJ, 396,97
- Rand & van der Hulst (1993) Rand, R. J., & van der Hulst, J. M. 1993, AJ, 105, 2098
- Rand’s (1994) Rand, R. J. 1994, A&A, 285, 833
- Rand & Stone (1996) Rand, R. J., & Stone, J. M. 1996, AJ, 111, 190
- Rice et al. (1988) Rice, W., Lonsdale, C. J., Soifer, B. T., Neugebauer, G., Kopan, E. L., Lloyd, L. A., de Long, T., & Habing, H. J. 1988, ApJS, 68, 91
- Roy et al. (1991) Roy, J. R., Wang, J., & Arsenault, R. 1991, AJ, 101, 825
- Salpeter (1955) Salpeter, E.E. 1955, ApJ, 121, 161
- Sauvage & Thuan (1992) Sauvage, M. & Thuan, T. X. 1992, ApJ, 396, L73
- Seaton (1979) Seaton, M. 1979, MNRAS, 187, 73P
- Sharina et al. (1996) Sharina, M. E., Karachetsev, D., & Tikhonov, N. A. 1996, A&A, 119, 499
- Smith et al. (1997) Smith, A. M., Collins, N. R., Waller, W. H., Fanelli, M. N., & Stecher, T. P. 1997, in AIP Conf. Proc. 408, The Ultraviolet Universe at Low and High Redshift: Probing the Progress of Galaxy Evolution, ed. W. H. Waller, M. N. Fanelli, J. E. Hollis, & A. C. Danks (Woodbury: AIP), 439
- Sofue et al. (1990) Sofue, Y., Handa, T., Golla, G., & Wielebinski, R. 1990, PASJ, 42, 745
- Sofue et al. (1989) Sofue, Y., Handa, T., & Nakai, N. 1989, PASJ, 41, 937
- Stecher et al. (1992) Stecher, T. P. et al. 1992, ApJ, 395, L1
- Stecher et al. (1997) Stecher, T. P. et al. 1997, PASP, 109, 584
- Stone (1977) Stone, R. 1997, ApJ, 218, 767
- Waller (1990) Waller, W. H., 1990, Ph.D. Thesis, University of Massachusetts
- Waller et al. (1997a) Waller, W. H, Bohlin, R. C., Cornett, R. H., Fanelli, M. N., Freedman, W. L., Hill, J. K., Madore, B. F., Neff, S. G., Offenberg, J.D., O’Connell, R.W., Roberts, M.S., Smith A. M., & Stecher, T. P. 1997a, ApJ, 481, 169
- Waller et al. (1997b) ———-, Fanelli, M. N., Collins, N. R., Cornett, R. H., Offenberg, J. D., Marcum, P. M., Stecher, T. P., & the UIT Science Team 1997b, in AIP Conf. Proc. 408, The Ultraviolet Universe at Low and High Redshift: Probing the Progress of Galaxy Evolution, ed. W. H. Waller, M. N. Fanelli, J. E. Hollis, & A. C. Danks (Woodbury: AIP), 39
- Wang et al. (1995) Wang, Q. D., Walterbos, R. A. M., Steakley, M. F., and Norman, C. A. 1995, ApJ, 439, 176
- Weliachew et al. (1978) Weliachew, L., Sancisi, R., and Guelin, M. 1978, A&A, 65, 37
- Zombeck (1990) Zombeck, M. V. 1990, Handbook of Astronomy and Astrophysics, Second Edition (Cambridge, UK: Cambridge University Press).
![[Uncaptioned image]](/html/astro-ph/0009138/assets/x3.png)
Histograms showing distribution of values of each star forming region. Red line: distribution based on the measured Balmer Decrements. Black line: distribution based on the difference between modeled colors and observed colors. Single Gaussian fits yield mean values of equal to 0.39 mag and 0.28 mag respectively, indicated by vertical dashed lines. The 2 width of the Gaussian function fitted to the distribution represented by the black line is 0.36 mag.


| Instrument | Date | Exposure | Bandpass | Resolution |
|---|---|---|---|---|
| (seconds) | (FWHM) | |||
| UIT | 03/10/1995 | 1140 | FUV, 152.1/35.4 nm | 3.4″ |
| Kitt Peak 0.9m | 05/16/1996 | 600 | U | 3.0″ |
| 05/16/1996 | 300 | B | 1.6″ | |
| 05/16/1996 | 300 | V | 1.1″ | |
| 05/16/1996 | 180 | R | 1.6″ | |
| PalomaraaThe H data was provided by Dr. R. J. Rand. See Rand et al. (1992). 1.5m | 05/1990 | 2000 | H, 658.5/1.5 nm | 1.2″ |
| Mt. Laguna | 05/23/1996 | 600 | H, 487.8/5.0 nm | 4.5″ |
| Name | ABaaForeground Galactic extinction: NGC 4631, NGC 628, NGC 5194, Burstein and Heiles 1984; NGC 5236, AND NGC 5457, Hill et al.(1994). | DistancebbNGC 5236, Pierce (1993); NGC 5457 and NGC 5194, Feldmeir and Ciardullo (1997); NGC 628, Sharina (1996). | LFUVccExcept for NGC 4631, luminosities are computed from Waller (1997b), and are adjusted for the distances given in Table 4. | LIRddIRAS luminosities are from (Rice et al. 1988) and are adjusted for distances given in Table 4. | LIR/LFUV |
|---|---|---|---|---|---|
| (Mag) | (Mpc) | L☉ | L☉ | ||
| NGC 4631 | 0.02 | 7.5 | 6.99108 | 9.34109 | 13.40 |
| NGC 5236 (M83) | 0.14 | 4.8 | 8.68108 | 1.201010 | 13.80 |
| NGC 5457 (M101) | 0.12 | 7.7 | 2.77109 | 1.121010 | 4.04 |
| NGC 628 (M74) | 0.12 | 7.8 | 3.34108 | 2.85109 | 8.53 |
| NGC 5194 (M51) | 0.00 | 8.4 | 1.23109 | 1.081010 | 8.78 |