IONIZED GAS IN DAMPED Ly PROTOGALAXIES: I. MODEL-INDEPENDENT INFERENCES FROM KINEMATIC DATA
Abstract
We investigate the kinematics of ionized and neutral gas in a sample of 35 damped Ly systems (protogalaxies) using accurate quasar spectra obtained with HIRES, the Echelle spectrograph on the Keck I 10 m telescope. Velocity profiles with resolution of 8 km s-1 are obtained for high ions such as C IV and Si IV, and for intermediate ions such as Al III. Combining these profiles with similar quality profiles obtained previously for low ions such as Fe II, we investigate the kinematic state of damped Ly protogalaxies in the redshift range 1.8 4.4 by comparisons between data for various ion pairs.
We find the damped Ly protogalaxies comprise distinct kinematic subsystems: a low ion subsystem in which the low ions are physically associated with intermediate ions, and a high ion subsystem containing neither low nor intermediate ions. The evidence for two subsystems stems from (a) differences between the widths of the velocity profiles, (b) misalignment in velocity space between the narrow components that make up the profiles in each subsystem, and (c) significant dissimilarities between the mean velocities of the high ion and low ion velocity profiles. In every case we find that test statistics such as velocity width and various asymmetry parameters distribute differently for low ions than for high ions. We also find the absence of intermediate and low ions from the high-ion subsystem to indicate the latter is optically thin at the Lyman limit.
Despite misalignment between their velocity components, the low and high ion kinematic subsystems are interrelated. This is indicated by detection of a statistically significant C IV versus low ion cross correlation function. It is also indicated by a systematic effect where the C IV velocity widths are greater than or equal to the low ion velocity widths in 29 out of 32 systems. These phenomena are consistent with the location of the two subsystems in the same potential well.
accepted by the Astrophysical Journal August 5, 2000
1 INTRODUCTION
For the past several years we have been studying the kinematics of gas in damped Ly systems. We have focused on the neutral gas (Prochaska & Wolfe 1997; 1998: hereafter PW1, PW2) because of evidence suggesting this to be the source of baryons for stars in current galaxies (Wolfe 1995, 1997; Kauffmann 1996). We used the HIRES Echelle spectrograph (Vogt, 1994) on the Keck I 10 m telescope to obtain accurate velocity profiles of low ions such as Fe II, Si II, Ni II, and Al II as they trace the kinematics of the neutral gas. The evidence for this is the large Al II/Al III ratios detected in most damped Ly systems, which indicate the singly ionized species to be associated with neutral rather than ionized gas, provided the ionizing radiation is supplied by external sources (Prochaska and Wolfe, 1996).
The low-ion velocity profiles that we have measured comprise multiple narrow components that are not randomly distributed in velocity space. Rather the strongest component tends to occur at the profile edge. In PW1 and PW2 we used these properties to test various models for damped Ly systems. We adopted Monte Carlo techniques by sending random sightlines through gaseous configurations specified by the cosmological model, the geometry and physics of the configuration, etc. We then computed distributions of test statistics such as the profile line widths and compared them with the empirical distributions. We first tested a simple model in which dark-matter halos halos enclose identical randomly oriented exponential disks with rotation speeds 250 km s-1 and exponential scale-height 0.3, where is the radial scale-length (PW1). We found this model to satisfy all the statistical tests. Its principal disadvantage, however, is it is not set in a cosmological context. We then tested semi-analytic versions of standard adiabatic CDM cosmologies (SCDM) in which the neutral gas is confined to centrifugally supported disks in dark matter halos drawn from a computed mass function. The predominance of objects with low-mass and low , results in line widths that are too low to match the observed distribution which extends to 300 km s-1 . In particular, the SCDM models considered by Kauffmann (1996) were found to be incompatible with the kinematic data. Furthermore, Jedamzik & Prochaska (1998) showed that no CDM cosmology is consistent with models assuming the damped Ly systems to be single centrifugally supported disks within dark-matter halos. On the other hand Haehnelt et al. (1998) numerically simulated SCDM models with gas and dark matter, and found that at 2 the damped Ly gas was distributed in low-mass protogalactic clumps rather than centrifugally supported disks. The combination of infall and chaotic motions apparently reproduce the kinematic data.
This paper focuses on the kinematics of the ionized gas. Our aim is to place further constraints on galaxy formation models by studying gas located outside the neutral zones giving rise to damped Ly lines. Ionized gas is a generic feature of such models because initially the baryons are heated and ionized as they virialize in the potential wells of dark-matter protogalactic halos. However, the indicated velocity field is not unique, with some models predicting radial collapse to neutral disks (Mo & Miralda-Escud 1996) , while others envision chaotic motions of ionized and neutral blobs (Haehnelt et al. 1997). As a result, determining the velocity structure of the ionized gas should help to clarify crucial events in the galaxy formation process (see accompanying paper by Wolfe & Prochaska 2000; hereafter paper II).
In order to trace the velocity structure of the ionized gas we used HIRES to obtain accurate velocity profiles of the C IV, Si IV, and Al III ions; these are shown in 2. Throughout this paper we assume the C IV ion to represent the highly ionized gas, since we have a larger number of accurate C IV than Si IV velocity profiles. In 3 we construct frequency distributions of the profile line width, , for each ion. We compare these with each other and with the distribution for low ions such as Fe II or Si II which presumably trace the kinematics of the neutral gas. To further intercompare the low ion and high ion gas we examine correlations between the kinematics of low ions and high ions. To that end we consider the difference between the means of low ion and C IV profiles. We also consider the ratios of the ’s for various ion pairs. We then cross-correlate the velocity profiles of various ionic pairs. In 4 we present model-independent conclusions following from our results.
| Transition | ||||||
|---|---|---|---|---|---|---|
| QSO | C IV | Si IV | Al III | Low | Ref. | |
| Q01001304 | 2.309 | 1548 | 1393 | 1854 | Ni II 1741 | WaaData collected by our group |
| Q014933 | 2.14075 | 1548 | 1393 | 1854 | Fe II 1608 | W |
| Q02013634 | 2.4628 | 1550 | 1393 | 1862 | Si II 1808 | W |
| Q0216+0803bbC IV profiles exhibit some saturation | 2.2930 | 1550 | — | 1862 | Si II 1808 | SccData kindly provided by W. L. W. Sargent and collaborators |
| Q03473800 | 3.0247 | 1548 | 1393 | — | Fe II 1608 | W |
| Q0458020 | 2.03955 | — | — | 1854 | Cr II 2056 | W |
| Q05282505AddThe damped system toward Q05282505 was omitted because its redshift exceeds that of the background QSO to which it may be associated. | 2.14104 | 1550 | — | — | Si II 1808 | S |
| Q08410203A | 2.374518 | 1548 | — | 1854 | Ni II 1741 | W |
| Q08410203B | 2.476219 | 1548 | 1393 | 1854 | Fe II 1608 | W |
| Q093028 | 3.23525 | 1548 | 1393 | — | Fe II 1608 | S |
| Q095104A | 3.85669 | — | 1393 | — | Si II 1526 | W |
| Q1055+46 | 3.3172 | 1548 | —- | — | Fe II 1608 | S |
| Q110418 | 1.661375 | 1550 | — | 1854 | Si II 1808 | S |
| Q1108-07 | 3.607619 | 1548 | 1402 | — | Fe II 1608 | W |
| Q12020725 | 4.38285 | 1548 | 1393 | — | Si II 1304 | S |
| Q1215+3322 | 1.9991 | 1548 | 1393 | 1854 | Si II 1808 | W |
| Q122317 | 2.466083 | 1550 | 1402 | 1862 | Si II 1808 | S |
| Q1331+1704aaData collected by our group | 1.77636 | 1550 | — | 1854 | Si II 1808 | W |
| Q1425+6039 | 2.8268 | 1550 | 1402 | — | Fe II 1608 | S |
| Q17597500 | 2.6253 | 1550 | — | 1854 | Si II 1808 | W |
| Q185040 | 1.99016 | — | — | 1862 | Zn II 2026 | S |
| Q1946+7658A | 1.7382 | 1548 | — | 1854 | Si II 1808 | S |
| Q1946+7658B | 2.8443 | 1550 | 1402 | — | Si II 1304 | S |
| Q22061958AaaData collected by our group | 1.920 | 1548 | — | 1854 | Ni II 1741 | W |
| Q22061958B | 2.07623 | 1550 | 1402 | — | Al II 1670 | W |
| Q22121626 | 3.6617 | 1548 | 1402 | — | Si II 1304 | S |
| Q223002 | 1.858536 | 1550 | 1402 | 1862 | Si II 1808 | W |
| Q22310015 | 2.06615 | 1548 | 1393 | 1854 | Si II 1808 | WS |
| Q223313 | 3.14927 | 1548 | 1402 | — | Fe II 1608 | S |
| Q22370608 | 4.0803 | 1548 | 1393 | — | Al II 1670 | S |
| Q234312 | 2.42969 | 1550 | 1393 | 1854 | Si II 1808 | S |
| Q234412 | 2.537789 | 1548 | 1402 | — | Al II 1670 | S |
| Q23481400aaData collected by our group | 2.2794 | 1548 | 1393 | 1862 | Fe II 1608 | W |
| Q23590203AaaData collected by our group | 2.095067 | 1550 | — | 1854 | Si II 1808 | W |
| Q23590203B | 2.153934 | 1550 | — | 1862 | Si II 1526 | W |
2 DATA: OBSERVED VELOCITY PROFILES
Table 1 lists the sample of damped Ly systems for which we have obtained velocity profiles. The spectra were acquired with HIRES at a resolution with FWHM 68 km s-1 and were reduced according to procedures outlined in PW1 and PW2. The coordinate name of the background QSO is in column 1. Column 2 specifies the absorption redshift of the damped system. The entries in columns 35 contain the specific C IV, Si IV, and Al III transitions used in our analysis. Entries with horizontal lines indicate that statistically significant profiles were not observed. Column 6 lists the low ion transitions used in our analysis and Column 7 gives the data references. Here and throughout the paper, the term low ion refers to ions such as Fe II and Si II, the dominant ionization states in neutral gas with large optical depths at the Lyman limit , i.e., 104. The ionization potential (IP) of such ions is greater than 1 Ryd, i.e. 13.6 eV, while the IP of the next lower state (typically the neutral atom except for O) is less than 1 Ryd. The term high ion refers to ions where the next lower state has IP 1 Ryd, for example Si IV and C IV. Photoionization studies show these ions to be in gas which is optically thin at the Lyman limit or in gas with moderate Lyman-limit optical depths ( 102). Finally, we introduce the term intermediate ions to describe those ions where the next lower ionization state has IP 1 Ryd (e.g. Al III). The same photoionization studies show that at column densities required for detection (i.e. above 1014cm-2) these ions arise in gas which is optically thick at the Lyman limit. As a result, association of high ions with intermediate ions indicates the gas is optically thick at the Lyman limit.
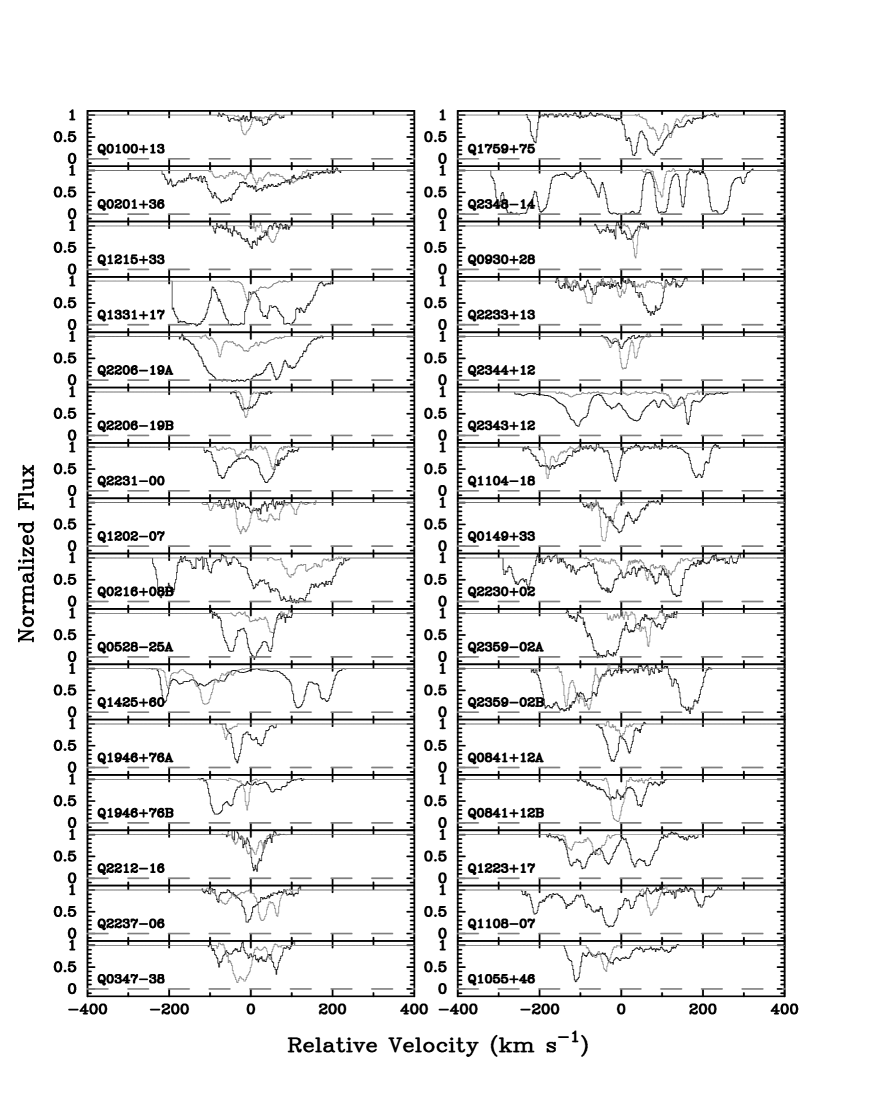
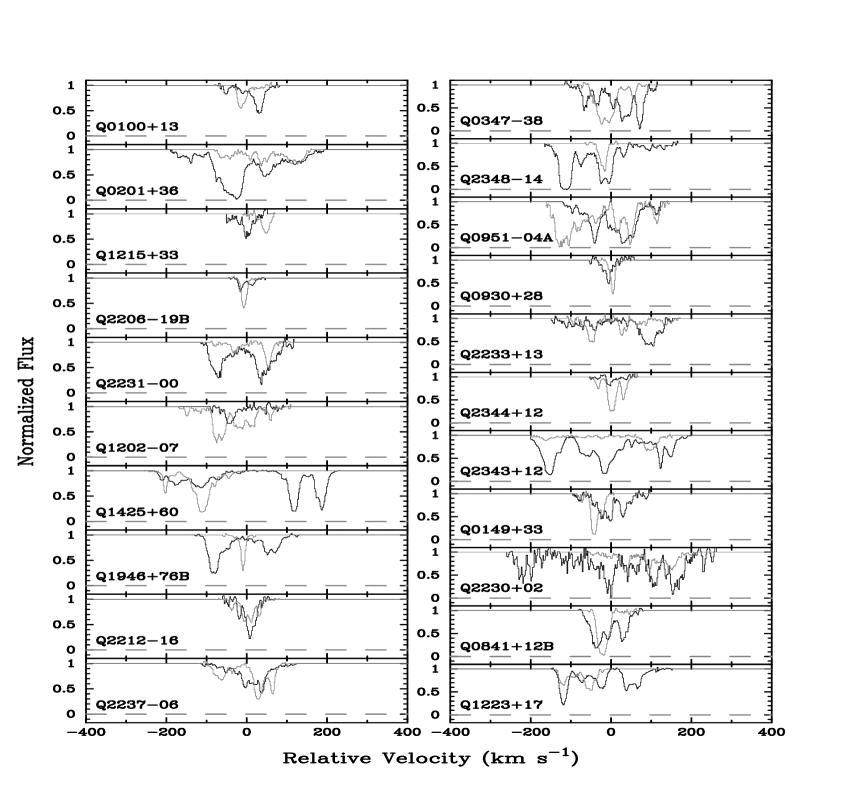
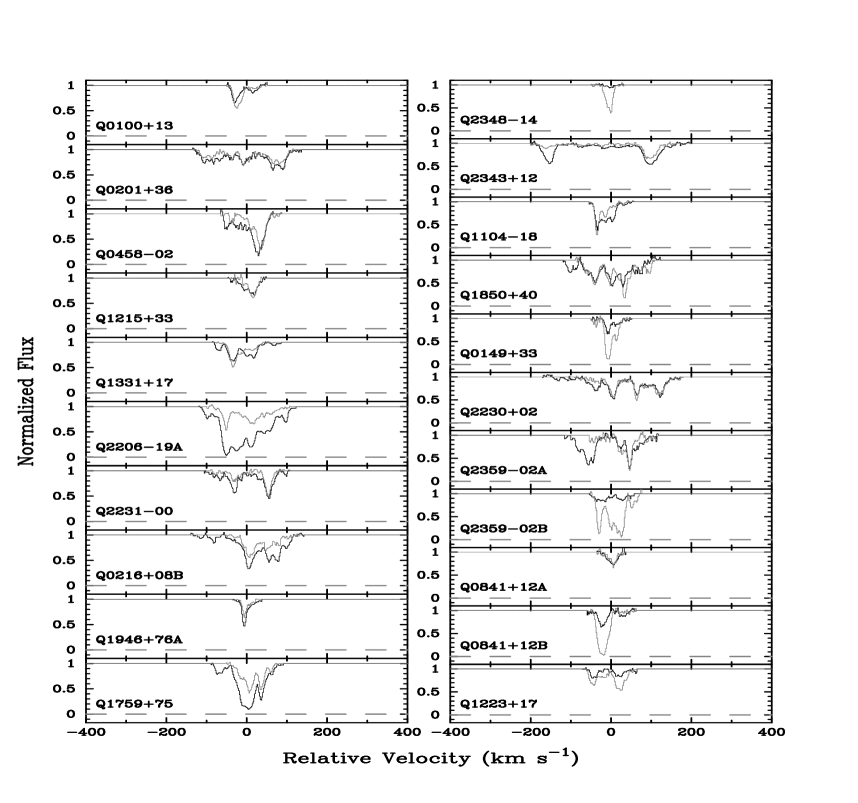
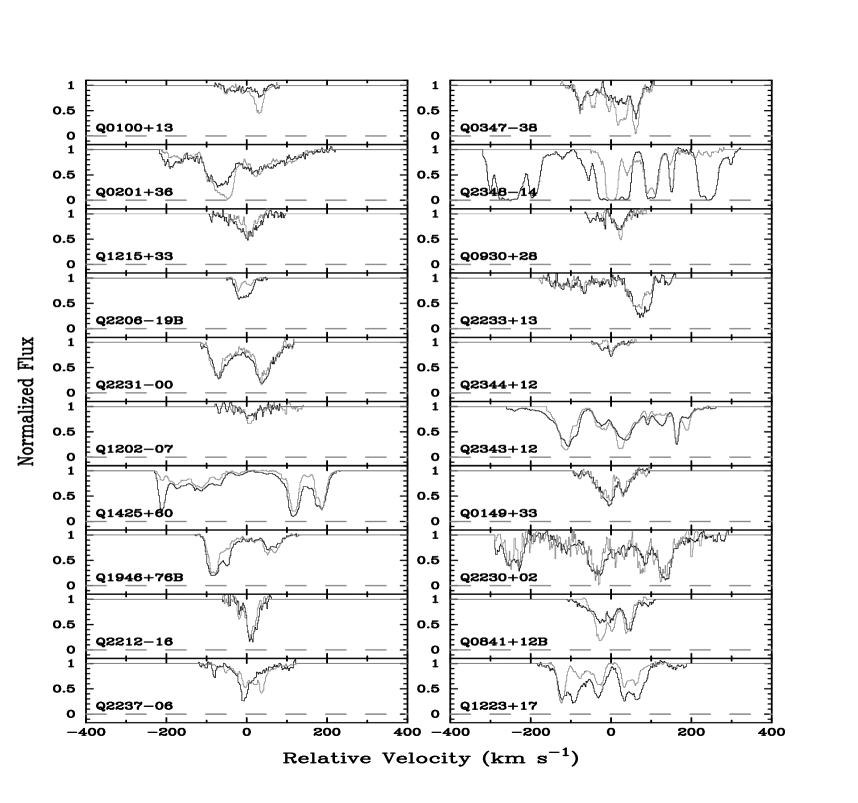
The velocity profiles are shown in Figures 1 5 which plot flux versus velocity, where the flux, , is normalized to unit continuum. In Figures 1 3 we compare C IV, Si IV, and Al III with the corresponding low ion profiles. The dark curves depict the high and intermediate ions and the grey curves depict the low ions. Figure 4 compares the C IV (dark curves) and Si IV (grey curves) profiles, and Figure 5 compares C IV (dark curves), Al III (light curves), and the low ions (grey curves). In all cases, = 0 km s-1 corresponds to the redshifts in Table 1. The low ion transitions were selected on the basis of criteria outlined in PW1 and PW2; i.e., for high signal-to-noise ratios and absence of saturation. The high ion transitions were selected according to the same criteria, where possible. In some cases the only transitions available exhibit saturation over sizable velocity intervals. The C IV profiles toward Q021608B, Q133117, Q220619A, Q234814, and Q235902A contain significant regions in velocity space with strong saturation. The same is true for the Si IV profile toward Q234814. As emphasized in PW1, some of the statistical tests used to compare the data with model predictions are sensitive to saturation; in particular determination of test statistics measuring the profile asymmetries can be inaccurate in the presence of saturation. However, the results of statistical tests described below did not change qualitatively when the saturated C IV profiles were excluded from the sample. As a result the saturated profiles shall be included in all subsequent analysis.

The velocity profiles leave the following impressions:
In common with the low ion profiles, the intermediate and high ion profiles exhibit a multi-component structure comprising several narrow components spanning a wide range of velocity intervals.
The C IV and low ion profiles in Figure 1 are kinematically disjoined. In many cases strong C IV absorption components are at velocities where low ion absorption is weak or absent. In other cases C IV absorption is weak or absent at velocities where low ion absorption is strong. In many cases the velocity centroids of the C IV and low ion profiles appear to be significantly different.
Despite their differences, the C IV and low ion velocity profiles overlap in velocity space in such a way that the low ion profiles generally lie within the high ion profiles.
The low ion profiles also appear to be kinematically disjoined from the Si IV profiles (see Figure 2).
The Al III and low ion profiles appear to be strongly correlated (Figure 3).
The C IV and Si IV profiles appear to be strongly correlated (Figure 4).
In many cases C IV absorption occurs in regions of velocity space that are free of Al III and low ion absorption (Figure 5).
In most cases the velocity widths of C IV and Si IV velocity profiles exceed the velocity widths of the Al III and low ion profiles.
Although the low ion and high ion velocity profiles exhibit “edge-leading” asymmetries in which the strongest velocity components are at the profile edges, the high ions tend to exhibit peaks at both edges more often than the low ions.
In the sections that follow, we introduce several tests to quantify these phenomena.
3 TEST STATISTICS
3.1 Distributions for single ions
To describe the kinematics of the gas in a quantitative manner, we consider test statistics that characterize the extent and shape of the velocity profiles. We discuss distributions of such statistics drawn from the profiles corresponding to given ions and then compare them. These empirical distributions are used to test theoretical models in paper II.
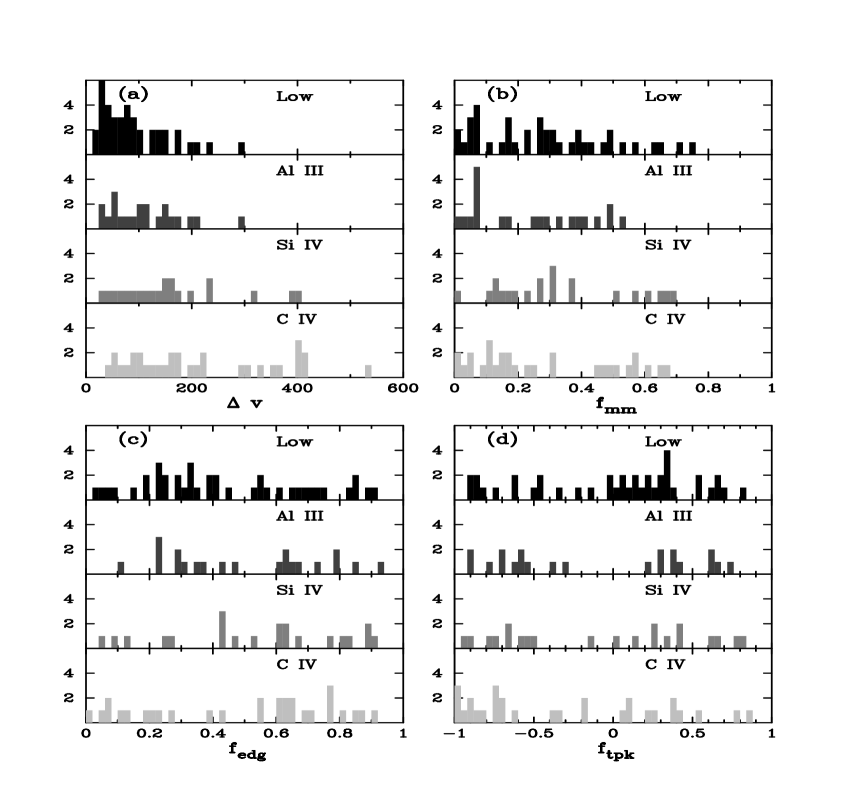
In PW1 we characterized the extent and asymmetry of the velocity profiles with four test statistics. Briefly stated they are:
(1) , the velocity interval enclosing the central 90 of the integrated optical depth, , where ln[1/].
(2) , the “mean-median statistic” given by /(/2), where and are the median and mean velocities of the profiles.
(3) , the “edge statistic” given by /(/2), where is the velocity of the absorption component with peak optical depth.
(4) , the “two-peak statistic” given by
/(/2), where
is the velocity of the component with second strongest peak optical-depth:
is
negative if and positive if 0 .
If necessary
the optical depth profiles have been reflected in velocity space in such
a way that is always located at .
Distributions for each test statistic are illustrated in Figure 6 for the low ion, Al III, Si IV, and C IV transitions. In PW1 and PW2 we focused on the low ion distributions. We used them to argue in favor of models in which the low ions were confined to rapidly rotating disks (rotation speeds 250 km s-1 ) and to rule out several other models. We return to this topic in paper II. Here we check the null hypothesis that low ion and high ion kinematics stem from the same process. We do this by computing , the Kolmogorov-Smirnov probability that each high ion or intermediate-ion test statistic is drawn from the same parent population as the corresponding low ion statistic. Figure 6 shows that the null hypothesis cannot be dismissed, with two exceptions. First, the null hypothesis is highly unlikely when comparing low ion versus C IV distributions of since ()= 0.002, and when comparing low ion versus Si IV distribution of since () = 0.021: the high ions do not exhibit as much power at low as the low ions, and more power than the low ions at 200 km s-1 . Indeed, the low probabilities suggest the low ions and high ions are in two distinct kinematic subsystems. Secondly, the null hypothesis is unlikely in the case of low ion versus C IV distributions of because () = 0.035; i.e., the C IV profiles display more double peaked profiles than the low ions. On the other hand () = 0.23 in the case of low ion versus Si IV profiles. Since compatibility of the Si IV and low ion distributions of cannot not be ruled out, this is the only case in which the C IV and Si IV kinematics differ. We suspect that statistics of small numbers may be affecting the Si IV distribution, a possibility we will test when larger samples become available.
3.2 Correlations Between Macroscopic Kinematic Properties of Ion Pairs
We now turn to correlations between kinematic properties of gas in different ionization states. First we consider distributions of the following new test statistic:
(5) = (ion ) (ion ), i.e., the difference between the means of the velocity profiles of ion and ion .
Figure 7a shows the distribution of when and are (i) low ion and C IV, (ii) C IV and Al III, (iii) C IV and Si IV, and (iv) low ion and Al III. Not surprisingly, the distribution widths are narrower f or C IV versus Si IV and low ion versus Al III than for low ion versus C IV. This just indicates that the high ion subsystem includes the high ions C IV and Si IV, but not the intermediate Al III ions which are mainly associated with the low ion subsystem. The standard deviations for the 3 distributions are given in Table 2. Although the dispersion of the low ion versus C IV distribution is relatively high, = 67 km s-1 , it is sufficiently low to place crucial restrictions on most models (see paper II).

| Dispersion | C IV versus Low | C IV versus Si IV | Al III versus Low |
|---|---|---|---|
| aaOne sigma error in computed by assuming (n1)s is distributed as (n1) where n is the number of degrees of freedom, (n1) is for n degrees of freedom, and where s2 and are the measured and true variance of (Frodesen et al. 1979) (km s-1 ) | 67.08.2 | 23.23.4 | 30.04.2 cr |
| Kendall | ||||
|---|---|---|---|---|
| ION | C IV | Si IV | Al III | Low |
| C IV | … | 0.800.16 | 0.570.16 | 0.330.16 |
| Si IV | … | … | 0.760.22 | 0.520.15 |
| Al III | … | … | …. | 0.730.16 |
Next we consider correlations between the of various ion pairs. In Figure 8a we plot , the inferred from the C IV profiles versus , the inferred from the low ion profiles. In Figures 8b and 8c we do the same for versus , the velocity width of Si IV, and , the velocity width of Al III versus . The figure shows to be correlated with and with . This is demonstrated in Table 3 showing the Kendall correlation coefficients. The only cases with statistically significant (i.e., at the 5 level) are for the C IV versus Si IV correlation and the Al III versus low ion correlation. We conclude that statistically significant correlations exist between and , and between and . Evidence for such correlations within the remaining ion pairs is marginal. On the other hand Figure 8a shows that for all but 3 objects, , and even the three exceptions nearly satisfy this relation. In other words the low ion velocity width acts as a “floor” to the high ion velocity widths. While not a correlation, this is an important systematic effect indicating that the high ion and low ion systems are interrelated in a way that must be accounted for by models of the ionized gas.

The relationship between the velocity widths is quantitatively described by the test statistic:
(6) /, the ratio of the velocity widths of ion to those of ion .
The corresponding distributions are shown in Figure 7b. Notice how the for low versus C IV and C IV versus Al III are uniformly distributed at 0.7 3, while the C IV versus Si IV and low versus Al III distributions exhibit significant peaks at = 1. This is further evidence for an association between Al III and low ions, and between C IV and Si IV.
We searched for evidence that other test statistics were correlated between the different ion pairs. None was found, with the possible exception of correlations between the Al III and low ion which exhibit Kendall coefficients at the 3.0 level. Correlations between between the C IV and Si IV were found at the 2.5 level. We also checked for correlations between pairs of test statistics corresponding to a given ion. Ledoux et al. (1998) reported evidence for a low ion correlation between and out to = 150 km s-1 , but found no such correlation at 150 km s-1 . They claimed the “break” at 150 km s-1 argued against the presence of damped Ly systems comprised of disks with rotation speeds greater than 150 km s-1 . It is difficult to assess the validity of their claim since no quantitative estimate was given for the significance of the correlation. With our larger data set (39 versus their 26 systems) we find evidence for such a correlation at the 3.6 level, but no convincing evidence for a “break” at 150 km s-1 . In fact when systems with 150 km s-1 were eliminated, the significance level of the correlation decreased to 2.8. This argues against the presence of such a “break” and is consistent with a correlation extending to 250 km s-1 . As a result disks with rotation speeds exceeding 150 km s-1 cannot be ruled out. In any case, the correlation between and is tentative (see Figure 9), and needs to be tested with larger data sets.

3.3 Cross Correlation Functions
We next investigate whether the detailed component structures exhibited by the velocity profiles of various ions are correlated. In Figure 7c we plot , the cross-correlation functions between ions and versus lag velocity , and the 1 errors, . The are given by
| (1) |
where the first sum is over profiles, and the second is over velocity channels, , spanning the absorption profile. The quantity is the optical-depth profile of ion for the profile. The quantity, , is the autocorrelation function for ion in the profile at = 0, and is defined as
| (2) |
As a result the cross-correlation functions are normalized so that perfectly correlated ions yield = 1 at zero lag velocity. The errors are dominated by cosmic variance and are computed by a “bootstrap” method (Efron & Tibshirani, 1986).
Comparison between the cross-correlation functions and the errors demonstrates that in some cases the measured are statistically significant out to 150 km s-1 . The strongest correlations shown are between the low ion and Al III profiles and between the C IV and Si IV profiles. This confirms the rather accurate one-to-one alignment between the velocity components comprising these ion pairs (see Figures 3 and 4). The 20 km s-1 half-width of for Al III versus low roughly equals the half widths of the wider components in Figure 3, which supports the idea of common velocity components for Al III and low ions. The 30 km s-1 half width of for C IV versus Si IV argues for common component structures for these two ions.
By contrast the for the C IV versus low ions or C IV versus Al III exhibit significantly lower, but still statistically significant, values at = 0 (the differences exceed 6). The lower stems from misalignment between the low ion (or Al III) velocity components with the C IV components in many of the profiles. In this case the correlation amplitude arises from overlap in velocity space between the ion pairs rather than one-to-one alignment between individual components. This interpretation is supported by the 80 km s-1 half widths of for the C IV versus Al III or C IV versus low profiles. These half-widths more closely resemble the coherence scales of contiguous multiple components in the C IV profiles than the half widths of individual components (see Figure 1).
4 SUMMARY AND CONCLUDING REMARKS
Using high-resolution absorption spectra obtained with HIRES, the Echelle spectrograph on the Keck I telescope (Vogt, 1994), we have probed the kinematics of ionized gas in a sample of 35 high-redshift damped Ly protogalaxies. Specifically, we obtained velocity profiles of the high ions C IV and Si IV and the intermediate ion Al III. We studied the kinematic state of the gas by constructing empirical test statistics which characterize (a) the widths and symmetry properties of high ion, intermediate-ion, and previously obtained low ion velocity profiles, and (b) correlations between the kinematic properties of various ionic pairs.
What have we learned that is new? We answer this question by discussing model-independent conclusions inferred from the data:
(1) The damped Ly absorbers comprise distinct kinematic subsystems: a low ion subsystem in which low ions such as Al II are physically associated with intermediate ions such as Al III , and a high ion subsystem consisting of ions such as C IV and Si IV. This is indicated by the similarity between the C IV and Si IV velocity profiles and between the low ion and Al III velocity profiles, and by the misalignment of the velocity components comprising the C IV and low ion profiles.
(2) The low ion and high ion kinematic subsystems are related despite misalignment of their velocity components. This follows from the detection of a statistically significant C IV versus low ion cross-correlation function which exhibits lower amplitude and a wider half-width than either the low ion versus Al III, or C IV versus Si IV cross correlation functions. Whereas the high cross-correlation amplitudes of the latter two ionic pairs arise from the coincidence between corresponding velocity components, the lower amplitude of the C IV versus low ion cross-correlation function is due to a general overlap in velocity space between the line profiles. In any case the relation between low ion and high ion subsystems is further indicated by a systematic effect in which in 29 out of 32 profiles.
(3) The difference between the mean velocities of the C IV and Si IV velocity profiles or between the low ion and Al III profiles exhibits distributions with dispersions equaling 23 and 30 km s-1 respectively. By contrast the low ion versus C IV distribution has a significantly wider dispersion of 67 km s-1 . This is more evidence for distinct kinematic subsystems.
(4) The absence of intermediate ions and low ions from the high ion subsystem indicates the latter is optically thin at the Lyman limit. The lack of mixed ionization states distinguishes the high ion gas in damped Ly protogalaxies from high ion gas in the ISM (Savage et al., 1993), high-redshift Lyman-limit systems (Prochaska, 1999; Prochaska and Wolfe, 2000), and 0.7 Mg II selected absorbers (Churchill et al., 1999) where the velocity profiles of the low ions and intermediate-ions resemble those of the high ions.
These results have rather general implications. First, kinematic subsystems placed in the same potential well generate velocity profiles that tend to overlap in velocity space. In cases where the velocity field of the neutral gas is constrained to fewer degrees of freedom than the ionized gas the resulting profiles will be characterized by . Therefore, we shall test the hypothesis that both kinematic subsystems are subjected to gravitational forces arising from the same mass distribution in paper II. Second, the absence of ionized gas optically thick at the Lyman limit implies a distinction between the damped Ly systems on the one hand and the Lyman limit systems and Mg II absorbers on the other. This is potentially significant because most models assume that both classes of absorber arise in the same physical object. Finally, in paper II we use the empirical distributions of test statistics as well as the empirical C IV versus low cross-correlation function to constrain semi-analytic models of galaxy formation. Specifically we focus on models in which ionized gas in virialized dark-matter halos falls onto centrifugally supported neutral hydrogen disks.
References
- Churchill et al. (1999) Churchill, C. C., Mellon, R. R., Charlton, J. C., Jannuzi, B. T., Kirhakos, S., Steidel, C. C., & Schneider, D. P. 1999, ApJ, 519, 43L
- Efron & Tibshirani (1986) Efron, B. & Tibshirani, R. J. 1993, An Introduction to the Bootstrap, (New York: Chapman & Hall)
- Frodesen etal (1979) Frodesen, A. G., Skjeggestad, O., & Tofte, H. 1979, Probability and Statistics in Particle Physics, (Bergen: Universitetsforlaget), p. 109.
- Haehnelt et al. (1998) Haehnelt, M. G., Steinmetz, M., & Rauch, M. 1998 ApJ, 495 647
- Jedamzik & Prochaska (1998) Jedamzik, K., & Prochaska, J. X. 1998 MNRAS, 296 430
- Kennicutt (1998) Kennicutt, R. C. 1998, ApJ498, 541
- Kauffmann (1996) Kauffmann, G. 1996, MNRAS, 281, 475
- Ledoux et al. (1998) Ledoux, C., Petitjean, P., Bergeron, J., Wampler, E. J., & Srianand, R. 1998, A&A, 337, 51
- Lu et al. (1996) Lu, L., Sargent, W. L. W., Barlow, T. A., Churchill, C. C, & Vogt, S. S. 1996, ApJS, 107, 475
- Mo & Miralda-Escud (1996) Mo, H.J., & Miralda-Escud, J. 1996, ApJ, 469, 589
- Mo, Mao, & White (1999) Mo, H.J., Mao, S., & White, S. D. M. 1999, MNRAS, 304, 175
- Mo & Miralda-Escud (1996) Mo, H.J., & Miralda-Escud, J. 1996, ApJ, 469, 589 (MM)
- Peebles (1989) Peebles, P.J.E. 1989, in The Epoch of Galaxy Formation, eds. C. S. Frenk, R. S. Ellis, T. Shanks, A. F. Heavans, & J. A. Peacock, (Dordrecht: Kluwer), p. 1
- Peebles (1999a) Peebles, P.J.E. 1999a, ApJ, 510, 523
- Peebles (1999b) Peebles, P.J.E. 1999b, ApJ, 510, 531
- Prochaska (1999) Prochaska, J.X. 1999, ApJ, 511, L71
- Prochaska and Wolfe (1996) Prochaska, J. X. and Wolfe, A. M. 1996, ApJ, 470, 403
- Prochaska and Wolfe (1997) Prochaska, J. X. and Wolfe, A. M. 1997, ApJ, 487, 73 (PW1)
- Prochaska and Wolfe (1998) Prochaska, J. X. and Wolfe, A. M. 1998, ApJ, 507, 113 (PW2)
- Prochaska and Wolfe (1999) Prochaska, J. X. and Wolfe, A. M. 1999, ApJS, 121, 369
- Prochaska and Wolfe (2000) Prochaska, J. X. and Wolfe, A. M. 2000, in preparation
- Savage et al. (1993) Savage, B.D., Lu, L., Weymann, R. J., Morris, S. L., & Gilliland, R. L. 1993, ApJ, 404, 124 4232
- Steidel (1993) Steidel, C.C. 1993, The Environment and Evolution of Galaxies, ed. J.M. Shull & H.A. Thronson, Jr., (Boston: Kluwer Academic Publishers), p. 263
- Steidel (1999) Steidel, C.C., 1999, Proc. Natl. Acad. Sci, 96, 4232
- Storrie-Lombardi and Wolfe (2000) Storrie-Lombardi, L.J. & Wolfe, A.M. 2000, ApJ, in press
- Vogt (1994) Vogt, S. S. et al. 1994, Proc. SPIE, 2198, 362
- White & Rees (1978) White, S.D.M., & Rees, M. J. 1978, MNRAS, 183, 341
- White & Frenk (1991) White, S.D.M., & Frenk, C.S. 1991, ApJ, 379, 52
- Wolfe et al. (1995) Wolfe, A. M., Lanzetta, K. M., Foltz, C. B., and Chaffee, F. H. 1995, ApJ, 454, 698
- Wolfe (1995) Wolfe, A.M. 1995, in ESO Workshop on QSO Absorption Lines, ed. G. Meylan, (Berlin:Springer-Verlag), p. 13
- Wolfe (1997) Wolfe, A.M. 1997, in Critical Dialogues in Cosmology, ed. N. Turok, (Singapore: World Scientific), p. 500