Chandra measurements of the distribution of mass in the luminous lensing cluster Abell 2390
Abstract
We present spatially-resolved X-ray spectroscopy of the luminous lensing cluster Abell 2390, using observations made with the Chandra observatory. The temperature of the X-ray gas rises with increasing radius within the central kpc of the cluster, and then remains approximately isothermal, with keV, out to the limits of the observations at Mpc. The total mass profile determined from the Chandra data has a form in good agreement with the predictions from numerical simulations. Using the parameterization of Navarro, Frenk & White (1997), we measure a scale radius Mpc and a concentration parameter . The best-fit X-ray mass model is in good agreement with independent gravitational lensing results and optical measurements of the galaxy velocity dispersion in the cluster. The X-ray gas-to-total-mass ratio rises with increasing radius with per cent at Mpc. The azimuthally-averaged keV surface brightness profile exhibits a small core radius and a clear ‘break’ at kpc, where the slope changes from to . The data for the central region of the cluster indicate the presence of a cooling flow with a mass deposition rate of and an age of Gyr.
keywords:
galaxies: clusters: individual: Abell 2390 – cooling flows – intergalactic medium – gravitational lensing – X-rays: galaxies1 Introduction
Accurate measurements of the masses of clusters of galaxies are of profound importance to cosmological studies. Originally, most measurements of cluster masses were based on optical studies of their galaxy dynamics, wherein the motions of individual galaxies were used to trace the cluster potentials. Although such studies were shown to be sensitive to systematic uncertainties due to velocity anisotropies, substructure and projection effects (e.g. Lucey 1983; Frenk et al. 1990; van Haarlem, Frenk & White 1997), more recent work based on large galaxy samples and employing careful selection techniques, has lead to significant progress (e.g. Carlberg et al. 1996; den Hartog & Katgert 1996; Fadda et al. 1996; Mazure et al. 1996; Borgani et al. 1999; Geller, Diaferio & Kurtz 1999; Koranyi & Geller 2000).
Recent years have also seen the development of two further techniques for measuring the masses of clusters, based on X-ray observations and studies of gravitational lensing by clusters, respectively. X-ray mass measurements use the assumption that the X-ray emitting gas which pervades clusters is in hydrostatic equilibrium; the total mass distribution is determined once the radial distributions of the X-ray gas density and temperature are known (see e.g. Sarazin 1988). Since the X-ray emissivity is proportional to the square of the gas density, and the relaxation timescale for the X-ray gas is relatively short (of the order of a few sound crossing times), the X-ray method is relatively free from the projection and substructure effects which hamper the aforementioned optical studies.
In contrast to the X-ray and optical dynamical techniques, gravitational lensing offers a method for measuring the projected masses through clusters that is essentially free from assumptions about the dynamical state of the gravitating matter (see e.g. Fort & Mellier 1994; Bartelmann & Schneider 1999; Mellier 1999 for reviews). The primary observational challenges of requiring deep exposures, excellent seeing conditions, wide field imaging and accurate point spread function models have now been mostly overcome with improved instrumentation (e.g. Bacon et al. 2000 and references therein), although the recovery of the three-dimensional mass distributions in clusters can be complicated by projection effects and uncertainties in the redshift distributions of the lensed sources.
Clearly, the best approach when attempting to reliably measure the masses of clusters is to combine these three methods. The first combined X-ray and lensing studies of galaxy clusters (Miralda-Escudé & Babul 1995) suggested that strong lensing masses, measured within kpc of the cluster centre, might typically overestimate X-ray-determined masses by a factor of . This sparked debate into the possible effects of oblate/prolate cluster geometries, projection effects, complex temperature structures and pressure support from bulk and/or turbulent motions and magnetic fields in the X-ray gas (e.g. Miralda-Escudé & Babul 1995; Loeb & Mao 1994; Waxman & Miralda-Escudé 1995; Kneib et al. 1995; Bartelmann & Steinmetz 1996). Later work (Allen, Fabian & Kneib 1996; Allen 1998; Böhringer et al. 1998; Wu 2000) highlighted a clear difference between the results obtained for cooling-flow (hereafter CF) and non-cooling flow (NCF) clusters. For CF clusters, the X-ray and strong lensing mass measurements generally show good agreement, once the effects of the cooling flows are accounted for in the X-ray analysis. For NCF systems, however, the masses inferred from the strong lensing data invariably exceed the X-ray values, determined under the hydrostatic assumption, by a factor of .
The origin of the different results obtained for CF and NCF clusters is thought to lie in the different dynamical states of these systems: whereas X-ray and optical imaging and detailed lensing analyses of CF clusters show them to be relatively regular and dynamically-relaxed systems, NCF clusters generally appear to be undergoing major subcluster merger events (e.g. Edge, Stewart & Fabian 1992; Buote & Tsai 1996; Kneib et al. 1995; Smail et al. 1995, 1997; Squires et al. 1997). Significant offsets between the X-ray and lensing centroids are observed in NCF clusters, demonstrating a loss of hydrostatic equilibrium in their central regions. The X-ray core radii for NCF systems also appear to have been inflated by the dynamical activity, in agreement with the predictions from numerical simulations (e.g. Roetigger et al. 1996); this inflation of the X-ray core radii can account for the bulk of the X-ray/strong lensing mass discrepancy in most NCF systems (Allen 1998). On larger spatial scales ( Mpc), comparisons between weak lensing, X-ray and optical dynamical mass measurements generally provide a consistent picture, with excellent agreement between the results obtained for both CF and NCF clusters (e.g. Squires et al. 1996; Smail et al. 1997; Wu & Fang 1997; Allen 1998; Lewis et al. 1999). This suggests that the loss of hydrostatic equilibrium in NCF clusters is primarily restricted to their inner regions.
The most significant uncertainty associated with the X-ray mass measurements in previous joint X-ray/lensing studies has been the absence of any direct measurements of the X-ray temperature profiles in the clusters, which impacts directly on the mass measurements through the hydrostatic equation. Although limited spatially-resolved spectroscopy for bright, nearby clusters was possible using ASCA and Beppo-SAX observations (e.g. Markevitch et al. 1998; Kikuchi et al. 1999; de Grandi & Molendi 1999; White 2000; Irwin & Bregman 2000), for the more distant lensing clusters, typically observed at redshifts , only a single, integrated cluster spectrum was normally available. In most cases, only a mean emission-weighted X-ray temperature was therefore determined, although more sophisticated studies also accounted for the effects of cooling flows on the X-ray data (e.g. Allen 1998; Böhringer et al. 1998). For the mass analyses, it was then necessarily assumed that the mass-weighted temperature profile followed some particular form, and usually that it remained approximately isothermal with radius. However, the validity of this assumption remains uncertain, especially within the strong lensing regime.
The launch of the Chandra Observatory (Weisskopf et al. 2000) in 1999 July provides the first opportunity for detailed, spatially-resolved X-ray spectroscopy of clusters of galaxies at moderate redshifts. The Advanced CCD Imaging Spectrometer (ACIS) on Chandra permits the first direct, simultaneous measurements of the X-ray temperature and density profiles and, via the hydrostatic assumption, the mass distribution in luminous lensing clusters, spanning both the weak and strong lensing regimes. In this paper we present the first results from Chandra observations of the massive CF lensing cluster Abell 2390, which has been the subject of several previous combined X-ray/optical/lensing studies (e.g. Piere et al. 1996, Squires et al. 1996, Allen 1998, Böhringer et al. 1998, Lewis et al. 1999). We present detailed results on the mass distribution in the cluster determined from the Chandra data and compare our results with those from detailed strong and weak lensing analyses and optical dynamical studies. We also re-examine the properties of the cooling flow in the cluster and discuss their relation to the dynamical history of the system.
The cosmological parameters =50 , and are assumed throughout. At the redshift of Abell 2390 () an angular scale of 1 arcsec corresponds to a physical length of 4.652 kpc.
2 Observations
The Chandra observations of Abell 2390 were carried out using the ACIS on 1999 November 7. The target was observed in the back-illuminated CCD detectors, close to the nominal aim point for the ACIS S3 detector. (The source was positioned near the centre of node-1 on the chip). The focal plane temperature at the time of the observations was -110C.
We have used the CIAO software (version 1.1.3) and the level-2 events file provided by the standard Chandra pipeline processing for our analysis. The light curve for the observation was of high quality with no strong background flaring. Only those X-ray events with grade classifications of 0,2,3,4 and 6 were included in our final cleaned data set, for which the net exposure time was 9.13ks.
3 X-ray imaging analysis
3.1 X-ray morphology
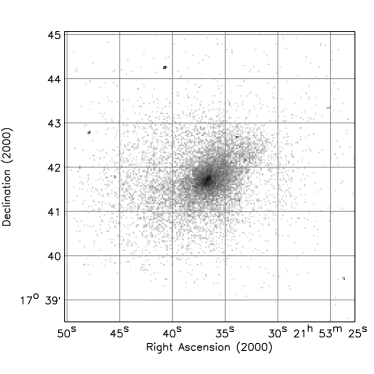
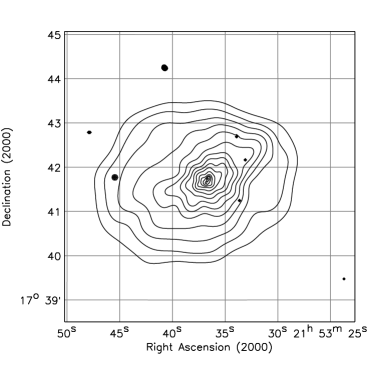
The raw keV image of the central arcmin2 ( Mpc2) region of Abell 2390 is shown in Fig. 1(a). The pixel size is arcsec2, corresponding to raw detector pixels. Fig. 1(b) shows an adaptively smoothed version of the same image, using the smoothing algorithm of Ebeling, White & Rangarajan (2000). The position of the peak of the X-ray emission from the cluster, 21h53m36.77 +17d41m42.8s (J2000.), is in excellent agreement with the optical centroid for the dominant cluster galaxy of 21h53m36.76 +17d41m42.9s (J2000.; Pierre et al. 1996). The X-ray image is elongated along an approximately northwest-southeast direction, in a similar manner to the optical isophotes of the dominant galaxy (Pierre et al. 1996).
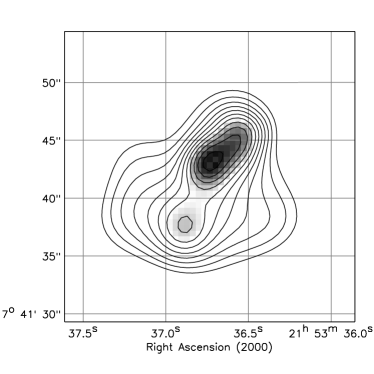
Some substructure is apparent in the Chandra image. In the central region, a relatively bright ridge of enhanced emission extends arcsec to the northwest of the X-ray peak (Fig. 2). Enhanced emission in the same direction is also observed in the optical blue continuum and optical/UV line emission from the dominant cluster galaxy (Lémonon et al. 1998; Edge et al. 1999; Hutchings & Balogh 2000). A correspondence between the brightest X-ray emission with excess blue continuum and optical/UV line emission (probably associated with the formation of young, massive stars) is also observed in the nearby CF clusters Hydra-A (McNamara et al. 2000) and Abell 1795 (Fabian et al. 2000b). A second, fainter region of enhanced X-ray emission extends arcsec to the south-southeast.
On medium ( arcsec) scales, the X-ray emission is extended to the west-northwest, in a similar manner to the optical luminosity distribution and lensing mass models of Piere et al. (1996; these authors also note the presence of an X-ray extension in the same direction using ROSAT High Resolution Imager data). On large scales ( arcmin) the X-ray emission is extended towards the east. The presence of such substructure in the Chandra image suggests that the cluster has not fully relaxed following it’s most recent merger activity. However, the agreement between the X-ray, optical and gravitational lensing mass measurements discussed in Section 5.2 argues that overall the assumption of hydrostatic equilibrium in the cluster is a reasonable one.
Three point sources are detected to the west of the X-ray peak, in the central regions of the cluster, at positions 21h53m33.19 +17d42m08.4s, 21h53m33.74 +17d41m13.3s, and 21h53m34.02 +17d42m39.9s. The X-ray and sub-mm properties of these sources are discussed by Fabian et al. (2000a). Four more point sources are also visible at larger radii in Fig. 1(b).
3.2 The surface brightness profile
The azimuthally-averaged, keV X-ray surface brightness profile for Abell 2390 is shown in Fig. 3. The profile has been flat-fielded and background subtracted using a rectangular background region of size arcsec2, located arcmin from the cluster centre. All obvious point sources were excluded from the analysis.
The X-ray emission from the cluster extends beyond the 5 arcmin ( Mpc) radius associated with our on-chip background region (see also Pierre et al. 1996; Böhringer et al. 1998). However, beyond this radius background counts dominate the flux in the ACIS-S3 detector. Fig. 3 shows the data for the central 900 kpc ( arcsec), for which systematic errors associated with the background subtraction and flat fielding are negligible. The bin-size in Fig. 3(a) is 2 detector pixels (0.984 arcsec). Fig. 3(b) shows the data for the outer regions of the cluster with a larger binsize of 8 detector pixels (3.94 arcsec).
Within a radius of 500 kpc ( arcsec), the X-ray surface brightness profile can be parameterized ( for 106 degrees of freedom) by a standard -model (e.g. Jones & Forman 1984) of the form , with a core radius kpc and a slope parameter ( errors; ). On larger scales, however, the -model does not provide an acceptable fit: examining the data for the central 900 kpc radius, we obtain for 194 degrees of freedom, with best-fit parameter values of kpc and ). Ignoring the central kpc (18 arcsec) region, associated with the possible cooling flow (Section 6), the fit is improved ( for 177 degrees of freedom, with best-fit parameter values kpc and ) although is still formally unacceptable.
The main reason for the poor fit obtained with the -model at larger radii is the presence of a ‘break’ in the surface brightness profile at kpc (Fig. 3b). This break is not obviously due to substructure in any particular direction in the cluster: Fig. 4 shows the surface brightness profile measured in the four quadrants covering position angles , , and degrees. We see that the profile appears remarkably similar in three of the four directions, although the emission is slightly more extended towards the east (as is also evident in the images presented in Fig. 1).
A good fit to the surface brightness profile beyond the central cooling region can be obtained using a simple broken power-law model. Fitting the data from kpc, we obtain for 176 degrees of freedom, with a break at a radius of kpc, and slopes in the regions internal and external to the break radius of and , respectively. Interestingly, these slopes are similar to the values expected at small and large radii for the dark matter in a Navarro, Frenk & White (1997; hereafter NFW) potential in which ). However, isothermal gas in an NFW-like potential should not exhibit a sharp break at the scale radius , but rather a slow rollover (although individual clusters in the simulations presented by Thomas et al. 2000 do exhibit sharp breaks in their dark matter distributions). Fitting the surface brightness profile external to the cooling flow ( kpc) with the prescription for isothermal gas in an NFW potential described by Ettori & Fabian (1999), we measure kpc (formal errors), with for 177 degrees of freedom. Thus, the fit with the NFW mass model assuming strict isothermality in the X-ray gas is formally unacceptable, although provides a better description of the data in the kpc region than the -model. As discussed in Section 4, the Chandra data show that the X-ray gas in Abell 2390 is not isothermal and that the temperature rises with increasing radius within the central kpc. In Section 5 we show that an NFW mass model can provide a good description of the Chandra data, once the assumption of isothermality is relaxed.
4 Spatially-resolved spectroscopy
4.1 Method of analysis
For our spectral analysis, we divided the cluster into annular regions, as detailed in Table 1. A spectrum was extracted from each region in 1024 Pulse Height Analyser (PHA) channels. The spectra were re-grouped to contain a minimum of 20 counts per PHA channel, thereby allowing statistics to be used. (For the two outer annuli, a larger grouping of 40 counts per PHA channel was used, due to the increased background contribution). Background spectra, appropriate for the regions studied, were extracted from the ACIS-S3 blank-field data sets available from the Chandra X-ray Center. All obvious point sources were masked out and excluded from the analysis. Separate photon-weighted response matrices and effective area files were constructed for each region using the calibration and response files appropriate for the focal plane temperature, available from the Chandra X-ray Centre.
Two separate energy ranges were examined. Firstly, a conservative keV band was used over which the calibration of the back-illuminated CCD detectors is currently best understood. Secondly, for the central 100 kpc region, where a cooling flow is thought to exist (Section 6), we have also examined a more extended keV energy range, which provides extra constraints on the presence of cool emission components and/or intrinsic absorption in the cluster.
4.2 The spectral models
The analysis of the spectral data has been carried out using the XSPEC software package (version 11.01; Arnaud 1996). The spectra were modeled using the plasma emission code of Kaastra & Mewe (1993; incorporating the Fe L calculations of Liedhal, Osterheld & Goldstein 1995) and the photoelectric absorption models of Balucinska-Church & McCammon (1992). We first examined each annular spectrum using a simple, single-temperature model with the absorbing column density fixed at the nominal Galactic value (atom cm-2; Dickey & Lockman 1990). This model is hereafter referred to as model A. The free parameters in model A were the temperature () and metallicity () of the plasma (measured relative to the solar photospheric values of Anders & Grevesse 1989, with the various elements assumed to be present in their solar ratios) and the emission measure (). We also examined a second single-temperature model (model B) which was identical to model A but with the absorbing column density also included as a free parameter in the fits.
The image deprojection and X-ray colour profile analyses discussed in Section 6 indicate the presence of a strong cooling flow in the central kpc region of the cluster. We have therefore also examined the spectral data for this region using a series of more sophisticated, multiphase models in which the emission properties of the cooling flow were explicitly accounted for. The first such model (model C1) introduced an extra emission component into model A, with a spectrum appropriate for gas cooling at constant pressure from the ambient cluster temperature (following the prescription of Johnstone et al. 1992). The normalization of this component was parameterized in terms of a mass deposition rate, , which was a free parameter in the fits. In the second case, model C2, the cooling gas was modelled as an isothermal cooling flow, following Nulsen (1998; we assume a value for , where the integrated mass deposition rate within radius r, ). The mean gas temperature and metallicity in both the cooling flow and isothermal emission component (which accounts for the emission from gas at larger radii viewed in projection) were assumed to be equal. Finally, we also examined a more general emission model, model D, in which the cooling gas was modelled by a second, cooler isothermal emission component, with the temperature and normalization of this component included as free fit parameters. Model D provides a more flexible parameterization, with an additional degree of freedom over models C1 and C2, and invariably provides a good match to the more specific cooling-flow models at the spectral resolution and signal-to-noise ratios typical of ACIS cluster observations. However, the parameter values determined with model D were not well constrained for Abell 2390, and thus we do not quote explicit results for this model here.
With each of the cooling-flow emission models, we have also examined the effects of including extra absorption, using a variety of different absorption models. In the first case (absorption model i), the only absorption included was that due to cold gas in our Galaxy, with the equivalent column density fixed to the nominal Galactic value (Dickey & Lockman 1990; For a single temperature emission model, this is identical to spectral model A). In the second model (model ii), the absorption was again assumed to be due to Galactic (zero redshift) cold gas, but with the column density, , included as a free parameter in the fits. (For a single temperature emission model, this would be equivalent to spectral model B.) In the third case (absorption model iii), an intrinsic absorption component with column density, , due to cold gas at the redshift of the cluster was introduced. The absorber was assumed to lie in a uniform screen in front of the cooling flow, with the column density included a free fit parameter. In the fourth case (model iv), the intrinsic absorption was assumed to cover only a fraction, , of the emission from the cooling flow. The fifth and final absorption model (model v) was similar to model (iii) but with the gaseous absorber replaced by an intrinsic absorption edge, with the edge depth, , and energy, , free parameters in the fits. This more general absorption model may be used to approximate the effects of a dusty and/or ionized absorber.
In those cases where the absorption has been quantified in terms of an equivalent hydrogen column density, solar metallicity in the absorbing gas is assumed. We note that in absorption models (iii–v), the absorption acting on the ambient cluster emission was fixed at the nominal Galactic value. However, allowing the Galactic absorption to vary from this value did not significantly improve the fits.
4.3 Results from the single-phase analysis
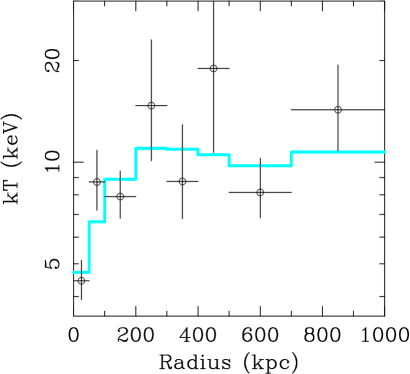
The best-fit parameter values and () and 90 per cent () confidence limits determined from the fits in the keV band with the single temperature models are summarized in Tables 1 and 2. The temperature profile determined with spectral model A is shown in Fig. 5(a). The measured temperature is approximately isothermal beyond a radius of 200 kpc, out to the limits of the data at Mpc. A combined fit to the data in the Mpc range with model A gives a mean temperature of keV. Fitting the Mpc results with a simple power-law model of the form we measure ( bootstrap errors obtained using the Akritas & Bershady 1996 modification of the ordinary least squares statistic.) We observe a clear drop in the emission weighted temperature within the central 100 kpc, with a value for the central kpc of keV.
We detect marginal evidence for a metallicity gradient in the cluster, with a mean, best-fit value for the central 100 kpc of , which compares to a mean value of for the outer Mpc region (Fig. 6a; errors). The results determined with spectral model B in the keV band also provide marginal evidence for increased absorption towards the cluster core (Fig. 6b).
In all cases, the values obtained from the fits to the keV data with the single-temperature models are acceptable, the only marginal case being the data for the central 50 kpc region, where the spectrum is complicated by the effects of the cooling flow.
4.4 Multiphase analysis of the cooling core
The results determined from the more detailed, multiphase analysis of the central 100 kpc radius in the extended keV energy band are summarized in Table 3. The results demonstrate a clear requirement for excess absorption in this region, over and above the nominal Galactic value (Dickey & Lockman 1990), using each of the different emission models. The systematic variations between the column density measurements obtained with the different emission and absorption models are similar to those determined from previous ASCA studies (e.g. Allen 2000). Unfortunately, the present Chandra data for Abell 2390 cannot statistically discriminate between the single-phase and multiphase emission models for the central 100 kpc region, which provide comparable values with each absorption model. (We note, however, that at some level the spectrum for the central 100 kpc must be multiphase simply due projection effects, given the results on the temperature profile shown in Fig. 5(a).)
For our preferred cooling-flow emission models including intrinsic absorption, which provide the most consistent physical description of the spectral and imaging data for the central 100 kpc region (Section 6), we measure an integrated mass deposition rate . Fig. 5(b) shows the projected temperature profile for Abell 2390, corrected for the effects of the cooling flow using spectral model C2(iii). (For kpc the results determined with spectral model A in the keV band have been used). We see that correcting for the effects of the cooling flow does not have a major impact on the temperature profile measured in the central regions of the cluster. Assuming that the isothermal cooling flow model provides a reasonable description of the data, the drop in the central temperature shown in Figs. 5(a,b) should then reflect the mass distribution in the cluster core.
The data for Abell 2390 do not provide firm constraints on the nature of the intrinsic absorption in the cluster. Using the partial-covering absorption model (iv), we find that high covering fractions are preferred. For the edge-like absorption model (v), the lower limit on the edge energy is essentially unconstrained: for emission models C1(v) and C2(v), however, the upper limit on the edge energy is inconsistent with the OI K edge of oxygen ( keV), suggesting that the absorption is unlikely to be due to oxygen rich dust grains (e.g. Arnaud & Mushotzky 1998; Allen et al. 2000b) or a warm, ionized absorber (Buote 2000).
Assuming that the intrinsic absorption is due to cold gas lying in a uniform screen in front of the cooling flow, using spectral model C2(iii), we measure atom cm-2. The mass of absorbing gas implied by this model is then , where is the radial extent of the absorber in kpc and is the equivalent hydrogen column density in units of atom cm-2. For kpc (Section 6.2) we obtain ( although Allen & Fabian 1997 and Wise & Sarazin 2000 argue that for a geometry in which the absorbing material is distributed throughout the X-ray emitting region, the true mass is likely to be a few times higher). This mass is in reasonable agreement with the mass expected to have been accumulated by the cooling flow within the same radius over its lifetime; (the factor two in the denominator arises from the assumption that the integrated mass deposition rate, , grows approximately linearly with time).
4.5 Spectral deprojection analysis
The results discussed in the previous subsections are based on the analysis of projected spectra. In order to determine the effects of projection on the spectral results, we have also carried out a simple deprojection analysis of the Chandra spectral data.
For this analysis we have used the same annular regions and have assumed that the emission from each spherical shell (the shells are defined by the same inner and outer radii as the annular regions) is isothermal and absorbed by the Galactic column density (spectral model A). The fit to the outermost annulus is used to determine the temperature and emission measure in the outermost spherical shell. The contribution from that shell to each inner annulus is then determined by purely geometric factors (e.g. Kriss, Cioffi & Canizares 1983). The fit to the second annulus inward is used to determine the parameters for the second spherical shell, and so forth, working inwards. Thus, the spectral model for the th annulus working inwards is the weighted sum of absorbed, isothermal models. This parallels the usual image deprojection procedure (e.g. Fabian et al. 1981).
We have used the XSPEC code and Chandra data in the keV band. The data for all eight annular spectra were fitted simultaneously in order to correctly determine the parameter values and confidence limits. The spectral model used therefore has free parameters (where is the total number of annuli), corresponding to the temperature and emission measure in each spherical shell and the overall emission-weighted metallicity (the metallicity is linked to the same value at all radii). Note that we have have not attempted to correct for residual emission from gas at radii beyond the outermost annulus since the steeply rising surface brightness profile of the cluster causes this emission to have a negligible affect on the results.
The temperature profile determined with the spectral deprojection method is shown in Fig. 7.
4.6 Comparison with previous work
The mean ambient temperature for Abell 2390 of keV, determined from the combined analysis of the data in the Mpc range, is in good agreement with the previous results of keV from Allen (1998) based on ASCA observations, and keV from Böhringer et al. (1998), based on a joint analysis of ASCA and ROSAT Position Sensitive Proportional Counter (PSPC) data. (Both Allen 1998 and Böhringer et al. 1998 accounted for the effects of the central cooling flow in their modelling of the integrated cluster spectra. Böhringer et al. (1998) also examined a simpler, single-temperature emission model with which they measured a lower mean emission-weighted temperature of keV.) The ambient temperature for Abell 2390 measured with Chandra is also in good agreement with the predicted value of keV using the cooling-flow corrected relation of Allen & Fabian (1998; we assume a bolometric luminosity of as measured by ASCA since the Chandra observations do not cover the whole of the cluster).
The best-fit mass deposition rate from the cooling flow of , determined from the Chandra spectrum for the central 100 kpc region, is lower than previous measurements based on the analysis of integrated spectra for the whole cluster from ASCA ( ; Allen 2000), joint ASCA/ROSAT ( ; Böhringer et al. 1998) and Beppo-SAX ( ; Ettori, Allen & Fabian 2000) observations (although the results are marginally consistent at the per cent confidence level). In part, this difference is likely to be due to the fact that the ambient gas temperature in the centre of the cluster, corrected for the effects of the cooling flow, is lower than the mean value measured at larger radii (Fig. 5b). If this drop in the central ambient temperature is not accounted for (as was the case in the previous ASCA and BeppoSAX studies, which could not spatially resolve the cooling flow from the hotter, outer cluster gas) then the cooler, ambient gas in the cluster core will also tend to be modelled as part of the cooling flow, and the total mass deposition rate will be overestimated. This effect is illustrated by the fact that a fit with spectral model C2(iii) to a single Chandra spectrum covering the entire central 500 kpc (radius) of the cluster, gives , atom cm-2 and keV, in good agreement with the previous ASCA, ROSAT and BeppoSAX results. 111Note that although the fit with spectral model C2(iii) to the Chandra spectrum for the central 500 kpc (radius) region overestimates the mass deposition rate from the cooling flow, the measured temperature is in good agreement with the true value at large radii in the cluster (Fig. 5b). Thus, previous ASCA and Beppo-SAX studies which attempted to account for the effects of cooling flows on integrated cluster spectra (e.g. Allen 1998; Böhringer et al. 1998) may have overestimated the mass deposition rates from the cooling flows but are likely to have provided reasonable estimates of the mean cluster temperatures. However, a fit to the central 200 kpc radius region (the maximum possible size of any cooling flow; Section 6) gives ( keV), in good agreement with the value listed in Table 3. These results, and the consistent findings from the spectral, image deprojection and X-ray colour profile analyses of the innermost 100kpc presented in Section 6, highlight the need for detailed spatially-resolved spectroscopy when attempting to study the properties of cooling flows in distant clusters.
Finally, we note that the excess column density acting on the cooling flow component measured with spectral model C1(iii) of atom cm-2 is consistent with the previous measurement of atom cm-2 from ASCA, using the same model (Allen 2000).
5 Measurement of the cluster mass profile
5.1 The mass model
The observed X-ray surface brightness profile (Fig. 3a) and deprojected temperature profile (Fig. 7) may together be used to determine the X-ray gas mass and total mass profiles in the cluster. For this analysis, we have used an updated version of the image deprojection code developed in Cambridge (see e.g. White, Jones & Forman 1997 for details). A variety of simple parameterizations for the cluster mass distribution were examined, to establish which could provide an adequate description of the Chandra data. For those mass models providing reasonable fits, the best-fit parameter values were determined using a simple iterative technique.222Given the observed surface brightness profile and a particular parameterized mass model, the deprojection code is used to predict the temperature profile of the X-ray gas. (We use the median model temperature profile determined from 100 Monte-Carlo simulations.) The predicted temperature profile is rebinned, using an appropriate flux weighting, and compared with the results from the spectral deprojection analysis (Fig. 7). The difference between the observed and predicted temperature profiles is then calculated. The parameters for the mass model are stepped through a regular grid of values in and (or alternatively and ) to determine the best-fit values (which give the minimum ) and confidence limits. For Abell 2390 the final grid used ranges from Mpc in and in . Spherical symmetry and hydrostatic equilibrium are assumed throughout.
We find than a good fit ( for 6 degrees of freedom; hereafter DOF) to the Chandra data can be obtained using an NFW mass model
| (1) |
where is the mass density, is the critical density for closure and
| (2) |
with a scale radius, Mpc and a concentration parameter, (68 per cent confidence limits). The normalization of the mass profile may also be expressed in terms of an equivalent velocity dispersion, (with in units of Mpc). The equivalent velocity dispersion associated with the best-fit X-ray mass model of (68 per cent confidence limit), is in good agreement with the robust, optically-determined value of (Borgani et al. 1999; from a re-analysis of the data of Carlberg et al. 1996 data).
We note that the best-fit values of , and are correlated. Fixing Mpc in the NFW model, we determine a concentration parameter and an equivalent velocity dispersion (68 per cent confidence limit keeping fixed.) For Mpc, we obtain and . Fixing Mpc, we obtain and . Note, however, that the mass distributions within the central 1Mpc radius are similar in all three cases.
The best-fit NFW mass model, with Mpc and , has a virial radius Mpc and an integrated mass within this radius, . The relationship between , and for Abell 2390 is consistent with that expected for such a massive cluster formed at a redshift (e.g. Eke, Navarro & Frenk 1998)
The deprojected X-ray gas temperature profile implied by the best-fitting NFW mass model (given the observed surface brightness profile) is shown overlaid on the deprojected spectral results in Fig. 7. The model results have been rebinned to the same resolution as the spectral data.
Finally, we note that the NFW mass model provides a significantly better-fit to the Chandra data for Abell 2390 than a singular isothermal sphere (: for 7 DOF). However, a variety of other, two-parameter models including a softened isothermal sphere (: for 6 DOF with kpc), a King approximation to an isothermal sphere (: for 6 DOF with kpc), and a full isothermal sphere (Equation 4-125 of Binney & Tremaine 1987: for 6 DOF with kpc ) also provide good descriptions of the Abell 2390 mass profile.
5.2 Comparison of X-ray and lensing mass measurements
Abell 2390 is one of the best studied lensing clusters (e.g. Pelló et al. 1991; Kassiola, Kovner & Blandford 1992; Narasimha & Chitre 1993; Pierre et al. 1996; Squires et al. 1996; Bezecourt & Soucail 1997; Frye & Broadhurst 1998; Pello et al. 1999). The cluster exhibits an unusual, strongly lensed ‘straight arc’ approximately 38 arcsec (174 kpc) away from the nucleus of the central galaxy (Pelló et al. 1991) in addition to many other arcs and arclets (e.g. Bezecourt & Soucail 1997; Pelló et al. 1999). Pierre et al. (1996) present a two-component mass model for the central regions of the cluster and measure a projected mass within the radius defined by the brightest arc of . Squires et al. (1996) present a weak lensing analysis of the cluster and determine an azimuthally averaged mass profile covering the central arcmin (1.2 Mpc).
Fig. 8 shows the projected mass profile determined from the Chandra X-ray data, with the Squires et al. (1996) weak lensing results and Piere et al. (1996) strong lensing results overlaid. For the X-ray analysis, we assume that the NFW mass models extend out to in each case. (The limits on the X-ray results are the maximum and minimum masses at each radius for the range of NFW models with ; the 68 per cent confidence contour in the plane). The agreement between the X-ray and lensing mass results in Fig. 8 is reasonable at all radii studied. The mean scatter of the lensing results about the best-fit X-ray mass profile within the central 1 Mpc region is per cent. The agreement between the independent lensing and X-ray mass measurements, together with the consistent results on the equivalent X-ray and observed optical galaxy velocity dispersions, confirms the validity of the hydrostatic assumption used in the X-ray analysis and suggests that the mass profile in Abell 2390 has been robustly determined.
We note that at small radii, the strong lensing mass of Pierre et al. (1996) slightly exceeds (at significance) the best-fit value determined from the Chandra data ( within kpc). This difference, albeit marginal, may be related to the residual substructure on these scales seen in the X-ray (Section 3.1) and optical images and strong lensing mass map (Pierre et al. 1996), and could indicate a slight enhancement of the central lensing mass due to an alignment of the dominant mass clumps in the cluster and/or the presence of additional, non-thermal pressure support of the X-ray gas in the cluster core.
5.3 The X-ray gas mass fraction
The X-ray gas-to-total-mass ratio as a function of radius, , determined from the Chandra data is shown in Fig. 9. We find that the best-fit value rises with increasing radius with at Mpc (conservative limits determined by combining the errors on the integrated gas mass at each radius with the uncertainties in the total mass distribution shown in Fig. 8 in quadrature). This value is consistent with the previous measurement of per cent ( limits) at Mpc from Ettori & Fabian (1999) using ROSAT PSPC and ASCA data and assuming strict isothermality in the X-ray gas.
Following the usual arguments, which assume that the properties of clusters provide a fair sample of those of the Universe as a whole (e.g. White et al. 1993; White & Fabian 1995; Evrard 1997; Ettori & Fabian 1999; Bahcall et al. 1999), we may use our result on the X-ray gas mass fraction in Abell 2390 to estimate the total matter density in the Universe, . Assuming that the luminous baryonic mass in galaxies in Abell 2390 is approximately one fifth of the X-ray gas mass (e.g. White et al. 1993; Fukugita, Hogan & Peebles 1998) and neglecting other possible sources of baryonic dark matter in the cluster, we obtain , where is mean baryon density in the Universe and is the Hubble constant in units of 50. For (O’Meara et al. 2000), .333Accounting for any additional, dark baryonic matter in the cluster would lower the measured value of . Likewise, if the value of increases towards larger radii in Abell 2390, the true value for will be lower than our quoted result.
6 The properties of the cooling flow
6.1 Radial properties of the cluster gas
The results on the electron density and cooling time as a function of radius, determined from the image deprojection analysis using the best-fit NFW mass model, are shown in Fig. 10. Within the central 500 kpc radius, the electron density profile can be parameterized ( for 52 degrees of freedom) by a -profile with a core radius, kpc, and a central density, cm-3 ( errors). The core radius for the electron density distribution is slightly smaller than the value measured directly from the projected surface brightness profile under the assumption of strict isothermality in the X-ray gas (Section 3.2). Indeed, the evidence for any flat central core in the electron density distribution is marginal and a simple broken power-law model, with kpc and slopes interior and exterior to the break radius of and , provides as good a fit to the electron density profile in the central 500 kpc region ( for 51 degrees of freedom).
For an assumed Galactic column density of atom cm-2, we measure a central cooling time (i.e. the mean cooling time within the central 1.97 arcsec or ( kpc) bin of yr, and a cooling radius, at which the cooling time first exceeds a Hubble time, of kpc. (Errors on the central cooling time are the 10 and 90 percentile values from 100 Monte Carlo simulations. The upper and lower confidence limits on the cooling radii are the points where the 10 and 90 percentile values exceed and become less than the Hubble time, respectively.)
6.2 X-ray colour profile analysis
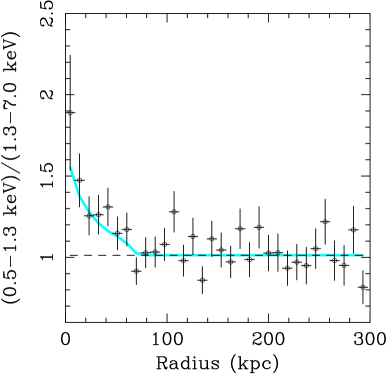
We have constructed an X-ray ‘colour’ profile for the cluster in order to determine the size of the central region in which significant cooling occurs. Two separate images were created in the energy bands and keV ( and keV in the rest frame of the source) with a 1.97 arcsec (4 raw detector pixels) pixel scale. These soft and hard X-ray images were background subtracted and flat fielded (taking full account of the spectral energy distributions of the detected photons). All significant point sources were masked out and excluded from the analysis. Azimuthally-averaged surface-brightness profiles for the cluster were then constructed in each energy band, centered on the overall peak of the X-ray emission (Section 3). The X-ray ‘colour’ profile formed from the ratio of the surface brightness profiles in the soft and hard bands is shown in Fig. 11.
From examination of Fig. 11 we see that at large radii the observed X-ray colour ratio is approximately constant, with a mean value of ( error determined from a fit to the data between radii of kpc). By comparison with simulated spectra we find that this result is consistent with an isothermal plasma with a temperature keV. (We assume a metallicity and Galactic absorption.) Within a ‘break’ radius of kpc ( errors determined from a fit with a broken power-law model), however, the colour ratio rises sharply, indicating the presence of significantly cooler gas.
6.3 Analysis of the mass deposition profile
The outermost radius at which cooling occurs may also be expected to be associated with a ‘break’ in the X-ray surface brightness profile and, more evidently, the mass deposition profile determined from the deprojection code. The mass deposition profile from the cooling flow, which is a parameterization of the X-ray luminosity distribution in the cluster core (see e.g. White et al. 1997), is shown in Fig. 12. Fitting this profile with simple a broken power-law model, we determine a break radius of kpc ( errors), in reasonable agreement with the break radius determined from the fit to the X-ray colour profile (Section 6.2) and the electron density distribution (Section 6.1) . The best-fit broken power-law model is shown overlaid on the mass deposition profile in Fig. 12.
The slopes of the mass deposition profile, internal and external to the break radius are and , respectively. Accounting only for absorption due to cold gas with the nominal Galactic column density, we determine an integrated mass deposition rate within the break radius of . If we also account for the presence of intrinsic absorption, with the properties determined using spectral model C2(iii), the mass deposition rate within the break radius rises to , in good agreement with the spectral result for the central 100 kpc of .
6.4 The age of the cooling flow
Allen et al. (2000a) discuss a number of methods which may be used to estimate the ages of cooling flows from X-ray data. (Such ages are likely to relate to the time intervals since the central regions of clusters were last disrupted by major subcluster merger events.) Essentially, these methods identify the age of a cooling flow with the cooling time of the X-ray gas at the break radius in either the X-ray colour or deprojected mass deposition profile.
Using Fig. 10(b), we see that cooling time of the X-ray gas at the break radius in the X-ray colour profile ( kpc) lies in the range Gyr. (The cooling time at the break radius is measured from a least-squares fit to the data in Fig. 10(b) over the kpc range using a power-law model.) If we instead identify the age of the cooling flow with the cooling time at the break radius in the mass deposition profile in Fig. 12 ( kpc), we infer an age for the cooling flow of Gyr. (In both cases we assume that no intrinsic absorption acts beyond the outer edge of the cooling flow, which is reasonable if the absorbing matter is accumulated by the flow.)
In summary, we see the X-ray colour profile, image deprojection analysis and spectral data provide consistent results on the properties of the cooling flow in Abell 2390, indicating a mass deposition rate in the range and an age of Gyr.
6.5 On the rising ambient temperature profile within the cluster core
In principle, the results on the X-ray gas temperature and surface brightness within the cluster core may be used to distinguish between an NFW model for the dark matter distribution and alternative models with a steeper central cusp (e.g. Moore et al. 1999). The results for Abell 2390 presented here are certainly consistent with an NFW profile (see Fig. 7). However, given the complexity of the gas within the central 100 kpc and the relatively short exposure time of the present observation (which limits the number of independent spectra which can be extracted from the region of the cluster core), we do not attempt to explore such models here. This issue will be better addressed with Chandra data for nearer, brighter systems.
The fact that the ambient temperature profile, corrected for the effects of the cooling flow, rises with increasing radius throughout the central kpc, is interesting. In detail, the density and temperature structure in a cluster core will depend on the thermal history of the gas, as well as the underlying dark matter distribution and, subject to pressure equilibrium and convective stability, may be flat, increase or decrease with radius. As discussed in Section 4.6, the presence of relatively cool, ambient gas in the central regions of Abell 2390 may have lead to overestimates of the mass deposition rate in previous studies with ASCA and Beppo-SAX in which this region was not spatially resolved.
There are several reasons why relatively cool, dense gas might exist beyond the outer edge of the present-day cooling flow in Abell 2390. The first is that a pre-existing cooling flow may have been disturbed several Gyr ago. Cooler, denser gas could then have been spread out over several 100 kpc, with the cooling flow having so far only re-established itself within the inner kpc. A second possibility is that the densest gas from the cores of infalling subclusters may have been stripped and deposited over time in the core of the main cluster without strong shocking (Fabian & Daines 1991). The situation seen in the Chandra data for Abell 2142 (Markevitch et al. 2000) is reminiscent of this, with a sharp drop in temperature from keV to keV (and a corresponding rise in density) observed at kpc, moving inwards from northwest of the cluster centre. Such a sharp drop in temperature at these radii cannot be due to any current cooling flow in the cluster.
7 Conclusions
The main conclusions from this work may be summarized as follows:
(i) We have measured the distribution of mass in Abell 2390 using Chandra X-ray observations. The mass profile can be well-modelled by an NFW profile with a scale radius Mpc and a concentration parameter, (68 per cent confidence limits). The normalization of the mass profile may also be expressed in terms of an equivalent velocity dispersion, , in good agreement with the optically-determined value of (Borgani et al. 1999).
(ii) The best-fit Chandra mass model is in good agreement with independent measurements from strong and weak lensing studies. The mean scatter between the X-ray and lensing values within the central Mpc radius is per cent.
(iii) The X-ray gas to total mass ratio rises with increasing radius within the central 0.9 Mpc, with at Mpc. Following the usual arguments, this result on the X-ray gas mass fraction may be converted into a constraint on the mean mass density in the Universe, .
(iv) The X-ray gas temperature rises with increasing radius within the central kpc, and then remains approximately isothermal with keV out to Mpc.
(v) The azimuthally-averaged keV surface brightness profile exhibits a small core radius and a clear break at Mpc, where the slope changes abruptly from to .
(vi) The best-fit mass deposition rate from the cooling flow, determined in a consistent manner from the spectral and imaging Chandra data, lies in the range . This value is lower than previous estimates based on integrated ASCA and Beppo-SAX spectra for the entire cluster, which could not resolve the drop in the central, ambient gas temperature. We estimate an age for the cooling flow of Gyr.
Acknowledgements
We thank G. Squires for communicating his weak lensing results, R. Mushotzky for helpful comments, and P. Thomas for helpful comments and discussions. We also thank R. Johnstone and R. Schmidt for coding and discussions regarding the analysis of Chandra data. We acknowledge the support of the Royal Society.
References
- [1] Akritas M.G., Bershady M.A., 1996, ApJ, 470, 706
- [2] Allen S.W., 1998, MNRAS, 296, 392
- [3] Allen S.W., 2000, MNRAS, 315, 269
- [4] Allen S.W., Fabian A.C., 1997, MNRAS, 286, 583
- [5] Allen S.W., Fabian A.C., 1998, MNRAS, 297, L57
- [6] Allen S.W., Fabian A.C., Kneib J.-P., 1996, MNRAS, 279, 615
- [7] Allen S.W., Fabian A.C., Johnstone R.M., Nulsen P.E.J., Arnaud K.A., 2000a, MNRAS, submitted
- [8] Allen S.W. et al. 2000b, MNRAS, submitted
- [9] Anders E., Grevesse N., 1989, Geochemica et Cosmochimica Acta 53, 197
- [10] Arnaud, K.A., 1996, in Astronomical Data Analysis Software and Systems V, eds. Jacoby G. and Barnes J., ASP Conf. Series volume 101, p17
- [11] Arnaud K.A., Mushotzky R.F., 1998, ApJ, 501, 119
- [12] Bacon D.J., Refregier A., Clowe D., Ellis R., 2000, MNRAS, 318, 625
- [13] Bahcall N.A., Ostriker J.P., Perlmutter S., Steinhardt P.J., 1999, Science, 284, 1481
- [14] Balucinska-Church M., McCammon D., 1992, ApJ, 400, 699
- [15] Bartelmann M., Steinmetz M., 1996, MNRAS, 283, 431
- [16] Bartelmann M., Schneider P., preprint (astro-ph/9912508)
- [17] Bezecourt J., Soucail G., 1997, A&A, 317, 661
- [18] Böhringer H., Tanaka Y., Mushotzky R.F., Ikebe Y., Hattori M., 1998, A&A, 334, 789
- [19] Borgani S., Girardi M., Carlberg R.G., Yee H.K.C., Ellingson E., 1999, ApJ, 527, 561
- [20] Buote D.A., 2000, ApJ, 532, L113
- [21] Buote D.A., Tsai J.C., 1996, ApJ, 458, 27
- [22] Carlberg R.G., Yee H.K.C., Ellingson E., Abraham R., Gravel P., Morris S., Pritchet C.J., 1996, ApJ, 462, 32
- [23] de Grandi S., Molendi S., 1999, ApJ, 527, L25
- [24] den Hartog R., Katgert P., 1996, MNRAS, 279, 349
- [25] Dickey J.M., Lockman F.J., 1990, ARA&A, 28, 215
- [26] Ebeling H., Rangarajan F.V.N., White D.A., 2000, MNRAS, in press
- [27] Edge A.C., Stewart G.C., Fabian A.C., 1992, MNRAS, 255, 431
- [28] Edge A.C., Ivison R.J., Smail I., Blain A.W., Kneib J.-P., 1999, MNRAS, 306, 599
- [29] Eke V.R., Navarro J.F., Frenk C.S., 1998, ApJ, 503, 569
- [30] Ettori S., Fabian A.C., 1999, MNRAS, 305, 834
- [31] Ettori S., Allen S.W., Fabian A.C., 2000, MNRAS, in press
- [32] Evrard A.E., 1997, MNRAS, 292, 289
- [33] Fabian A.C., Daines S.J., 1991, MNRAS, 252, L17
- [34] Fabian A.C., Hu E.M., Cowie L.L., Grindlay J., 1981, ApJ, 248, 47
- [35] Fabian A.C. et al. 2000a, MNRAS, 315, L8
- [36] Fabian A.C. et al. 2000b, MNRAS, in press
- [37] Fadda D., Girardi M., Giuricin G., Mardirossian F., Mezzetti M., 1996, ApJ, 473, 670
- [38] Fort B., Mellier Y., 1994, A&AR, 5, 239
- [39] Frenk C.S., White S.D.M., Efstathiou G., Davis M., 1990, ApJ, 351, 10
- [40] Frye B., Broadhurst T., 1998, ApJL, 499, 115
- [41] Fukugita M., Hogan C.J., Peebles P.J.E., 1998, ApJ, 503, 518
- [42] Geller M.J., Diaferio A., Kurtz M.J., 1999, ApJ, 517, 23
- [43] Hutchings J.B., Balogh M.L., 2000, AJ, 119, 1123
- [44] Irwin J.A., Bregman J.N., 2000, ApJ, 538, 543
- [45] Johnstone R.M., Fabian A.C., Edge A.C., Thomas P.A., 1992, MNRAS, 255, 431
- [46] Jones C., Forman W., 1984, ApJ, 276, 38
- [47] Kaastra J.S., Mewe R., 1993, Legacy, 3, HEASARC, NASA
- [48] Kassiola A., Kovner I., Blandford R.D., 1992, ApJ, 396, 10
- [49] Kikuchi K., Tae F., Ezawa H., Yamasaki N.Y., Ohashi T., Fukazawa Y., Ikebe Y., 1999, PASJ, 51, 301
- [50] Kneib J.-P., Mellier Y., Pelló R., Miralda-Escudé J., Le Borgne J.-F., Böhringer H., Picat J.-P., 1995, A&A, 303,27
- [51] Koranyi D.M., Geller M.J., 2000, AJ, 119, 44
- [52] Kriss G.A., Cioffi D.F., Canizares C.R., 1983, ApJ, 272, 439
- [53] Lemonon L., Pierre M., Cesarsky C.J., Elbaz D., Pelló R., Soucail G., Vigroux L., 1998, A&A, 334, L21
- [54] Lewis A.D., Ellingson E., Morris S.L., Carlberg R.G., 1999, 517, 587
- [55] Liedhal D.A., Osterheld A.L., Goldstein W.H., 1995, ApJ, 438, L115
- [56] Loeb A., Mao, S., 1994, ApJ, 435, 109L
- [57] Lucey J.R., 1983, MNRAS, 204, 33
- [58] Markevitch M., Forman W.R., Sarazin C.L., Vikhlinin A., 1998, ApJ, 503, 77
- [59] Markevitch M. et al. , 2000, ApJ, 541, 542
- [60] Mazure A., et al. , 1996, A&A, 310, 31
- [61] McNamara B.R. et al. , 2000, ApJL, 534, 135
- [62] Mellier Y., 1999, ARA&A, 37, 127
- [63] Miralda-Escudé J., Babul A., 1995, ApJ, 449, 18
- [64] Moore B., Quinn T., Governato F., Stadel J., Lake G., 1999, MNRAS, 310, 1147
- [65] Narasimha D., Chitre S.M., 1993, A&A, 280, 57
- [66] Navarro J.F., Frenk C.S., White S.D.M., 1997,ApJ, 490, 493
- [67] Nulsen P.E.J., 1998, MNRAS, 297, 1109
- [68] O’Meara J.M., Tytler D., Kirkman D., Suzuki N., Prochaska J.X., Lubin D., Wolfe A.M., 2000, ApJ, submitted (astro-ph/0011179)
- [69] Pelló R., Sanahuja B., Le Borgne J.F., Soucail G., Mellier Y., 1991, ApJ, 366, 405
- [70] Pelló R. et al. , 1999, A&A, 346, 359
- [71] Pierre M., Le Borgne J.F., Soucail G., Kneib J.-P., 1996, A&A, 311, 413
- [72] Roettiger K., Burns J.O., Loken C., 1996, ApJ, 473, 651
- [73] Sarazin C.L., 1988, X-ray emission from clusters of galaxies. Cambridge Univ. Press, Cambridge
- [74] Smail I., Couch W.J., Ellis R.S., Sharples R.M., 1995, ApJ, 440, 501
- [75] Smail I., Ellis R.E., Dressler A., Couch W.J., Oemler A. Sharples R.M., Butcher H., 1997, ApJ, 479, 70
- [76] Squires G., Kaiser N., Babul A., Fahlman G., Woods D., Neumann D.M., Böhringer H., 1996, ApJ, 461, 572
- [77] Squires G., Neumann D.M., Kaiser N., Arnaud M., Babul A., Böhringer H., Fahlman G., Woods D., 1997, ApJ, 482, 648
- [78] Thomas P.A., Muanwong O., Pearce F.R., Couchman H.M.P., Edge A.C., Jenkins A., Onuora L., 2000, MNRAS, submitted (astro-ph/0007348)
- [79] van Haarlem M.P., Frenk C.S., White S.D.M., 1997, MNRAS, 287, 817
- [80] Waxman E., Miralda-Escudé J., 1995, ApJ, 451, 451
- [81] Weisskopf M.C., Tananbaum H.D., Van Speybroeck L.P., O’Dell S.L., 2000, SPIE 4012, 1 (astro-ph/0004127)
- [82] White D.A., 2000, MNRAS, 312, 663
- [83] White D.A., Fabian A.C., 1995, MNRAS, 273, 72
- [84] White D.A., Jones C., Forman W., 1997, MNRAS, 292, 419
- [85] White S.D.M., Efstathiou G., Frenk C.S., 1993, MNRAS, 262, 1023
- [86] Wise M.W., Sarazin C.L., 2000, ApJ, in press (astro-ph/9903119)
- [87] Wu X., Fang L., 1997, ApJ, 483, 62
- [88] Wu X., 2000, MNRAS, 316, 299
| Model A | /DOF | |||
|---|---|---|---|---|
| 98.2/79 | ||||
| 132.5/123 | ||||
| 159.7/163 | ||||
| 96.9/98 | ||||
| 78.9/82 | ||||
| 69.0/74 | ||||
| 128.9/121 | ||||
| 106.7/108 | ||||
| 100.6/105 | ||||
| 89.1/88 | ||||
| 62.5/67 | ||||
| 46.1/52 | ||||
| — | 410.4/428 |
| Model B | /DOF | |||
|---|---|---|---|---|
| 91.8/78 | ||||
| 128.3/122 | ||||
| 154.7/162 | ||||
| 94.5/97 | ||||
| 77.3/81 | ||||
| 68.6/73 | ||||
| 127.8/120 | ||||
| 106.7/107 | ||||
| 98.0/104 | ||||
| 89.1/87 | ||||
| 62.3/66 | ||||
| 45.5/51 | ||||
| 409.9/427 |
| EMISSION MODEL | |||||
| SINGLE-PHASE | MULTIPHASE | ||||
| ABSORPTION MODEL | A | C1 | C2 | ||
| CASE (i) | |||||
| GALACTIC ABSORPTION | — | ||||
| /DOF | 203.1/133 | 203.1/132 | 203.1/132 | ||
| CASE (ii) | |||||
| VARIABLE ABSORPTION | — | ||||
| BY COLD GAS (z=0) | |||||
| /DOF | 141.6/132 | 137.9/131 | 137.9/131 | ||
| CASE (iii) | |||||
| INTRINSIC ABSORPTION | — | ||||
| BY COLD GAS () | |||||
| /DOF | 143.5/132 | 143.7/131 | 142.9/131 | ||
| CASE (iv) | |||||
| PARTIAL COVERING | — | ||||
| BY COLD GAS () | |||||
| /DOF | 143.5/131 | 143.7/130 | 142.9/130 | ||
| CASE (v) | |||||
| SIMPLE EDGE | — | ||||
| () | |||||
| /DOF | 135.8/131 | 141.9/130 | 140.6/130 | ||