[
FERMILAB–Pub–00–239-A
What Is The BBN Prediction for the Baryon Density
and How Reliable Is It?
Abstract
Together, the standard theory of big-bang nucleosynthesis (BBN) and the primeval deuterium abundance now very precisely peg the baryon density. Based upon our analysis of the deuterium data and the theoretical uncertainties associated with the BBN predictions, we determine (95% C.L.), with the uncertainty from the measured deuterium abundance about twice that from the predicted abundance. We discuss critically the reliability of the BBN baryon density, and in light of possible systematic uncertainties also derive a very conservative range. We conclude that within the standard cosmology and standard theory of BBN a baryon density (the central value implied by recent CMB anisotropy measurements) simply cannot be accommodated.
pacs:
26.35.+c, 98.80.Ft, 98.80.Es]
I Introduction
Since the determination of its solar system abundance by the Apollo astronauts almost thirty years ago, deuterium has been used to constrain the density of ordinary matter [1, 2]. The reason is simple: big-bang deuterium production has a strong dependence upon the baryon density (), and astrophysical processes since have only destroyed deuterium [3].
Until recently, deuterium was used to set an upper limit to the baryon density (around 10% of critical density), based upon the fact that the big bang must produce at least the amount of deuterium seen in the local interstellar medium (ISM). Together with measurements of the abundances of the other light elements produced in the big bang, a concordance interval for the baryon density was derived, [4]. For two decades the big-bang nucleosynthesis (BBN) baryon density has stood as the best determination of the amount of ordinary matter and the linchpin in the case for nonbaryonic dark matter [5].
A dramatic change occurred in 1998 when the abundance of deuterium was measured in high-redshift clouds of pristine gas backlit by even more distant quasars. Tytler and his collaborators have now determined deuterium abundances for three clouds and derived upper limits for a number of other clouds [6, 7]. Based upon these and other results we infer a primeval deuterium abundance, (D/H) (95% C.L.), which leads to a precision determination of the baryon density [8]:
| (1) |
is the fraction of critical density contributed by baryons, , and the physical baryon density .
A key test of the BBN prediction, and indeed the consistency of the standard cosmology itself, lies ahead. Measurements of cosmic microwave background (CMB) anisotropy on small angular scales can ultimately determine the baryon density to an accuracy of around 1%. The physics involved is very different: gravity-driven acoustic oscillations of the photon-baryon fluid when the Universe was around 500 000 years old. The first step toward this important goal was taken recently when the BOOMERANG and MAXIMA CMB experiments reported results for the baryon density: (95% C.L.) [9]. At about the 2 level, this independent measure of the amount of ordinary matter agrees with the BBN prediction and supports the longstanding BBN argument for non-baryonic dark matter.
The CMB determination of the baryon density should improve dramatically over the next few years, making a very precise comparison of the two methods possible. The difference between the BBN and CMB baryon densities has already triggered lively discussion in the literature [10]. Motivated by this, we have written this paper to explain the BBN prediction for the baryon density and the associated uncertainties.
II Uncertainties in the predicted deuterium abundance
The standard scenario for big-bang nucleosynthesis begins with the assumptions of (i) the isotropic and homogeneous Friedmann-Robertson-Walker (FRW) cosmology, (ii) three massless (or very light) neutrino species, (iii) zero (or very small) chemical potentials for the neutrino species, and (iv) spatial homogeneity of the baryon density. Within the standard theory, the predictions for the light-element abundances depend only upon the baryon density (more precisely, baryon-to-photon ratio) and the dozen nuclear-reaction rates that enter the calculation.
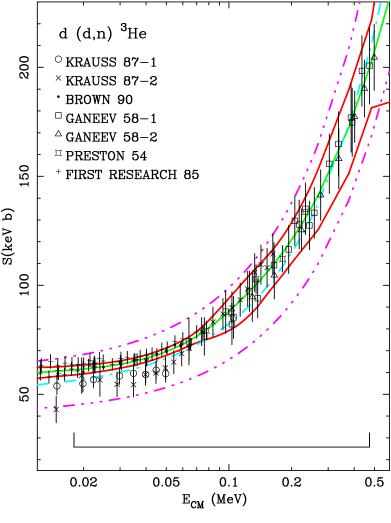
Essentially all of these rates have been measured at energies relevant for BBN, and because large numbers of measurements exist for most of the cross sections, reliable estimates of the uncertainties can be made (see Fig. 1). We have used all the extant nuclear data to estimate directly the uncertainties in the BBN predictions [11, 12]. We integrated the nuclear data over thermal distributions to obtain thermally averaged rates. Then, uncertainties in the predictions were estimated by a Monte Carlo method, repeatedly calculating the abundances with individual cross-section data being varied according to their quoted experimental uncertainties (also accounting for correlated normalization errors). From the resulting distribution of predicted abundances we have derived the uncertainties.

The uncertainty in the D/H prediction around arises mainly from the reactions , , and , with a smaller contribution from (see Fig. 2). The total uncertainty from all of these combined is at 95% C.L., and increases slightly for larger . Combining this with the slope of the power-law dependence of D/H on baryon density, we obtain a nuclear contribution to the uncertainty in the deuterium-derived baryon density of 3.4% (95% C.L.).
We end this discussion with two comments. First, BBN actually determines the baryon-to-photon ratio when the Universe was about 100 seconds old, (95% C.L.); to translate this into a baryon density today two things are needed: (i) average mass per baryon; and (ii) the assumption of adiabatic expansion since BBN [14]. At the 1% level, the average mass per baryon depends upon chemical composition; for the post-BBN primordial mix or universal solar abundance, g. Adiabatic expansion since BBN is a feature of the standard cosmology. With these assumptions, (95% C.L.), where the error comes from the uncertainty in the CMB temperature, K (95% C.L.) [15].
The second comment is an explanation of why our estimates of the light-element uncertainties are about a factor of two to three smaller than the previous very thorough study by Smith et al. (SKM) [13] in 1993. Some of it is simply improved measurements. However, the bulk of the difference involves technique. As described, our analysis used all the data directly, each data point weighted by its error bar. SKM estimated limits to cross sections by constructing envelopes (motivated by theory) forced to contain most of the measurements, and then from these, derived overall rate uncertainties. Although much simpler to implement, this technique gives too much weight to experiments with large error bars and to cross-section data in energy intervals that are not as important to BBN, and results in unnecessarily conservative error estimates.
III Uncertainties in the observed deuterium abundance
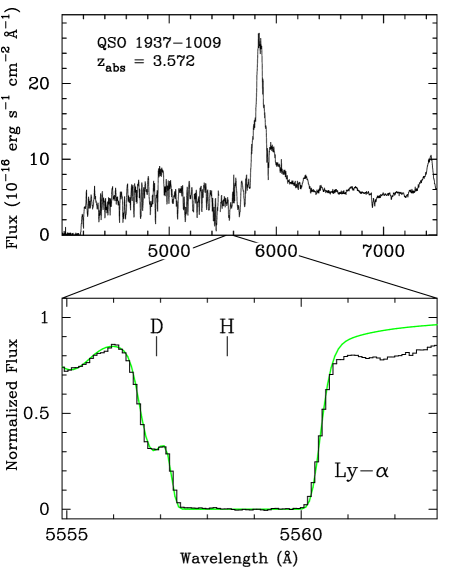
In 1976 Adams [16] pointed out that the primordial abundance of deuterium could be determined by observations of Lyman-series absorption of quasar light by intervening high-redshift () clouds of pristine gas, by using the fact that the deuterium feature is isotopically shifted by 82 km/s to the blue (see Fig. 3). Successfully implementing this idea awaited the advent of the 10-meter Keck telescope and its HIRES spectrograph [17]. At present, four absorbing gas clouds place stringent constraints on the primeval deuterium abundance, and another five provide independent consistency checks. Here we briefly summarize the state of the observations, and discuss possible systematics. For a detailed review, see Ref. [6].
The technique is simple and straightforward; the relative abundances of deuterium and hydrogen are measured through absorption profile fitting of the Lyman series. In these clouds of virtually primordial material (metal abundance less than 1% of solar), the relative column densities of neutral deuterium and neutral hydrogen yield the primeval D/H ratio without correction for ionization or destruction of deuterium by stars [27]. The major obstacle is the discovery of systems that are suitable for deuterium detection. To observe the weak deuterium feature, the neutral hydrogen column density must exceed about , and such clouds are relatively rare. The current rate of success is approximately 4 suitable clouds per 100 quasars studied. (Note, for each high-redshift quasar there are hundreds of intervening gas clouds, but typically only one with sufficiently high column density to see deuterium.)
There are three systems at where deuterium has been detected: D/H = [18]; [19] and [7] (95% C.L.). The third and newest system has a much higher hydrogen column density, and deuterium is seen in Lyman-, , 5, 6, and 7. A fourth system provides a strong upper limit: D/H (95% C.L.) [20].
Using the likelihood distributions for the first two detections and a gaussian likelihood for the new detection, we infer (D/H) (95% C.L.). We note that the dispersion of the three detections is somewhat larger than one might expect based upon the estimated error of the mean, though not unreasonably so: The reduced for two degrees of freedom has a probability of 3%.
Another five extragalactic absorbers that give limits on D/H at high redshift have been analyzed [21, 22]. They add no weight to the D/H determination, but are all consistent with (D/H). Fig. 4 summarizes the deuterium detections and upper limits.
Earlier claims of a factor of ten higher deuterium abundance in an absorption cloud associated with Q0014+8118 [23] were shown to be a result of misidentification of the putative deuterium feature [24]. The aforementioned upper-limit systems also argue strongly against high deuterium. In addition, recent analyses of a low redshift system suggestive of high D/H [25, 26] are unconvincing due to lack of spectral coverage of the entire Lyman series.
Although the technique is simple and direct, there are two important sources of systematic uncertainty. The first arises from “hydrogen interlopers,” low column-density gas clouds that are coincidentally situated to mimic deuterium absorption [22, 26, 27, 28]. Interlopers result in a one-sided systematic bias which can lead to an overestimation of D/H. Absorbing clouds are ubiquitous at high redshifts [29] and the chance probability of an interloper is non-negligible.
The probability of an interloper depends on many factors, including redshift, neutral hydrogen column density, and velocity dispersion as well as the intrinsic value of D/H. Here, we present an a posteriori estimate of the probability for hydrogen contamination at the level of 10% or more in each system. In the three absorption systems with detections, the a priori probability for 10% contamination is: , and respectively, assuming that the interloper must fall within 5 km/s of the expected position of deuterium absorption. (Because of its very high hydrogen column density, the third system is particularly immune to the possibility of an interloper.) Multiplying these a priori probabilities by the number of clouds searched (about 25), we arrive at estimates for the a posteriori probabilities, , , respectively. The final joint probability that all three systems are contaminated by more than 10% is less than 0.1%.
This small probability, and the consistency of the three deuterium detections, argues strongly for deuterium detections rather than hydrogen interlopers. One can attempt to correct for hydrogen contamination by assuming a flat prior for contamination of 0 to 10% in the lower column-density systems, Q1009 and Q1937. The likelihood for (D/H)P, in this case, has a central value that is 3% lower and an uncertainty that is slightly (20%) larger. This analysis further suggests that contamination by interlopers is not a significant systematic; further, allowing for this small contamination lessens the possible significance of the larger than expected scatter in the derived deuterium abundances.

The other important source of systematic error involves model fitting of absorption line profiles in quasar spectra. A small number of Voigt profiles were used to model the deuterium absorption systems [18, 19]. The effect of model-parameter choice has been studied extensively in the measurement of D/H at high redshift [22, 30], as well as in the local interstellar medium [31, 32]. Including the uncertainty of the unabsorbed quasar continuum, the estimated possible systematic bias is at the level of 5%. This bias could affect all sightlines, but it should have a different magnitude and direction from one system to the next.
Finally, it has been argued that astrophysical mechanisms that significantly alter the deuterium abundance in these clouds are implausible [27]; the relatively small intrinsic scatter allowed by the current data argues against any significant post-BBN production or destruction, as more scatter would be expected. This argument is weaker than those above, since there could be some real scatter in the data.
IV Why BBN Cannot Accommodate
Because the uncertainty associated with the CMB baryon density is significant (about 15%), there is nothing special about the central value, . Nonetheless, it is interesting and instructive to ask if BBN could accommodate such a high value. The answer is a resounding no for three reasons: D, 7Li and 4He, in that order. For a baryon density of , the predicted abundances are: (D/H); (7Li/H) ; and (95% C.L.). All three conflict significantly with observations.
Aside from high-redshift hydrogen clouds, the most precise determination of the deuterium abundance is that measured with the HST for the local ISM, (D/H) (95% C.L.) [31]. The technique is the same, except on a smaller scale: absorption by clouds of neutral gas along the lines of sight to many nearby stars is measured. (Variations in the local D/H, both upward and downward, have been reported and may be statistically significant [32, 33]. If real, they probably reflect the inhomogeneity of the local ISM.) The ISM value for D/H is essentially equal to the predicted primordial abundance for and would imply that the local ISM is pristine material, because astrophysical processes since BBN have only destroyed deuterium. This is in stark contrast to the abundance of heavy elements (around 2%) which indicates about half the material has been processed through stars, and thus implies a primeval deuterium abundance of about . Further, the D/H prediction at is also lower than the abundance inferred for the pre-solar nebula, (D/H) (95% C.L.) [34].
The predicted 7Li abundance is about six times that measured in the atmospheres of old pop II halo stars, (7Li/H) [35]. While there is lively debate about the possible depletion of 7Li in these stars (by rotationally driven mixing and convective burning), there is a consensus that any such depletion must be less than about a factor of two [36]. Thus, 7Li too is a serious problem for this baryon density.
Finally, though there is no consensus about the primeval abundance of 4He, and discussion continues about possible systematic error, is inconsistent with the two largest compilations of 4He measurements. The primordial 4He abundances inferred from these two studies of metal-poor, extragalactic Hii regions are: [37] and [38], both at 95% C.L.
V A very conservative range for the BBN baryon density
We believe our stated range for the BBN baryon density, (95% C.L.) is well justified. However, two recent reviews have quoted broader 95% C.L. intervals: [39] and [40]. The differences are simple to explain: The first review [39] used the older SKM analysis for the error in the predicted deuterium abundance (see Fig. 2). The second review [40] still allows for the possibility that the primeval D/H is as large as . As described above, we believe the case for high primeval D/H is simply no longer tenable.
The question remains, just how high can the baryon density be pushed. To answer that question and obtain a “very conservative range” for the baryon density, we revert to the older, more conservative SKM analysis of the input nuclear data – though unlikely, our Monte Carlo analysis could be driven by an experiment with understated errors – and use a very conservative range for the primeval deuterium abundance, (D/H).
This range for the primeval deuterium abundance is derived from a weighted average of the three detections, with the error of the mean being estimated from the standard deviation of the three detections using the standard formula. By so doing, we are in effect disregarding the estimated errors for the individual measurements, and instead using the dispersion of the measured values to estimate the error of the mean. If the statistical errors are larger than estimated or if there are unknown systematic errors, this approach might more accurately reflect the underlying errors. (We note that O’Meara et al. [7], motivated by the larger than expected dispersion of the three detections, have advocated a similar approach for estimating the uncertainty in the primeval deuterium abundance.)
Adding the theoretical and observational uncertainties discussed above in quadrature, we obtain a very conservative range for the BBN baryon density: , which is about twice the width of what we believe to be a well justified 95% confidence interval. Precisely because this very conservative range is predicated upon the possibility of systematic error, or error that is not well quantified by a Gaussian distribution function, we have not assigned a confidence level to it. We also note that at the upper limit of this extreme range, , all the light-element abundances, (D/H), (7Li/H) and , are uncomfortably different from their inferred values.
VI Concluding remarks
A flood of high-precision data – from CMB measurements to very large redshift surveys to precision D/H determinations – is transforming cosmology. Soon, no one will remember a time when the phrase precision cosmology was an oxymoron. The new data are testing our most promising ideas about the early Universe as well as the consistency of the big-bang framework itself. A comparison between the BBN and CMB baryon densities will be one of the most important consistency tests.
The use of BBN to determine the baryon density is a mature subject. The predictions have been scrutinized and the required nuclear data are measured at the relevant energies. The determination of the deuterium abundance in nearly pristine high-redshift gas clouds now involves nine systems, and considerable attention has been paid to systematic error. While our stated uncertainty in the BBN baryon density is small, (95% C.L.), it is well justified (our very conservative range is only twice as broad). As more deuterium systems are discovered and analyzed, the uncertainty will shrink. Even without improvement in the nuclear data, a precision of about 4% (at 95% C.L.) is possible.
On the other hand, CMB anisotropy measurements have just recently achieved sufficient angular resolution to probe the baryon density. The first result, a 15% determination of the baryon density, , is encouraging. It supports the longstanding BBN argument for nonbaryonic dark matter and agrees with the BBN baryon density at about the level. It is important to note that the CMB results for depend upon the number of free cosmological parameters used in the analysis and the priors assumed for them [10]. The CMB determination will improve significantly over the next few years as more experiments probe the sub-degree angular scales, making a more robust comparison with the BBN prediction possible.
As we have emphasized, there are three good reasons why BBN cannot tolerate : the predicted abundances of D, 7Li and 4He; all would conflict significantly with observed abundances. The standard cosmology and standard BBN cannot – and probably will not have to – accommodate a baryon density this large.
Should future CMB measurements zero in on a baryon density higher than our extreme upper limit, , they would, in our opinion, implicate nonstandard cosmology or BBN. Among the possibilities are: large neutrino chemical potentials [41], entropy reduction since BBN due to exotic physics [14], a decaying tau neutrino [42], neutrino oscillations [43], or the inconsistency of the standard cosmology. At the moment, none of these possibilities are particularly compelling, and we will wait to see if they are necessary.
Acknowledgements.
This work was supported by the DOE (at Chicago and Fermilab) and by the NASA (at Fermilab by grant NAG 5-7092). We thank Wayne Hu, Gary Steigman, Max Tegmark, and David Tytler for useful comments.REFERENCES
- [1] J. Geiss et al, J. Geophys. Res. 75, 5972 (1970); H. Reeves, J. Audouze, W.A. Fowler and D.N. Schramm, Astrophys. J. 179, 909 (1973).
- [2] J.B. Rogerson and D.G. York, Astrophys. J. Lett. 186, L95 (1973).
- [3] R. Epstein, J. Lattimer and D.N. Schramm, Nature (London) 276, 198 (1976).
- [4] C.J. Copi, D.N. Schramm and M.S. Turner, Science 267, 192 (1995).
- [5] M.S. Turner, Phys. Rep. 333-334, 619 (2000).
- [6] D. Tytler et al, Phys. Scr. T85, 12, (2000) (astro-ph/0001318).
- [7] J. M. O’Meara et al, astro-ph/001179.
- [8] S. Burles, K. M. Nollett and M.S. Turner, Astrophys. J., submitted (astro-ph/0010171).
- [9] A.H. Jaffe et al, astro-ph/0007333.
- [10] See e.g., W. Hu et al, astro-ph/0006436; M. Tegmark and M. Zaldarriaga, Phys. Rev. Lett. 85, 2240 (2000); M. White et al, astro-ph/0004385; A. Lange et al, astro-ph/0005004; M. Tegmark et al, Phys. Rev. D (to be published), astro-ph/0008167; W. H. Kinney et al, ibid. (to be published). astro-ph/0007375.
- [11] S. Burles et al, Phys. Rev. Lett. 82, 4176 (1999).
- [12] K. M. Nollett and S. Burles, Phys. Rev. D 61, 123505 (2000).
- [13] M. Smith, L. Kawano, and R. Malaney, Astrophys. J. Suppl. Ser. 85, 219 (1993); also see earlier work by L.M. Krauss and P. Romanelli, Astrophys. J. 358, 47 (1990).
- [14] M. Kaplinghat and M.S. Turner, astro-ph/0007454.
- [15] J. Mather et al, Astrophys. J. 512, 511 (1999).
- [16] F.T. Adams, Astron. Astrophys. 50, 461 (1976).
- [17] S. S. Vogt et al, Proc. SPIE 2198, 362 (1994).
- [18] S. Burles and D. Tytler, Astrophys. J. 499, 699 (1998).
- [19] S. Burles and D. Tytler, Astrophys. J. 507, 732 (1998).
- [20] D. Kirkman et al, Astrophys. J. 529, 655 (2000).
- [21] E. J. Wampler et al, Astron. Astrophys. 316, 33 (1996); R. F. Carswell et al, Mon. Not. R. astron. Soc. 278, 506 (1996); P. Molaro et al, Astron. Astrophys 349, L13 (1999).
- [22] S. Burles and D. Tytler, in The Primordial Nuclei and Their Galactic Evolution, eds. N. Prantzos, M. Tosi, and R. von Steiger (Kluwer, Dordrecht, 1998).
- [23] A. Songaila et al, Nature (London) 368, 599 (1994); M. Rugers and C.J. Hogan, Astrophys. J. Lett. 459, L1 (1996)
- [24] S. Burles et al, Astrophys. J. 519, 18 (1999).
- [25] J. K. Webb et al, Nature (London) 388, 250, (1997).
- [26] D. Tytler et al, Astron. J. 117, 63 (1999).
- [27] K. Jedamzik and G. M. Fuller, Astrophys. J. 483, 560 (1997).
- [28] G. Steigman, Mon. Not. R. Astron. Soc. 269, 53L (1994).
- [29] D. Kirkman and D. Tytler, Astrophys. J. 484, 672 (1997); T.-S. Kim et al, Astron. J. 114, 1 (1997); M. Rauch, Annu. Rev. of Astron. and Astrophys. 36, 267 (1998).
- [30] S. Burles, Ph.D. thesis, Univ. of California, San Diego (1997)
- [31] J. Linsky et al, Astrophys. J. 451, 335 (1995); J. Linsky, in The Primordial Nuclei and their Galactic Evolution, eds. N. Prantzos, M. Tosi, and R. Von Steiger (Kluwer Academic Publishers, Dordrecht, 1998), p.285; N. Piskunov et al, Astrophys. J. 474, 315 (1997).
- [32] A. Vidal-Madjar et al, Astron. Astrophys. 338, 694 (1998).
- [33] See e.g., A. Vidal-Madjar and C. Gry, Astron. Astrophys. 138, 285 (1984); G. Sonneborn et al, astro-ph/0007238, and Ref. [31].
- [34] J. Gloeckler and G. Geiss, Space Science Reviews, 84, 239 (1998).
- [35] P. Bonifacio and P. Molaro, Mon. Not. R. astron. Soc. 285, 847 (1997). The more recent work of S. G. Ryan et al, Astrophys. J. 523, 654 (1999) examines 23 metal-poor stars and finds a mean of . However, they also find a trend of 7Li/H with metallicity, so interpretation of this result is more complicated.
- [36] See e.g., M.H. Pinsonneault et al, Astrophys. J. 527, 180 (1999); S. Vauclair and C. Charbonnel, Astron. Astrophys. 295, 715 (1995).
- [37] Y. I. Izotov and T. X. Thuan, Astrophys. J. 500, 188 (1998).
- [38] K.A. Olive, G. Steigman and E. Skillman, Astrophys. J. 483, 788 (1998).
- [39] K.A. Olive et al, Phys. Rept. 333-334, 389 (2000).
- [40] K.A. Olive, in Particle Data Group, D. Groom et al., Eur. Phys. J. C 15, 1 (2000), p 133.
- [41] H. Kang and G. Steigman, Nuc. Phys. B372, 494 (1992); J. Lesgourgues and M. Peloso, Phys. Rev. D 62, 081301 (2000); M. Orito et al, astro-ph/0005446; S. Esposito et al, Phys. Rev. D (to be published), astro-ph/0007419.
- [42] G. Gyuk and M.S. Turner, Phys. Rev. D 50, 6130 (1994); S.H. Hansen and F.L. Villante, Phys. Lett. B 486, 1 (2000).
- [43] P. DiBari and R. Foot, hep-ph/0008258