Diffraction-limited near-IR imaging at Keck reveals asymmetric, time-variable nebula around carbon star CIT 6
Abstract
We present multi-epoch, diffraction-limited images of the nebula around the carbon star CIT 6 at 2.2µm and 3.1µm from aperture masking on the Keck-I telescope. The near-IR nebula is resolved into two main components, an elongated, bright feature showing time-variable asymmetry and a fainter component about 60 milliarcseconds away with a cooler color temperature. These images were precisely registered (35 milliarcseconds) with respect to recent visible images from the Hubble Space Telescope (Trammell et al. 2000), which showed a bipolar structure in scattered light. The dominant near-IR feature is associated with the northern lobe of this scattering nebula, and the multi-wavelength dataset can be understood in terms of a bipolar dust shell around CIT 6. Variability of the near-IR morphology is qualitatively consistent with previously observed changes in red polarization, caused by varying illumination geometry due to non-uniform dust production. The blue emission morphology and polarization properties can not be explained by the above model alone, but require the presence of a wide binary companion in the vicinity of the southern polar lobe. The physical mechanisms responsible for the breaking of spherical symmetry around extreme carbon stars, such as CIT 6 and IRC+10216, remain uncertain.
1 Introduction
As evidenced by its primary designation, CIT 6 (= RW LMi = GL 1403 = IRC +30219 = IRAS 10131+3049) was discovered as a bright infrared source without a known visible counterpart at the time of the Caltech infrared survey (Ulrich et al. 1966). The identification of CIT 6 as a carbon star is based on its near-infrared CN bands (Wisniewski et al. 1967; Gaustad et al. 1969) and its thick carbon-rich dust shell, responsible for the heavy visible obscuration (e.g., Strecker & Ney 1974). Monitoring of the infrared variability, first recognized by Ulrich et al. (1966), has led to an established period of 628 days for this long-period variable (Alksnis & Khozov 1975; Alksnis 1995; Taranova & Shenavrin 1999). Based on the pulsational period, the distance to CIT 6 has been estimated by Cohen & Hitchon (1996) as 40050 pc from application of the period-luminosity relations established for O-rich Miras (LMC and galactic) and C-rich Miras (LMC only).
Both the visible and infrared flux from CIT 6 is highly polarized, indicating an asymmetric distribution of circumstellar material (Kruszewski 1968; Dyck et al. 1971). In addition, the fractional polarization is variable (Kruszewski 1971; Dyck et al. 1971; Kruszewski 1973; Alksnis & Khozov 1975) and the polarization angle is currently strongly wavelength-dependent, changing 90° between the blue and the red (Kruszewski 1973; Cohen & Schmidt 1982; Trammell et al. 1994). This distinctive behavior is likely linked to the excess UV/blue flux and unusual emission lines which have been observed, perhaps due to the presence of an unseen (hot) companion (Alksnis et al. 1988) or circumstellar shocks (Cohen 1980; Cohen & Schmidt 1982).
Although no previous high resolution imaging of this source has been reported, the characteristic sizes of the near- and mid-infrared emission regions have been measured. Dyck et al. (1984) used speckle interferometry to estimate the 2.2µm, 3.5µm, and 4.8µm sizes to be 70 mas, 100 mas, and 144 mas respectively (Gaussian FWHM). In addition, Lipman (1998) reported a 11µm FWHM of 150 mas using the Infrared Spatial Interferometer.
Recently developed observing techniques, from both the ground and space, allow the asymmetries of the dust envelope to be observed directly. In this paper we report multi-epoch, diffraction-limited observations of the circumstellar dust shell at 1.6µm, 2.2µm, and 3.1µm from the Keck-I telescope. Using aperture masking interferometry, we attain similar spatial resolution in the infrared to that of the Hubble Space Telescope in the visible, and the brightness distributions at these different wavelengths have been registered and compared in order to probe the circumstellar environment of this enigmatic system.
2 Observations
2.1 Infrared Interferometry with Keck-I
Aperture masking interferometry was performed by placing aluminum masks in front of the Keck-I infrared secondary mirror. This technique converts the 10-m primary mirror into an interferometric array, allowing the Fourier amplitudes and closure phases for a range of baselines to be recovered with minimal “redundancy” noise (e.g., Baldwin et al. 1986). In this experiment, both non-redundant and doubly-redundant pupil configurations were employed. The Maximum Entropy Method (MEM) (Gull & Skilling 1983; Sivia 1987) was used to reconstruct diffraction-limited images from the interferometric data. MEM does produce structure in the maps beyond the formal diffraction limit, an extrapolation based on the positivity and finite-support image constraints, as well as the “maximum entropy” regularization scheme. In some cases, this structure can be spurious and result in well-known MEM artifacts, such as ringing of point sources embedded in nebulosity (Narayan & Nityananda 1986). For CIT 6, strong (non-zero) closure phase signals suppress these artifacts and result in a high fidelity map. In order to check the reliability of the reconstructions, MEM results were compared to the results of the CLEAN reconstruction algorithm (Högbom 1974). Results were always consistent, with smoothed MEM maps being comparable to the the results of CLEAN, which does not generate similar super-resolution and hence has less fine structure in its images. Further engineering and performance details may be found in Monnier (1999) and Tuthill et al. (2000b).
CIT 6 was observed at 6 different epochs between 1997 January and 2000 January, at the Keck-I telescope using the Near-Infrared Camera (Matthews & Soifer 1994; Matthews et al. 1996) and with a variety of aperture masks. Important observing information can be found in Table 1, including spectral filter characteristics, the number of speckle frames, and the unresolved stars used for calibrating the atmosphere plus telescope transfer function. In all cases, the integration time of each frame was 0.137 s.
| Date | FWHM | Number of | Calibrator | Aperture Maskaa15- and 21-Hole Golay masks refer to non-redundant geometries of 35-cm holes with longest baselines of 9.26-m and 9.55-m respectively, as projected onto the primary mirror. The annulus mask is doubly-redundant with a projected inner and outer radii of 8.22-m and 8.73-m. | |
|---|---|---|---|---|---|
| (U.T.) | (m) | (m) | Frames | Star | |
| 1997 January 30 | 2.260 | 0.053 | 100 | UMa | 15-Hole Golay |
| 2.260 | 0.053 | 200 | UMa | Annulus | |
| 3.083 | 0.101 | 100 | UMa | 15-Hole Golay | |
| 3.083 | 0.101 | 200 | UMa | Annulus | |
| 1997 December 17 | 1.658 | 0.333 | 100 | HD 83362 | Annulus |
| 2.260 | 0.053 | 100 | Leo | Annulus | |
| 2.269 | 0.155 | 100 | Leo/ Hya | 21-Hole Golay | |
| 3.083 | 0.101 | 100 | Leo | Annulus | |
| 3.083 | 0.101 | 200 | Leo/ Hya | 21-Hole Golay | |
| 1997 December 19 | 2.260 | 0.053 | 100 | UMa | 21-Hole Golay |
| 3.083 | 0.101 | 100 | UMa | 21-Hole Golay | |
| 1998 April 15 | 2.269 | 0.155 | 100 | UMa | 21-Hole Golay |
| 3.083 | 0.101 | 100 | UMa | 21-Hole Golay | |
| 1998 April 16 | 1.658 | 0.333 | 100 | HD 86728 | Annulus |
| 2.269 | 0.155 | 100 | HD 86728 | Annulus | |
| 3.083 | 0.101 | 100 | UMa | Annulus | |
| 1998 June 5 | 2.269 | 0.155 | 100 | UMa | 21-Hole Golay |
| 3.083 | 0.101 | 100 | UMa | 21-Hole Golay | |
| 1999 February 5 | 2.269 | 0.155 | 100 | UMa | 21-Hole Golay |
| 3.083 | 0.101 | 100 | UMa | 21-Hole Golay | |
| 2000 January 26 | 2.269 | 0.155 | 100 | Lyn | 21-Hole Golay |
| 3.083 | 0.101 | 100 | Lyn | 21-Hole Golay |
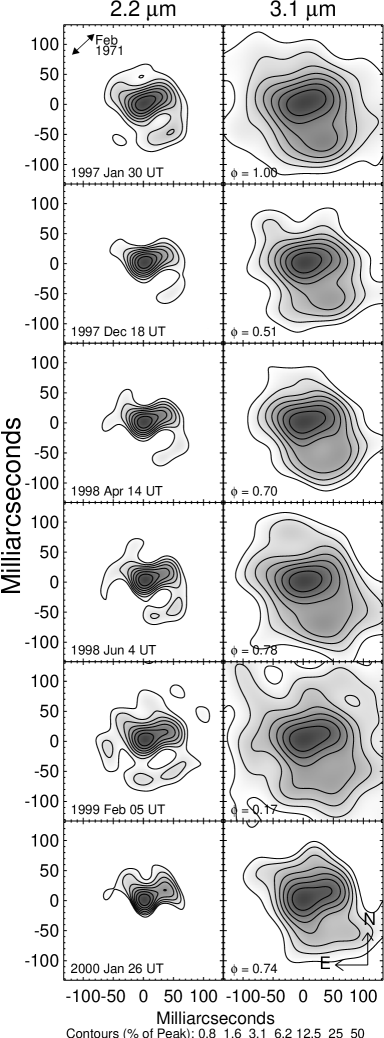
Figure 1 shows MEM reconstructed images of CIT 6 at 2.2µm and 3.1µm from all epochs. In cases where multiple observations exist at a given epoch, images were reconstructed from the separate datasets and then averaged together, weighted by the dynamic range of each image. In addition, the last known direction of the polarized component of the electric field in the K band has been included in the first panel for easy reference (Dyck et al. 1971). At both colors the dominant component, appearing at the map center, appears as a bright feature, elongated to the West-Northwest at a position angle of about . A second component, visible but faint in the 2.2 m images, and more prominent at 3.1 m, appears separated by 60 milliarcseconds (mas) at a position angle (PA) of 215°from the map center. These components will be referred to as the northern and southern components respectively. These data will be discussed further in the next section.
While CIT 6 was observed near 1.6µm, low signal-to-noise ratio prevented accurate image reconstructions. However, from the visibility data, it is clear that the dominant component is compact and elongated along PA 286°, similar to that seen at 2.2 µm and 3.1µm. Fitting a two-dimensional Gaussian to the visibility data yielded a major axis of 24 mas and minor axis of 16 mas. This simple model does not adequately fit the data ( per degree of freedom 5), and can only be viewed as a crude description of the actual brightness distribution.
2.2 Hubble Space Telescope images
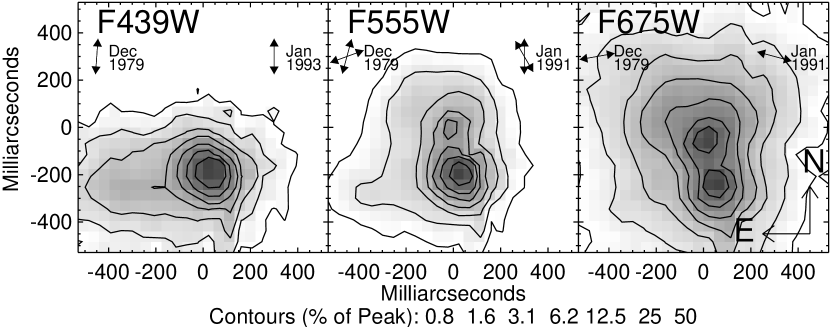
CIT 6 has also recently been imaged with the Hubble Space Telescope (HST) using both WFPC2 and NICMOS instruments. The WFPC2 observations were carried out on 1996 April 2, and the reduced images discussed here were provided by S. Trammell in advance of publication (Trammell et al. 2000). The plate scale of the original images was 46 mas per pixel. Figure 2 shows the logarithmic intensity of CIT 6 using filters F439W (=0.429µm, =0.046µm), F555W (=0.525µm, =0.122µm), and F675W (=0.674µm, =0.089µm). See the WFPC2 Instrument Handbook for more information on the filter bandpasses ( is roughly the FWHM). The polarization of the electric field in each of these bandpasses has been included in the figure, both Cohen & Schmidt (1982) and Trammell et al. (1994) results. Because of strong wavelength-dependence of the polarization direction within the large bandpass of the F555W filter, two polarization vectors for each epoch have been plotted to represent the range of observed angles.
The reddest image (F675W) consists of two components, or lobes, of similar brightness, separated by 190 mas along PA 190°. Moving towards shorter wavelengths, the F555W image still shows evidence for two lobes, but the northern component is considerably fainter with respect to the southern lobe. Lastly, the F439 image shows only the southern component, exhibiting a peculiar comet-like asymmetry at a position angle roughly orthogonal to the two lobes seen in red. Rayleigh scattering along this PA would explain the different angle of polarization for the blue light, compared to the red emission (e.g., Cohen & Schmidt 1982). Detailed analyses of these images can be found in Trammell et al. (2000).
CIT 6 was observed multiple times by NICMOS before the cryogen expired, and the data from 1998 February 23 and 1998 May 5 were used here. The calibrated data were retrieved from the HST Data Archive, including the observation log files. The images themselves will not be discussed in this paper, but rather the data will be used for extracting relative astrometry. This has allowed the Keck infrared images to be registered with respect to the WFPC2 images as is discussed fully in the next section.
2.3 Image Registration
Even though the Keck imagery contains no positional information and HST absolute astrometry is only good to 1″, it has been possible to link the infrared and visible reference frames to about 35 milliarcseconds. This is because CIT 6 has a companion star located only 10.4″ away (Bastian et al. 1988, hereafter referred to as the reference star), allowing precise relative astrometry. In this section we describe the methodology for extracting precise relative astrometry from both WFPC2 and NICMOS images.
2.3.1 WFPC2
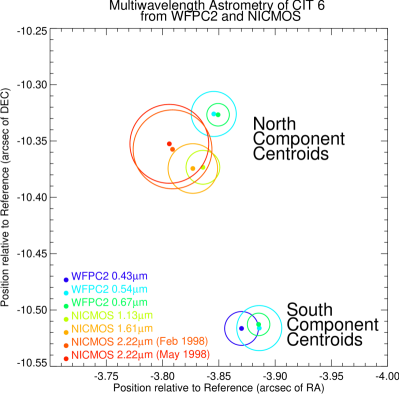
Deriving the position of CIT 6 relative to the reference star is straightforward because both appear on the PC chip in all of the WFPC2 images, which has a nominal plate scale of 45.5 mas/pixel. However, for the images taken with filters F439W and F555W, the reference star is slightly saturated, reducing the precision of the centroiding process. When not saturated, the centroid was defined by fitting a pixelized, two-dimension Gaussian profile to a 3x3 pixel box centered on the peak pixel. When saturated, the centroid was defined by fitting a Gaussian to the non-saturated pixels contained in a 7x7 pixel box. Tests were performed on unsaturated point spread functions and differences in the estimated centroids resulting from these two methods were always less than 6 mas. The IRAF-STSDAS task metric was translated into IDL and used to correct for the geometric field distortion (Gilmozzi et al. 1995), however corrections were always 0.3 pixels (13.7 mas). For F439W only the south component was visible, but both components of the CIT 6 nebula were measured relative to the reference source for F555W and F675W images. Although the HST Data Handbook claims that this process should be accurate to 5 mas for relative astrometry on the same chip, we have assigned more pessimistic error estimates because the centroid was not as well defined for the distorted isophotes of the extended emission, and because of saturation in the core of the reference star, most pronounced in F555W. Relative astrometry with estimates of uncertainty are included in Table 2 and the results are plotted in Figure 3.
2.3.2 NICMOS
NICMOS observations of CIT 6 have been carried out (by other workers, P.I. Gary Schmidt), and reside on the HST Data Archive. Although the spatial resolution of HST is four times worse than the Keck-I Telescope, these data are useful in the context of this paper for linking the position of the infrared peak to the visible WFPC2 images. Geometric field distortion was corrected according to Cox et al. (1997), while the appropriate platescale was determined from the online calibration file (http://www.stsci.edu/instruments/nicmos/NICMOS_status/platescale.dat). When the images were not saturated, the centroid was determined as above, using a pixelized Gaussian to fit to a 3x3 pixel square surrounding the peak pixel. However, two practical problems complicated the analysis.
Firstly, the field-of-view of the NIC1 chip (used for J and H band observations) is only 11″11″; not large enough to image both CIT 6 and the reference star without placing CIT 6 on the very edge of the chip. However, high precision relative astrometry can be maintained by executing a “small angle maneuver.” When the telescope pointing is changed using this procedure, the angular offset between images should be known to 10 mas, since the same two guide stars are being used (G. Schneider, private communication). By using the RA_AVG, DEC_AVG, and ROLL_AVG keywords in the JIF observing log file, the relative offsets between nearby pointings can be determined. We applied this procedure to each exposure of an observation to measure the relative separation between CIT 6 and the reference star in filters F110W and F160W for the observations of 1998 May 5. This method was tested using F220M images taken before and after a small angle maneuver, both of which contain the reference source. Two epochs of such data exist (see below) and the residual astrometric error was found to be only 12 mas for these test cases.
A second complication was that the F160W and F220M images of CIT 6 were heavily saturated. In these cases, the location of the CIT 6 centroid was estimated by measuring the intersection point of the diffraction spikes. We tested the accuracy of this method by applying it to the unsaturated F110W image and found an offset of only 13 mas with respect to the centroid determined by a Gaussian fit. However, since the diffraction pattern is wavelength-dependent, this does not assure such accuracy for longer wavelengths. We have assigned a conservative positional uncertainty of 0.5 pixels (22 mas for NIC1, 35 mas for NIC2) to measurements made using this method.
The NIC2 chip has a larger field of view (19.2″19.2″) which allowed both reference star and CIT 6 to appear on the same chip for the F220M data. Hence, the relative astrometry in this waveband does not suffer from possible offset errors associated with the small angle maneuver, but only those due to saturation of CIT 6 and uncertainty in the platescale and field distortion. As another cross-check to the accuracy, we applied this procedure to an additional epoch of F220M data from 1998 February 11 (which had a significantly different roll angle), and the two epochs agreed well within assigned uncertainty, indicating that our 35 mas estimate for error in the diffraction-spike centroid method is indeed quite conservative. Complete results appear in tabulated and graphical forms in Table 2 and Figure 3. HST imagery is rarely used to perform relative astrometry at this level of precision, and it is possible that unknown calibration errors may corrupt these results. Since the registration of the infrared and visible images is critical for interpreting the emission morphology, we are hopeful that independent confirmation of these results can be obtained.
2.3.3 Proper motion of CIT 6
Because the WFPC2 and NICMOS images were taken two years apart, it is important to consider the possibility that the relative astrometry is corrupted due to motion of CIT 6 with respect to the reference star. Bastian et al. (1988) documented the binary separation of these sources as 10.4″0.4″(PA 18°1°) at epoch 1955.3 using Palomar Sky Survey (red) plates. The red WFPC2 data from 1996.3 shows a separation of 11.14″0.02″(PA -20.3°0.1°). According to these results, the proper motion of CIT 6 with respect to the reference star is 0.021″0.014″yr-1. This implies a 0.040″0.027″shift between the WFPC2 and NICMOS observations. This is at the same level as the error on the K band centroid measurement (0.035″). Importantly, if one were to apply this correction it would cause the infrared centroids in Figure 3 to shift away from the visible centroid towards the North-East.
| Wavelength | Instrument | Filter | Position Relative to Reference Star | Comments | |||||
|---|---|---|---|---|---|---|---|---|---|
| (m) | South Component | North Component | |||||||
| East (″) | North (″) | (″) | East (″) | North (″) | (″) | ||||
| 0.429 | WFPC2 | F439W | -3.870 | -10.516 | 0.015 | Slight saturation | |||
| 0.525 | WFPC2 | F555W | -3.886 | -10.516 | 0.020 | -3.845 | -10.326 | 0.020 | Saturation |
| 0.674 | WFPC2 | F675W | -3.885 | -10.513 | 0.010 | -3.849 | -10.327 | 0.010 | No Problems |
| 1.129 | NICMOS | F110W | -3.836 | -10.373 | 0.015 | No ProblemsaaCIT 6 and reference star were not on the same frame and required the use of a Small Angle Maneuver | |||
| 1.607 | NICMOS | F160W | -3.827 | -10.374 | 0.022 | SaturationaaCIT 6 and reference star were not on the same frame and required the use of a Small Angle Maneuver bbThe extrapolated intersection of the diffraction spikes was used to estimate location of CIT 6 centroid due to excessive saturation. | |||
| 2.218 | NICMOS | F222M | -3.806 | -10.353 | 0.035 | February 1998; SaturationbbThe extrapolated intersection of the diffraction spikes was used to estimate location of CIT 6 centroid due to excessive saturation. | |||
| 2.218 | NICMOS | F222M | -3.809 | -10.357 | 0.035 | May 1998; SaturationbbThe extrapolated intersection of the diffraction spikes was used to estimate location of CIT 6 centroid due to excessive saturation. | |||
3 Discussion
Because the northern component of the Keck 2.2µm images (see Figure 1) dominates the flux, the centroid of the NICMOS images should lie close to this location. Based on the HST relative astrometry, it appears that the northern component in the IR images can be associated with the northern component in the red WFPC2 images, although they do not appear to be exactly co-spatial. Interestingly, this places the faint, southern IR component approximately halfway between the two visible components. Note that the small proper motion discussed in §2.3.3 would cause the IR centroids to appear further to the North-East, away from the average position of the visible components, strengthening the above interpretation. One interpretation of the two visible components is that they arise from a bipolar reflection nebula with low density poles allowing scattered light to escape the dust shell. This is supported by the linear polarization of the red emission, with a PA of 75°(Trammell et al. 1994). The dominance of the northern component in the IR indicates that the northern pole is inclined towards us. In this scenario, the faint, southern IR component could be thermal emission from the central “disk” of material which is responsible for channeling the stellar flux towards the bipolar lobes.
Unfortunately, this appealing model does not account for the blue WFPC2 observations. In fact, the southern component is brighter in all the WFPC2 images. However, the source of blue light is likely to be different from the source of red emission (Alksnis et al. 1988). This contention is most securely based on multi-wavelength photometry which shows that the red and infrared flux vary at the 626 day period of the carbon star, while the blue flux level is roughly constant (Alksnis 1995). In addition, the blue light has a polarization angle (0°) roughly orthogonal to that seen in the red and infrared (Cohen & Schmidt 1982; Trammell et al. 1994).
One scenario able to reconcile these disparate observations is to propose that the blue lobe is not being illuminated the carbon star, but by a blue companion which lies in the vicinity of the southern lobe. Although it may appear somewhat ad-hoc, this model is able to qualitatively explain the odd cometary shape of the bluest WFPC2 image and the different blue-red polarization angles. The apparent location of the southern (blue) HST component would be largely defined by the mass-loss profile of the carbon star, while the angle of linear polarization in the blue would be set by the separation vector between the companion and the scattering lobe. Note that the polarization direction of the Hα emission observed by Trammell et al. (1994) matches the blue polarization, not the red. This is consistent with the idea that the blue companion is producing the line emission which is scattering into our line of sight along the same trajectories as the blue continuum.
3.1 A Dusty Disk?
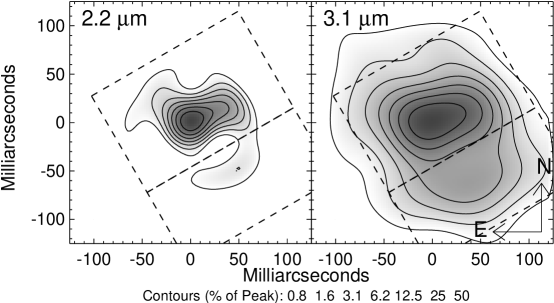
Generally, scattered photospheric light should have a higher color temperature than thermal emission from dust. Hence, the above model can be crudely tested by calculating the color temperature of the northern and southern IR components. Towards this goal, all the epochs of Keck data have been averaged together, where image registration was estimated by maximizing the cross-correlation; these coadded images appear in Figure 4. It is clear that the southern component has relatively more flux (compared to the northern component) at 3.1µm than at 2.2µm, consistent with the southern component being redder. These images have been projected onto an axis at PA 30°, and the summed profiles appear in Figure 5. Note that the larger FWHM of the 3.1µm peak is due to the lower spatial resolution, and the profiles have been normalized by the total flux under each curve rather than the peak intensity.
To minimize bias due to the wavelength-dependent spatial resolution, two photometric apertures have been defined to include most of the flux in the northern and southern IR components. These apertures appear in Figure 4 and their projected boundaries along PA 30°are marked on Figure 5. At 2.2µm (3.1µm), the southern aperture contains 8% (18%) of the total flux in the two apertures. Taranova & Shenavrin (1999) report K and L band magnitudes for CIT 6 during the period of these Keck observations, with a mean K mag () of 1.83, and L mag () of -1.10. We linearly interpolate (in wavelength–magnitude space) to arrive at an approximate 3.1µm magnitude of 0.22. Using these average fluxes we can now estimate the average color temperature of the northern and southern components separately.
The color temperatures based on the 2.2µm and 3.1µm images are 870 K and 600 K for the northern and southern components respectively. No color corrections were applied when converting magnitudes to physical flux units, but any corrections will modify the component temperature estimates in the same way. As a comparison, the mean color temperature based on J and K-band magnitudes is 1000 K, according to Taranova & Shenavrin (1999). Although the computation above is clearly an approximation, the southern IR component has been found to be demonstrably redder than the northern one.
However, the lower color temperature of the southern component does not guarantee that this is thermal emission from dust. The relative contributions of reddened scattered light and thermal emission are difficult to untangle in optically thick envelopes (e.g., Weigelt et al. 1998; Monnier et al. 1999; Tuthill et al. 2000a). The fact that the southern IR component is located roughly between the visible lobes and has the lowest color temperature, is certainly consistent with it being a dusty “disk” of material surrounding the carbon star.

3.2 Time-variability
The dominant (northern) IR component clearly changes shape on the time scale of years, as can be seen from examination of Figure 1. Most notably, the northern IR component has evolved from a nearly symmetric elongation in 1997 to a very asymmetric structure extending West-Northwest. These changes are observed at both wavelengths and show a consistent evolution in time. Under the above hypothesis that this component represents scattered light or thermal emission for warmed dust, this time evolution can be understood if dust formation closer to the star is changing the illumination pattern. These observations represent the first direct detection of evolution of the inner dust shell of CIT 6. The inner dust formation zone around another nearby carbon star, IRC+10216, has also been observed to be quite chaotic and dynamic, evolving on similar time scales (Tuthill et al. 2000b). However in IRC +10216, discrete dust blobs are observed to move away from central souce, while only slight shifts in the emission pattern are seen for CIT 6. This difference can be understood if the central star of CIT 6 is more obscured than for IRC +10216, and also by considering that CIT 6 is thought to be be 4 times more distant than IRC +10216.
If illuminated by scattered light, this changing morphology of the northern IR component could explain the observed changes in polarization angle of the red and infrared light. Since 1970, the polarization angle has varied by 20°, perhaps related to the opening angle of the northern lobe, as can be seen by the polarization vectors placed on Figure 2. As the center of scattered light changes in this lobe, the corresponding polarization angle would as well. Coordinated spectropolarimetry and high spatial resolution imaging could test this hypothesis further.
3.3 Alternate models
Unfortunately, these new data do not preclude other interpretations. Alternate possible dust shell geometries include the northern component being the star itself (or a binary), with the southern component arising from scattered radiation. As for the case of carbon star IRC +10216, it is not obvious if the star itself is visible in existing near-infrared images, or if it remains obscured (see discussions in Haniff & Buscher 1998; Weigelt et al. 1998; Tuthill et al. 2000a). Yet another possibility is that the elongated and time-variable morphology of the northern IR component could be due to a close binary.
A direct measure of the polarization percentage of both IR components would more definitively determine which (if either) are due to scattered radiation, although such observations are technically difficult. Alternate theories for the blue excess, either due to a mistake in the spectral type identification (Trammell et al. 1994) or circumstellar shocks related to mass-loss (Cohen & Schmidt 1982), do not seem able to explain either the odd cometary appearance or the polarization properties without positing an additional bipolar nebula at right-angles to the first. Given the IR morphology, the wide binary hypothesis seems the best hypothesis of those presently considered for explaining the peculiar properties of the blue light, but stronger evidence is needed to confirm it.
4 Conclusions
The dust shell of carbon star CIT 6 has been examined with unprecedented spatial resolution (50 mas) using aperture masking at the Keck-I telescope. Serendipitously, a nearby (11″) companion allowed high precision relative astrometry from recent HST WFPC2 and NICMOS images. Multi-wavelength analysis suggests that CIT 6 is surrounded by a bipolar dust envelope with a complex morphology, consisting of at least two components. The dominant compact feature in the near-infrared is tentatively identified as the northern scattering lobe of the reflection nebula, although the possibility that it is the carbon star itself can not be ruled out. In addition, a fainter IR component with very red colors has been detected between the two visible light components, perhaps due to thermal emission from the central “disk” of the bipolar dust envelope. Excess blue emission in the southern optical lobe is ascribed to an obscured hot companion, responsible for the strong wavelength-dependence of the (visible) polarization properties and “cometary” scattering feature in the blue WFPC2 image. Under this model, changes in the red and infrared polarization angle should be linked to observed variations in the near-IR emission morphology.
Other recent high resolution observations of evolved stars have also revealed strong deviations form spherically symmetry. Red supergiant VY CMa (Monnier et al. 1999) and carbon star IRC +10216 (Haniff & Buscher 1998; Weigelt et al. 1998; Tuthill et al. 2000a) also show evidence for bipolar nebulae on large scales (as seen in scattered light) and complicated dust shells in the innermost regions (from IR observations). The dominant physical mechanism for breaking spherical symmetry and producing the bipolar mass-loss profile remains unidentified.
References
- Alksnis (1995) Alksnis, A. 1995, Baltic Astronomy, 4, 79
- Alksnis et al. (1988) Alksnis, A. A., Zacs, L., Kopylov, I. M., & Somov, N. N. 1988, Soviet Astronomy Letters, 14, 352+
- Alksnis & Khozov (1975) Alksnis, A. K. & Khozov, G. V. 1975, Soviet Astronomy Letters, 1, 144
- Baldwin et al. (1986) Baldwin, J. E., Haniff, C. A., Mackay, C. D., & Warner, P. J. 1986, Nature, 320, 595
- Bastian et al. (1988) Bastian, U., Eisloeffel, J., & Wiese, K. 1988, A&AS, 74, 1
- Cohen (1980) Cohen, M. 1980, ApJ, 238, L81
- Cohen & Hitchon (1996) Cohen, M. & Hitchon, K. 1996, AJ, 111, 962+
- Cohen & Schmidt (1982) Cohen, M. & Schmidt, G. D. 1982, ApJ, 259, 693
- Cox et al. (1997) Cox, C., Ritchie, C., Bergeron, E., Mackenty, J., & Noll, K. 1997, NICMOS Distortion Correction, Tech. Rep. NICMOS ISR OSG-CAL-97-07, Space Telescope Science Institute, Baltimore
- Dyck et al. (1971) Dyck, H. M., Forbes, F. F., & Shawl, S. J. 1971, AJ, 76, 901+
- Dyck et al. (1984) Dyck, H. M., Zuckerman, B., Leinert, C., & Beckwith, S. 1984, ApJ, 287, 801
- Gaustad et al. (1969) Gaustad, J. E., Gillett, F. C., Knacke, R. F., & Stein, W. A. 1969, ApJ, 158, 613+
- Gilmozzi et al. (1995) Gilmozzi, R., Ewald, S., & Kinney, E. 1995, Geometric Distortion Correction for the WFPC Cameras, Tech. Rep. WFPC2 ISR 95-02, Space Telescope Science Institute, Baltimore
- Gull & Skilling (1983) Gull, S. F. & Skilling, J. 1983, in Indirect Imaging. Measurement and Processing for Indirect Imaging. Proceedings of an International Symposium held in Sydney, Australia, August 30-September 2, 1983. Editor, J.A. Roberts; Publisher, Cambridge University Press, Cambridge, England, New York, NY, 1984. LC # QB51.3.E43 I53 1984. ISBN # 0-521-26282-8. P.267, 1983, 267+
- Haniff & Buscher (1998) Haniff, C. A. & Buscher, D. F. 1998, A&A, 334, L5
- Högbom (1974) Högbom, J. A. 1974, A&AS, 15, 417
- Kruszewski (1968) Kruszewski, A. 1968, PASP, 80, 560+
- Kruszewski (1971) —. 1971, AJ, 76, 576+
- Kruszewski (1973) —. 1973, Informational Bulletin on Variable Stars, 781, 1+
- Lipman (1998) Lipman, E. A. 1998, PhD thesis, University of California at Berkeley
- Matthews et al. (1996) Matthews, K., Ghez, A. M., Weinberger, A. J., & Neugebauer, G. 1996, PASP, 108, 615+
- Matthews & Soifer (1994) Matthews, K. & Soifer, B. T. 1994, Infrared Astronomy with Arrays: the Next Generation, I. (Dordrecht: Kluwer Academic Publishers), 239
- Monnier (1999) Monnier, J. D. 1999, PhD thesis, University of California at Berkeley
- Monnier et al. (1999) Monnier, J. D., Tuthill, P. G., Lopez, B., Cruzalebes, P., Danchi, W. C., & Haniff, C. A. 1999, ApJ, 512, 351
- Narayan & Nityananda (1986) Narayan, R. & Nityananda, R. 1986, ARA&A, 24, 127
- Sivia (1987) Sivia, D. 1987, PhD thesis, Cambridge University
- Strecker & Ney (1974) Strecker, D. W. & Ney, E. P. 1974, AJ, 79, 1410
- Taranova & Shenavrin (1999) Taranova, O. G. & Shenavrin, V. I. 1999, Astronomy Letters, 25, 750
- Trammell et al. (2000) Trammell, S., Wood, K., & Goodrich, R. W. 2000, ApJ, in preparation
- Trammell et al. (1994) Trammell, S. R., Dinerstein, H. L., & Goodrich, R. W. 1994, AJ, 108, 984
- Tuthill et al. (2000a) Tuthill, P. G., Monnier, J. D., Danchi, W. C., & Lopez, B. 2000a, ApJ, in press
- Tuthill et al. (2000b) Tuthill, P. G., Monnier, J. D., Danchi, W. C., Wishnow, E., & Haniff, C. A. 2000b, PASP, 112, 555
- Ulrich et al. (1966) Ulrich, B. T., Neugebauer, G., McCammon, D., Leighton, R. B., Hughes, E. E., & Becklin, E. 1966, ApJ, 146, 288+
- Weigelt et al. (1998) Weigelt, G., Balega, Y., Bloecker, T., Fleischer, A. J., Osterbart, R., & Winters, J. M. 1998, A&A, 333, L51
- Wisniewski et al. (1967) Wisniewski, W. Z., Wing, R. F., Spinard, H., & Johnson, H. L. 1967, ApJ, 148, L29