Multiwaveband studies of the hard ROSAT SMC transient 1WGA J0053.8–7226: a new X-ray pulsar
Received : Version November 1997
In original form ..)
Abstract
We report on two optical candidates for the counterpart to an X-ray source in the SMC, 1WGA J0053.8–7226, identified as a serendipitous X-ray source from the ROSAT PSPC archive, and also observed by the Einstein IPC. Its X-ray properties, namely the hard X-ray spectrum, flux variability and column density indicate a hard, transient source, with a luminosity of 3.8 . XTE and ASCA observations have confirmed the source to be an X-ray pulsar, with a 46 s spin period. Our optical observations reveal two possible candidates within the error circle. Both exhibit strong H and weaker H emission. The optical colours indicate that both objects are Be-type stars. The Be nature of the stars implies that the counterpart is most likely a Be/X-ray binary system. Subsequent IR photometry (JHK) of one of the objects shows the source varies by at least 0.5 mag, while the (J-K) measured nearly simultaneously with the UBVRI and spectroscopic observations indicate an IR-excess of 0.3 magnitudes.
keywords:
stars: emission-line, Be - star: binaries - infrared: stars - X-rays: stars - stars: pulsars1 Introduction
Accretion onto a compact object invariably results in X-ray emission, with the luminosity determined by such important parameters as the size and mass of the accreting object, and the mass accretion rate. Binary stars represent the best laboratories for the study of such accretion processes, where the accreting star can be a white dwarf, neutron star or a black hole. Whereas known white dwarfs in cataclysmic variables are generally low luminosity X-ray sources, and relatively nearby (most 1 kpc), the neutron star sources are often extremely luminous, and detectable at extragalactic distances.
Most (80%) of the higher mass systems (High Mass X-ray Binaries, or HMXBs), which consist of early spectral type (O or B) stars losing mass to their neutron star companions, are Be/X-ray or Supergiant binaries. The orbits of these binary systems are generally wide and eccentric, with periods in the range 0.7/1.4d for RX J0050.7-7316 (Coe & Orosz, 2000) to 262d for SAX J2239.3+6116 (in’t Zand et al, 2000). Usually the only optical signature of these stars is Balmer emission, and in that respect alone it is often difficult to ascertain the X-ray nature of these systems. With Be stars being relatively common in the Galactic plane, it has only been possible to confirm Be counterparts to X-ray sources using imaging X-ray instruments, as provided by such satellites as Einstein (HEAO-2) and ROSAT.
Much progress in understanding the physics of these systems has resulted from multiwaveband campaigns, spanning the IR–optical–UV–X-ray–-ray domains. Observations of the Be star in the optical and IR sheds light on the physical conditions under which the neutron star accretes. In addition, with contemporaneous X-ray observations, which provide direct information on the accretion process, it is possible to investigate the correlation between the mass loss rate from the Be star and the accretion rate. Thus it is possible, through long-term multi-wavelength programs, to build a more complete picture of the whole accretion process, and to study it as a function of time.
In this paper we report on two possible counterparts to a hard X-ray transient source in the SMC, 1WGA J0053.8–7226, which is most likely a new member of the Be/X-ray binary subclass of HMXBs. The ROSAT position coincides with a previously know hard spectrum source from HEAO-2 (Einstein Observatory) IPC pointings. Our optical/IR observations of one of the candidates reveal IR variability of 0.5 mag and persistent Balmer emission, with a redshift consistent with SMC membership. The UBVRI colours and optical spectra of both candidates indicate an early B-spectral type.
In 1997 November, following our observations, an X-ray source identified as XTE J0053-724 went into outburst and revealed a 46 s X-ray pulsation (Corbet et al. 1998). Though originally, and incorrectly, identified as SMC X-3, subsequent ASCA observations in 1997 December revealed that the pulsating source was actually 8’ away from SMC X-3, establishing it to be a new X-ray pulsar. Its new ASCA-determined position is coincident with the previously catalogued X-ray source 1WGA J0053.8–7226 and the data we present here confirms this association and provides convincing evidence that it is a Be/neutron star binary.
2 ROSAT observations
The WGA catalogue (White, Giommi, Angelini 1994) was generated using all pointed ROSAT PSPC data available in the archive up to 1994 November and its first revision includes data up to 1995 March. The catalogue was created using the rev1 ROSAT data files, where data taken several months apart belonging to the same sequence were combined in one file. A variability test for each detected source was included as part of the processing. The method used compares the time arrival distribution of the photons collected in each pixel with the corresponding distribution of the entire image using a Kolmogorov-Smirnov (KS) test (Giommi, Angelini, White 1995). The transient nature of 1WGA J0053.8–7226 was discovered using this method, in the sequence 600195, which included data from 1991 October and 1992 April. The source was detected in 1992 April at coordinates R.A.=00 and Dec= (J2000). Positional errors from the WGA positions vary from , depending how far the source is off-axis.
After discovering the transient behaviour, the ROSAT public archive was searched for additional PSPC and HRI public data containing the source position. Table 1 gives the observation log 111 We used the rev 2 data processed with SASS7, which included among other changes, a better attitude reconstruction, and the splitting of the sequence into separate files when the guide stars change (see also: Pisarski 1995). together with the nominal exposure, the off-axis position of the source in the HRI or PSPC Field of View measured from the nominal pointing, and the count rate.
A count rate (or upper limit) is given in Table 1 for most of the observations with the following caveats. For a large off-axis angle, the point spread function (psf) is very large: at 50 arcmins the 50% power radius is arcmins (see ROSAT Handbook). That far off-axis, the source position is typically at the detector boundary and the optimized radius falls outside the detector image, resulting in an underestimate of the countrate. 1WGA J0053.8–7226 is at 5 arcmin from another transient RX J0054.9-7210 (Kahabka and Pietsch 1996), which is also an Einstein IPC source: No. 9 in Bruhweiler et al (1987) and No. 35 in Wang and Wu (1992). At such large off-axis angles, if this second source was active, the optimized radius to evaluate the count rate for 1WGA J0053.8–7226 is contaminated by emission from RXJ0054.9-7210. For these observations no count rate or upper limits are given in Table 1, although a column indicates whether 1WGA J0053.8–7226 was detected (‘on’ or ‘off’).
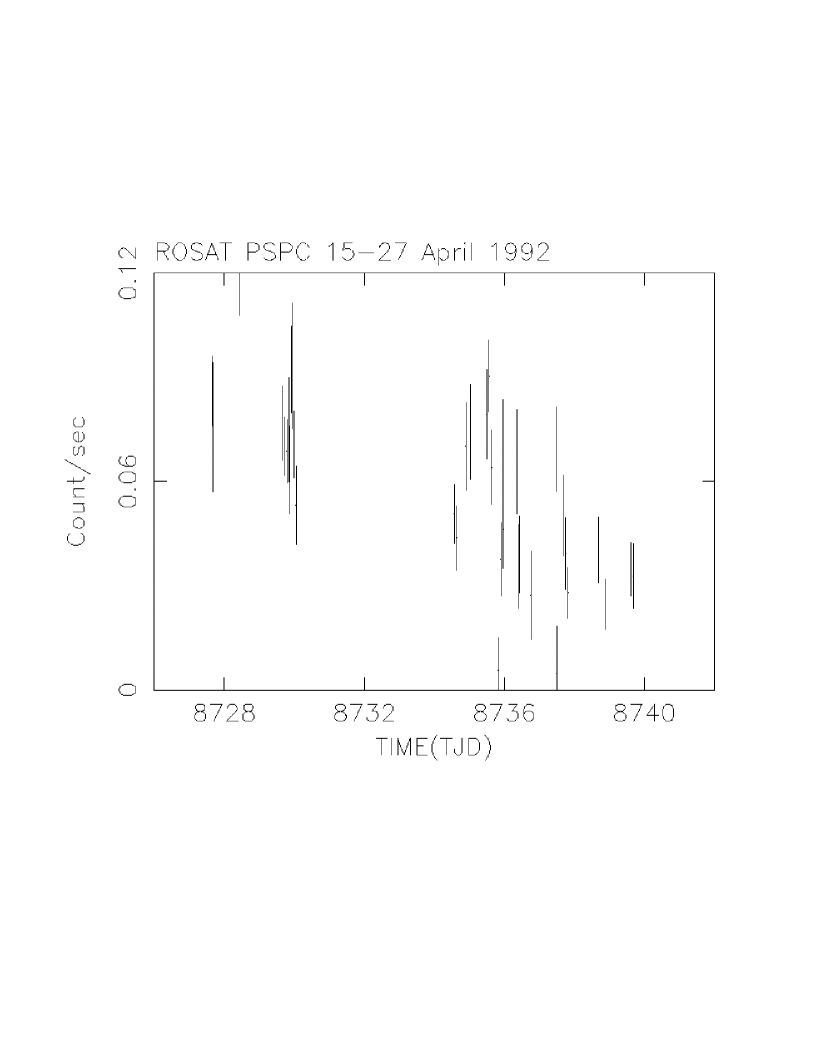
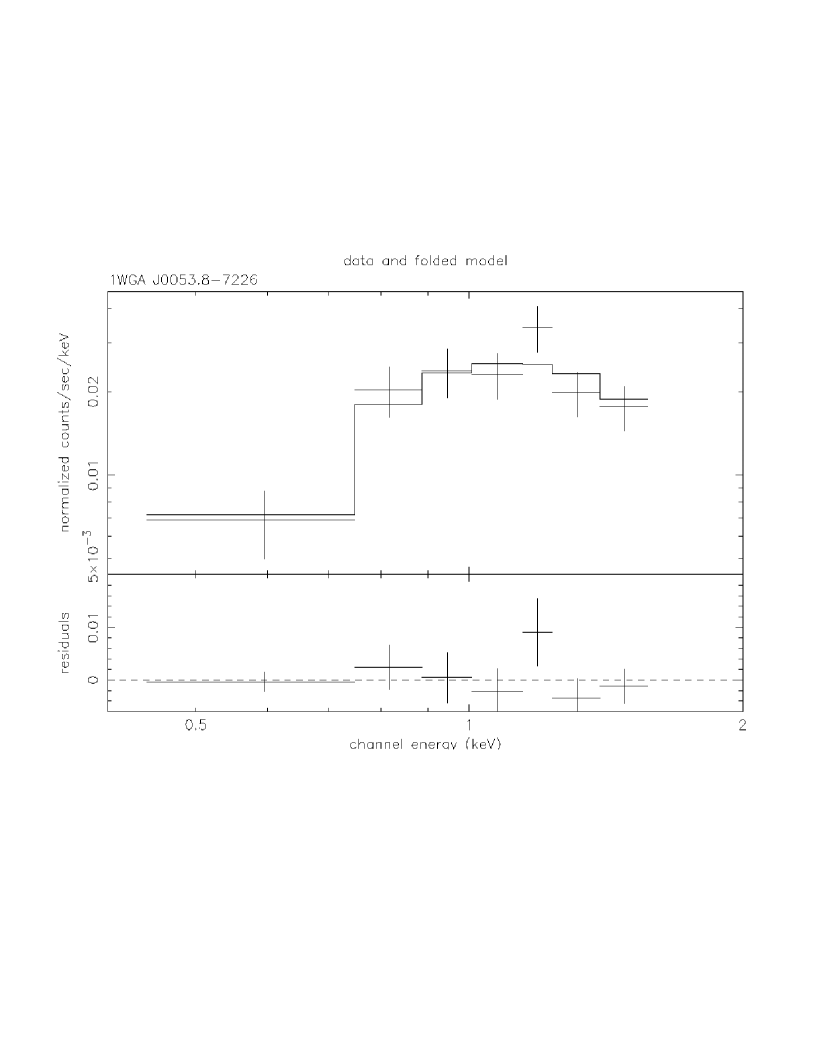
The source is highly variable and it was detected in 1992 April (PSPC), 1993 October (PSPC), and 1996 June (HRI). Although the coverage is not complete, the outbursts for the 1992 April and 1993 October observations last more than a month. Figure 1 shows the background subtracted lightcurve for the 1992 April outburst combining data from the sequence 600195 and 600196, where only the declining phase is seen. The PSPC spectrum obtained for the 1992 April observation (only when the source is at arcmin off-axis, because of the response uncertainties at large off-axis angles) is shown in Figure 2. We fit the spectrum using a power law and absorption. The best fit parameter values are a spectral index of 1.6 with an equivalent hydrogen absorption of cm-2 (shown in Figure 2), but these two parameters can not be simultaneously constrained.
A model with a fixed absorption at the galactic value in the SMC direction ( cm-2) and a power law, overestimates the low energy part of the spectrum. If 1WGA J0053.8-7226 is a Be star, as argued later, it is reasonable to assume that the outburst spectrum should be similar to that of 1WGA J0051.8-7231, another Be transient in the SMC (Israel et al. 1997). Fixing the spectral index to 1.1, as for 1WGA J0051.8-7231, we obtained an NH= cm-2. This value seems consistent with the contour map in Kahabka & Pietsch (1996) where 1WGA J0053.8–7226 is close to source number 103 in their paper. This gives a 0.1-2.0 keV unabsorbed X-ray flux of erg cm which corresponds to a luminosity of erg s-1 for a distance of 65 kpc.
The 1996 June HRI observation allowed us to derive a better position because of the higher HRI angular resolution compared to the PSPC, and because the source location is at a smaller off-axis angle ( arcmins) compare to the PSPC observations. At equinox 2000 this is R.A.=00, Dec= with a conservative error of (see also HRI report, Harris (1996)).
The position obtained from the PSPC No. 3 observation using the rev2 data is R.A.= 00 Dec= (). The 1WGA J0053.9-7226 position is consistent with the Einstein IPC source No. 8 in Table 2 of Bruhweiler et al (1987) and source No. 34 in Wang and Wu (1992). The coordinates of the Einstein source from Wang and Wu (1992) are RA= Dec= in equinox 2000, with an error .
| No. | Instrument | Year | Day/Month | Exp.1 | Seq. | Off-axis | On/Off | Count rate 2 |
|---|---|---|---|---|---|---|---|---|
| (s) | (arcmin) | () | ||||||
| 1 | PSPC | 1991 | 8/Oct 3/Nov | 16644 | 600195A00 | 21.9 | off | |
| 2 | PSPC | 9/Oct 2/Nov | 1303 | 600196A00 | 49.3 | offb | – | |
| 3 | PSPC | 1992 | 15-25/Apr | 22223 | 600196A01 | 49.3 | on | |
| 4 | PSPC | 17-27/Apr | 9443 | 600195A01 | 21.9 | on | ||
| 5 | HRI | 23-24/Oct | 1096 | 400237N00 | 10.3 | off | ||
| 6 | PSPC | 6/Dec | 3561 | 600455N00 | 50.5 | offa | – | |
| 7 | PSPC | 1993 | 29-30/Mar | 5214 | 400300N00 | 55.0 | offa,c | – |
| 8 | PSPC | 10-25/Apr | 14207 | 600452N00 | 54.7 | offa,c | – | |
| 9 | PSPC | 16-22/Apr | 1721 | 600455A01 | 50.5 | offa,c | – | |
| 10 | HRI | 17/Apr/93 | 1167 | 400237A01 | 10.3 | off | ||
| 11 | PSPC | 10/May/93 | 17593 | 600453N00 | 19.2 | off | ||
| 12 | PSPC | 712-13/May | 4902 | 500142N00 | 52.6 | off | ||
| 13 | PSPC | 1-14/Oct | 16663 | 600452A01 | 54.7 | on | ||
| 14 | PSPC | 1-9/Oct | 7199 | 400300A01 | 55.0 | on | ||
| 15 | PSPC | 7-10/Oct | 4595 | 600455A02 | 50.5 | on | ||
| 16 | PSPC | 14-29/Oct | 20845 | 500250N00 | 53.5 | on | ||
| 17 | HRI | 1994 | 1/Apr | 1301 | 400237A02 | 10.3 | off | |
| 18 | PSPC | 4-5/May | 4129 | 600455A03 | 50.5 | off | ||
| 19 | PSPC | 5/May | 4111 | 400300A02 | 55.0 | off | ||
| 20 | HRI | 1996 | 26/Apr | 2006 | 600810N00 | 3.2 | off | |
| 21 | HRI | 10/June | 4720 | 600810N00 | 3.2 | on |
Table Notes:
a The nearby source (RX J0054.9-7210) is active
b The nearby source (RX J0054.9-7210) is active. The source state is
derived from the nearby observation at smaller off-axis angle.
c The source location is at the detector boundary, but no excess is seen
1 The exposures listed are the nominal values. Close to the PSPC support
structure the exposure is much reduced. The count rates are derived using an
exposure map.
2 Upper limits are given at 3 sigma
The source was noted by Bruhweiler et al. to have the hardest spectrum amongst the 35 listed, and assumed to be a stellar source. From an IPC count rate of 0.0088 , Bruhweiler et al. determined an X-ray luminosity of 1.8 and hardness ratio = (0.8 to 3.5 keV – 0.2 to 0.8 keV) / (0.8 to 3.5 keV + 0.2 to 0.8 keV) = 0.76, consistent with the hard spectrum we report here.
3 Optical identification
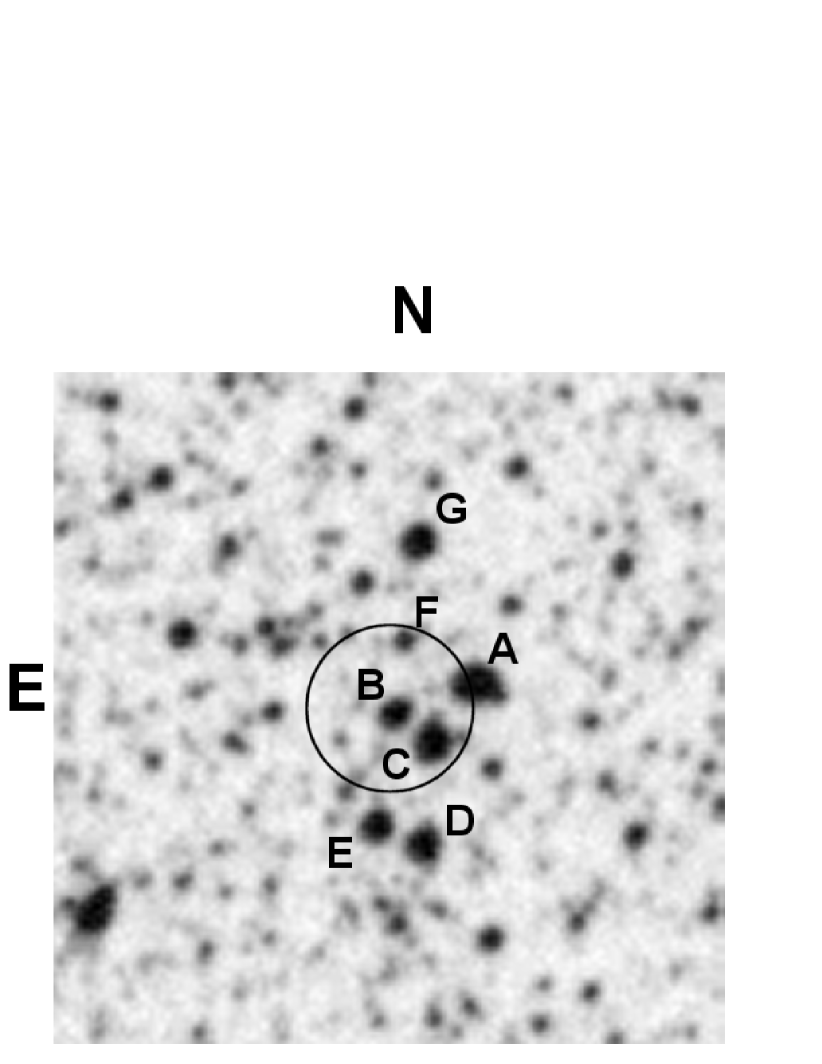
The field of 1WGA J0053.8–7226 is shown in Figure 3. There are 4 stars lying within the X-ray error circle labelled as Stars A, B, C and F. Star A is, in fact, a double and both components were subsequently observed on 1995 September 22/23, using the SAAO 1.9-m telescope with the Cassegrain spectrograph. Spectra in the interval 3300-7500Å, at a resolution of 7Å, were obtained using the Reticon Photon Counting System (RPCS). Because the two components of Star A were separated by only a few arcsec in the E-W direction, it was impossible to get separate spectra of the two. The combined spectrum was clearly very blue, and with a strong H emission line (E.W. = –13Å). Although the RPCS is only a 1D detector, it was possible to determine which of the two stars was responsible for the Balmer emission. This was done by driving the stellar image off to one extreme of the slit decker, thereby excluding most of the light of the companion. The exercise was then repeated for the other star. It was therefore possible to obtain two spectra, whose major light contribution was one or other of the two stars. From these observations we were able to show that the fainter, easternmost, star was the H emitter. This has been subsequently confirmed from both optical photometry and CCD spectroscopy, reported later in this paper.
| Star | U | B | V | R | I | (U–B) | (B–V) | (V–R) | (V–I) | (R-I) |
|---|---|---|---|---|---|---|---|---|---|---|
| Be star component of A | 14.004 | 14.876 | 14.927 | 15.000 | 14.995 | –0.87 | –0.05 | –0.07 | –0.07 | 0.01 |
| (0.011) | (0.016) | (0.023) | (0.024) | (0.024) | (0.03) | (0.04) | (0.05) | (0.05) | (0.05) | |
| F-star component of A | 14.553 | 14.444 | 14.075 | 13.730 | 13.412 | 0.109 | 0.369 | 0.346 | 0.664 | 0.318 |
| (0.016) | (0.007) | (0.006) | (0.005) | (0.005) | (0.023) | (0.013) | (0.011) | (0.011) | (0.010) | |
| Star B | 13.833 | 14.637 | 14.881 | 14.725 | 14.711 | -0.80 | -0.25 | -0.16 | 0.17 | 0.01 |
| (0.016) | (0.007) | (0.006) | (0.005) | (0.005) | (0.023) | (0.013) | (0.011) | (0.011) | (0.010) |
CCD photometry of the field of 1WGA J0053.8–7226 was made using the SAAO 1.0-m telescope on 1995 November 26/27. The observations were made using the Tek8 CCD camera, employing and H filters, at a plate scale of 0.35 arcsec . All observations were obtained in photometric conditions, and in good seeing (FWHM 1”), with exposure times of 600 s (U), 300 s (B), 200 s () and 1000 s (H).
All of the CCD frames were reduced in a similar manner, with bias removal, flat-fielding, and subsequent reductions using DoPHOT (Mateo and Schechter 1989). Observations of E-region standard stars (Menzies et al. 1989) were used to determine aperture magnitude zero points. Both the PSF fit and aperture magnitudes were determined for all stars in the frames, and transformed to the natural system. Colour-magnitude and colour-colour diagrams were made in order to search for stars of unusual colour. In the past the H filter has been used successfully in conjunction with the R-band filter, to search for H emission line objects. No stars on the frame appeared to show significant deviations suggestive of very strong H emission.
Our CCD observations resolve the two components of Star A and indicate that they are separated by 2.1 arcseconds in an E-W direction. We give the photometric results in Table 2 for the stars labelled A and B in Figure 3.
We find that Star B and one component of Star A are very blue, and lie with a group of several other blue stars off the normal locus for stars in the two-colour diagram, implying some reddening. An of 0.15–0.20 would move the stars back onto the normal locus for early B-stars in the two colour diagram, namely a –0.20 to –0.25. The fainter component of Star A has a colour of 0.37 and is consistent with an early F spectral type, while the and colours imply a somewhat later type (F8). Our CCD spectra (Section 5) are more consistent with the earlier spectral type, so we adopt F2 for the this star’s type.
4 Followup optical and IR photometry
Subsequent optical () photometry was performed on 1996 October 5/6. These CCD observations were also undertaken on the SAAO 1.0-m telescope, using the same (Tek8) camera, but employing the 3 “Shara” focal reducer (kindly provided by Dr M. Shara, STScI), giving an effective field size of 9 9 arcmin, with a scale of 1.05 arcsec (this was utilised for a parallel program of optical identifications necessitating a larger field coverage). No U-band observations were possible, due to the poor throughput of the focal reducer at this wavelength. Because of the plate scale, the close pair of objects labelled Star A in Figure 3 were not well resolved. In fact only for the B and V frames was it possible to derive PSF fits to both stellar images, although the results are far from reliable. The aperture magnitude of both stars (i.e. using an aperture large enough to include both) was V = 13.64, compared to a combined V = 13.667 for 1995 November photometry, indicating very similar combined flux, and therefore little optical variability. The individually fitted PSF magnitudes were rather different, however, no doubt a consequence of severe undersampling of the images, plus the fact that there are in fact 2 fainter stars within several arcseconds (Star C and F), i.e. four stars in total. Indeed our 1995 November observations resolved all 4 stars.
IR photometry of Star A was performed on 1995 November 14/15 and 1996 October 2/3 using the MkIII IR photometer on the SAAO 1.9-m telescope. A chopping secondary defines two effective apertures, one containing the source, the other background. After a short 10 sec integration, the telescope “nods” such that the source is within the aperture previously defined as background. Thus two “off-source” positions are used, in order to minimise any systematic errors. Observations are repeated, alternately nodding to the alternative background positions, until a sufficient S/N ratio is obtained. Most of the observations consisted of 5 observation modules of 40 s integrations, or a total of 200 s. For both sets of observations, aperture sizes of 6 and 9 arcsecond diameter were used, respectively, for the 1995 and 1996 observations.
The JHK magnitudes are therefore of the combined light of both objects representing Star A (in fact also including the two other fainter, by 2–3 mags at V, neighbouring stars), and they are given in Table 3 with their standard internal errors. We were careful to observe a nearby JHK standard close in time (40 min) to the 1WGA J0053.8–7226 observation. Therefore the true errors should not be too different to those quoted. Included are the deconvolved magnitudes for both components of Star A. These deconvolutions were made assuming that the IR colours, (V–K), (H–K) and (J–K), of the F-star could be determined on the basis of the observed (B–V), using the relationships between the SAAO IR JHK and Johnson-Cousin’s systems, determined by Caldwell et al. (1993). For the colours in question, these relationships are independent of luminosity class. From the observed V and predicted IR colours (V–K, H–K, J–K) for the F-type contaminating star, we derived the JHK magnitudes of both components of Star A.
| Star | Date | J | H | K |
|---|---|---|---|---|
| Combined: | Nov 95 | 13.18 | 12.93 | 12.84 |
| (s.e. 0.05) | (s.e. 0.05) | (s.e. 0.07) | ||
| Oct 96 | 12.69 | 12.47 | 12.45 | |
| (s.e. 0.10) | (s.e. 0.07) | (s.e. 0.05) | ||
| Deconvolved: | ||||
| Nearby F-star | 13.36 | 13.11 | 13.08 | |
| Be star | Nov 95 | 15.22 | 14.97 | 14.60 |
| Be star | Oct 96 | 13.53 | 13.35 | 13.34 |
For the 1996 observations, the derived J–K for the Be star component of Star A is 0.19, and assuming E(J–K) 0.52 E(B–V), leads to a value of = 0.11 (for E(B–V) = 0.15). This value can be compared to that expected for a late-O/early-B star (–0.2), indicating that 1WGA J0053.8–7226 exhibits an IR excess of 0.3 mags. Such an excess is a common feature of Be/X-ray binaries (e.g. Coe et al. 1994), and is probably related to the amount of mass present in the Be star’s circumstellar disc.
5 Optical spectra
Our discovery spectrum, taken with the RPCS, lead to the identification of the Balmer emission (in H and weakly in H) in the eastern component of the close pair labelled Star A in Figure 3. However, the RPCS was unable to obtain spectra of both components separately. This was subsequently achieved using the SITe2 CCD detector on the Cassegrain spectrograph, with the same grating and wavelength coverage. The observations (2 600 s) were kindly undertaken by H. Winkler on 1997 October 2/3, in photometric conditions. The flux standard star EG 21 was observed immediately after the 1WGA J0053.8–7226 observations, and the data reduced using IRAF222IRAF is distributed by NOAO, which is operated by AURA, Inc., under contract to the NSF. tasks in ccdproc, onedspec and twodspec.
The close proximity of the two objects in Star A meant that the individual spectra were hardly resolved in the spatial direction (i.e. perpendicular to the slit) on the CCD, having a typical cross section of FWHM 3 pixels. Using the apall program, we experimented extracting the spectrum using a range of apertures. The H emission was clearly visible over several CCD rows, which we used as an initial indicator for which rows to extract for the Be star spectrum. The best results were achieved by optimally extracting the spectra over a range of rows, starting 6 pixels to one side of the peak in the cross section, to within 1 pixel of this peak (or 5 pixels in total). Likewise, the contaminating nearby F-star was extracted over the remaining pixels in the profile, i.e. 6 pixels on the other side of the peak to the limit of the Be star extraction (7 pixels). The spectra were first summed over 30 pixels at a time in the dispersion direction, to obtain the centroid (in the spatial direction) of the spectrum, and then traced using a cubic spline.
Observations of Star B were subsequently carried out using the same telescope and instrument set up on 19/20 August 1998.
Our results are shown in Fig. 4 where the spectra of both Stars A and B are shown. The spectrum of the F star near to Star A is shown in Figure 5. Although sky background has been subtracted, there has been no attempt to remove the telluric lines (e.g. the A-band). The nearby F-star shows strong Ca H & K and Balmer absorption lines, on a blue continuum. Judging from the relative strength of the G-band with respect to H, an early F spectral type is implied, consistent with the observed of 0.37. The H absorption line maybe somewhat filled in from contamination by the Be component to Star A. Indeed both spectra are likely to suffer from mutual contamination at some level, although the results are far superior to the RPCS spectra. We fitted Gaussian profiles to the emission lines for Stars A and B in both the RPCS discovery spectrum and the CCD spectra, and the results are summarised in Table 4. The radial velocity values are consistent with membership of the SMC, which has a mean systemic value of 166 3 km s-1(Feast 1961). The same is true for the nearby F2 star, which has a similar velocity shifted Balmer absorption lines.
| Object | Date | Radial Velocity | Flux | E.W. | FWHM |
|---|---|---|---|---|---|
| (km s-1 ) | ( ergs cm) | (Å) | (Å) | ||
| Star A | H: | ||||
| (Be star | 22/23 Sep 95 | 177 | 3.6 | –13.1 | 8.7 |
| component) | 2/3 Oct 97 | 157 | 3.7 | –11.6 | 9.2 |
| (15) | (0.3 ) | (0.9) | (0.7) | ||
| H: | |||||
| 2/3 Oct 97 | 186 | 4.1 | –0.8 | 5.4 | |
| (50) | (1.2 | (0.2) | (2.1) | ||
| Star B | H: | ||||
| 19/20 Aug 98 | - | 5.8 | –15.3 | 10.7 | |
| (0.3 ) | (0.9) | (0.7) | |||
| H: | |||||
| 19/20 Aug 98 | - | 1.3 | –1.76 | 6.9 | |
| (1.2 | (0.2) | (2.1) |


The remaining stars observed in, or near, the error circle are very unlikely to be the counterpart to the X-ray source. Stars C and E are clear A type stars, Star D is an F type, Star F a carbon star and G is probably a late K type, probably dwarf star (and also a significant distance from the X-ray position).
6 Discussion
Apart from H, H and the other Balmer lines (seen in absorption H, H, H, H8), there appears to be no other significant features in the spectra of Stars A and B. Regrettably the S/N ratio of the spectrum is insufficient to obtain further spectral typing information.
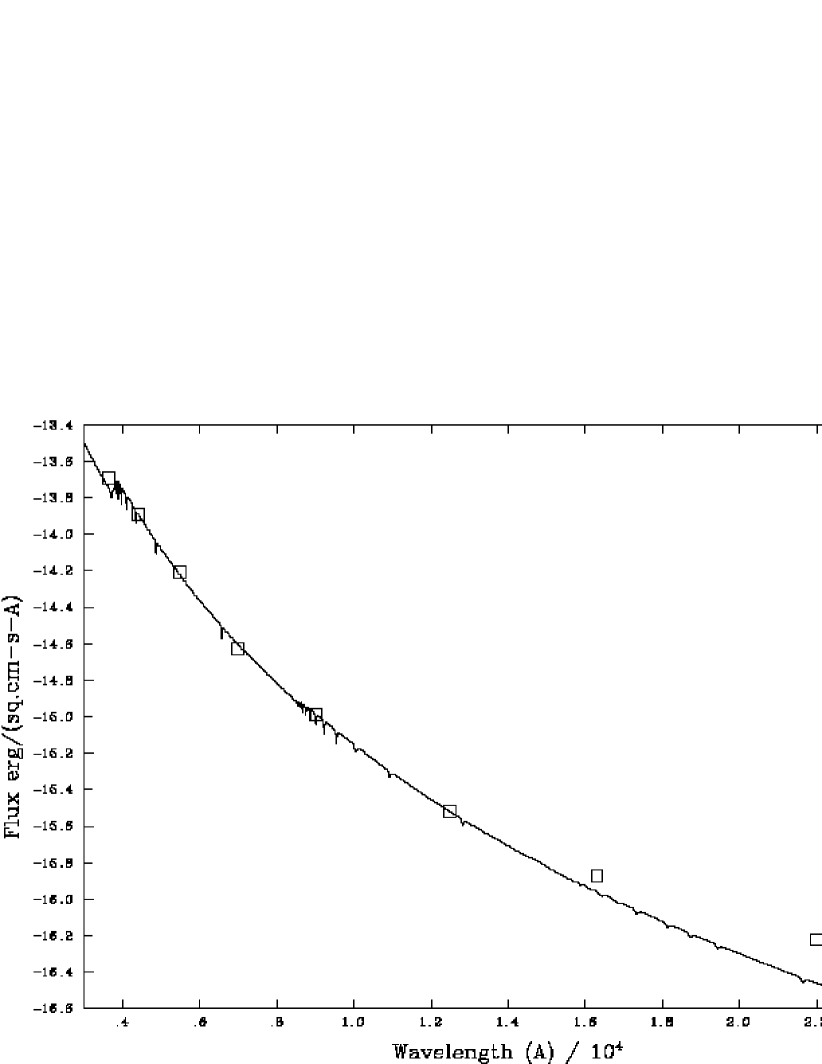
However, for the Be component of Star A we can use the contemporaneous optical and IR photometry from 1995 November to model the spectral shape. Assuming a value of E(B–V) = 0.15, we de-reddened our data and fitted a Kurucz model atmosphere to the photometry. Normalizing the model to our U band point results in an acceptable fit for T = 22000 2000 K and logg = 4.0. This fit is illustrated in Fig. 6, from which the IR excess over the stellar model is clearly visible. This temperature range corresponds to a B1-B2 spectral type.
Unfortunately we have no IR data for Star B to demonstrate that the IR excess for that object also exists. However, the (U–B) and (B–V) optical colours are very similar to those of Star B indicating a similar spectral type.
In the case of the Be star component to Star A membership of the SMC is clearly established. Hence we can estimate the absolute magnitude of this system using the observed apparent V magnitude in Table 2, correcting for an assumed absorption of E(B–V) 0.2, implying an 0.6. This gives 14.3, and for a distance modulus of (Westerlund 1997), implies = –4.6. This suggests a luminosity class III-V. For the nearby contaminating F2 star, the absolute magnitude is estimate to be = –4.8 to –5.4, respectively, for an in the range 0.0 to 0.2. This star is therefore most likely a supergiant F-star.
The degree of reddening seems consistent with the column density, , determined from the ROSAT observations. An of 0.15 implies a column of , which compares favourably with the value obtained from the X-ray spectrum (Section 2), namely . These column densities are all much larger than the column density to the SMC (), implying a local source of reddening consistent with a circumstellar disk around the Be star.
In Section 2 we estimated the unabsorbed 0.1–2.0 keV X-ray flux as 7.5 . Using the same power-law model, we calculate the unabsorbed 2-10 keV flux as 3.2 , which we use to determine the luminosity ratio, : , the ratio used by Bradt & McClintock (1983) in their survey of X-ray source optical counterparts. Our estimate of 2 for Star A comes from the optical spectrum (Fig. 4), where we integrated the flux over the interval 4000-7000Å, and extrapolated linearly to 3000Å. The derived (= ) ratio of 0.01–0.02 is very typical of HMXRBs, and the more active Be/X-ray binaries. The ratio is some 4 orders of magnitude greater than that expected from pure coronal emission from early type stars (Caillault & Helfand 1985), and consistent with accretion powered X-ray emission. The inferred luminosity of 1WGA J0053.8–7226 , (2-10keV) = 1.6 ergs s-1, is lower than X-ray “high-state” luminosities often seen in transient Be/X-ray systems, which are typically in the range . The value is far more typical of the quiescent luminosity produced by stellar wind accretion (Davidson & Ostriker 1973).
It is interesting to note that 1WGA J0053.8–7226 does not appear in the ROSAT HRI survey of the SMC (Cowley et al. 1997). An upper limit of 0.001 cts s-1 was placed on the flux, whereas it was expected to be 0.007 cts s-1 based on the Einstein count rate reported in Wang and Wu (1992). This clearly establishes the source as variable, since it was observed by both Einstein and the ROSAT PSPC (during the RASS).
1WGA J0053.8–7226 is clearly a transient source, with excellent bona fides for a Be/neutron star system. The X-ray, optical and IR variability (at least for one candidate), combined with the 92 s X-ray pulse period (Corbet et al. 1997), convincingly demonstrates that 1WGA J0053.8–7226 is a Be/neutron star binary system, though we are unable to distinguish between the two possible optical counterparts at this stage. Only if correlated optical/X-ray variability is seen, or a much more accurate X-ray position determined, will this point be resolved. This makes it the such system discovered in the SMC, following the discovery of RX J0117.6–7330 (Clark, Remillard and Woo 1997 and Coe et al 1998).
We also note that a significant number of X-ray pulsars have recently been discovered in this region of the SMC. In addition to the source RX J0051.8-7231, from which 8.9-second pulsations were reported by Israel et al. (1997), the sources AX J0051-722 (91 second pulsations, Corbet et al. 1998), 1WGA J0054.9-7226 (59 second pulsations, Marshall et al. 1998) and RX J0049.1-7250 (75 second pulsations, Yokogawa and Koyama 1998) have all been discovered in recently within a 40 arcminute region of the bar of the SMC. We have identified the optical counterparts to these X-ray pulsars to be SMC Be stars through similar optical programs as described here (Stevens, Coe and Buckley, 1999).
It is likely that the number of recent discoveries is simply due to the intensity of observations of this region following the discovery of the first pulsar. Future observations of the whole of the SMC with the new generation of X-ray telescopes should reveal whether this region really does contain an anomalous high density of X-ray pulsars.
Acknowledgments
We are grateful to the very helpful Sutherland staff at the SAAO for their support during these observations. Dr Hartmut Winkler (Vista University, Soweto) kindly provided a spectrum of 1WGA J0053.8–7226. The Shara Focal Reducer is on loan from Dr Michael Shara (STScI).
JBS is in receipt of a Southampton University studentship.
References
- [1] Bradt H.V., McClintock J.E., 1983, Ann. Rev. A&A, 21, 13
- [2] Bruhweiler F. C., Klinglesmith D. A., Gull T. R., Sofia S., 1987, ApJ, 317, 152
- [3] Caillault J-P., Helfand D.J., 1985, ApJ, 289, 279
- [4] Caldwell J. A., Cousins A. W. J., Ahlers C. C., van Wamelan P., Maritz E. J., 1993, SAAO Circulars, 15, 1
- [5] Clark G.W., Remillard R.A., Woo J.W., 1997, Ap.J., 474, L111
- [6] Coe M.J., Bell Burnell S.J., Engel A.R., Evans A.J. and Quenby J.J. 1981 MNRAS 197, 247.
- [7] Coe M.J. et al., 1994 A & A 289, 784.
- [8] Coe M.J., Buckley D.A.H., Charles P.A., Southwell K.A., Stevens J.B., 1998, MNRAS, 293, 43.
- [9] Coe M.J., Orosz J.A., 2000, MNRAS, 311, 169.
- [10] Corbet R., Marshall F.E., Lochner J.C., Ozaki M., Ueda Y., 1998, IAU Circular 6803
- [11] Cowley A. P., Schmidtke P. C., McGrath T. K., Ponder A. L., Fertig M. R., Hutchings J. B., Crampton D., 1997, PASP, 109, 21
- [12] Davidson K., Ostriker J.P, 1973, ApJ, 179, 585
- [13] Feast M. W., 1961, MNRAS, 122, 1
- [14] Giommi P., Angelini L., White N.E., 1995, Astronomical Data Analysis Software and Systems IV, ASP Conference Series, 1995 77, 117
- [15] Harris D., 1996, The ROSAT Newsletter, 12, p.3
- [16] in’t Zand J.J.M., Halpern J., Eracleous M., McCollough M., Augusteijn T., Remmilard R.A., Heise J., 2000, A&A (in press) and astro-ph/0006335.
- [17] Israel G. L., Stella L., Angelini L., White N.E., Giommi P., Covino, S., 1997, ApJ, 484, L141
- [18] Kahabka P., Pietsch W., 1996, A&A, 312, 919
- [19] Marshall F.E., Lochner J.C., Santangelo A., Cusumano G., Israel G.L., Dal Fiume D., Orlandini M., Frontera F., Parmar A.N., Corbet R.H.D., 1998, IAUC 6818
- [20] Mateo M., Schechter P. L., 1989, in Grösbol P.J., Murtagh P., Warmels R. H., eds, 1st ESO/ST-ECF Data Analysis Workshop. ESO, Garching, p. 69
- [21] Menzies J. W., Cousins A. W. J., Banfield R. M., Laing J. D., 1989, SAAO Circulars, 13, 1
- [22] Pisarski R., 1995, The ROSAT Newsletter, 11, p12.
- [23] Stevens J.B., Coe M.J., Buckley D.A.H., 1999, MNRAS 309, 421.
- [24] Westerlund B. E., 1997, The Magellanic clouds, Cambridge University press.
- [25] Wang Q. and Wu X., 1992, ApJSS, 78, 391
- [26] White N.E., Giommi P., Angelini L., 1994, IAU Circ 6100
- [27] Yokogawa J, Koyama K., 1998, IAUC 6835