Stellar Populations in the Phoenix Dwarf (dIrr/dSph) Galaxy as Observed by HST/WFPC2 111Based on observations with the NASA/ESA Hubble Space Telescope, obtained at the Space Telescope Science Institute, operated by AURA Inc under contract to NASA
Abstract
We present HST/WFPC2 photometry of the central regions of the Phoenix dwarf. Accurate photometry allows us to: 1) confirm the existence of the horizontal branch previously detected by ground-based observations, and use it to determine a distance to Phoenix, 2) clearly detect the existence of multiple ages in the stellar population of Phoenix, 3) determine a mean metallicity of the old red giant branch stars in Phoenix, and suggest that Phoenix has evolved chemically over its lifetime, 4) extract a rough star formation history for the central regions which suggests that Phoenix has been forming stars roughly continuously over its entire lifetime.
1 Introduction
The Phoenix dwarf galaxy, discovered by Schuster & West (1976), has a morphological type of dIrr/dSph (Mateo 1998), meaning that although this galaxy has a low surface brightness and a mass and morphology like a dwarf spheroidal (dSph) galaxy, there is evidence of recent star formation (Canterna & Flower 1977). Color-magnitude diagrams obtained from ground-based images have been described by Ortolani & Gratton (1988), van de Rydt, Demers, & Kunkel (1991), Held, Saviane, & Momany (1999), and Martinez-Delgado, Gallart, & Aparicio (1999). These studies find a broadly distributed metal-poor population of evolved giants, as well as a concentration of young stars in the central region of the galaxy. Several studies have found H I in the direction of Phoenix (Carignan, Demers, & Cote 1991; Young & Lo 1997); most recently, St-Germain, Carignan, Cote, & Oosterloo (1999) have found that a mass of of H I gas is likely associated with Phoenix.
Studying star formation in dwarf galaxies has the potential to provide clues about the mechanisms which govern star formation, and the relative formation epochs for different types of galaxies. Key questions include the age of the oldest stellar populations – are dwarf galaxies the oldest stellar systems and the building blocks for larger galaxies? – and the degree to which star formation is episodic. The latter issue has implications for the visibilities of different types of galaxies at high redshifts; if star formation is strongly episodic, then even small galaxies can appear bright when observed at redshifts for which star formation rates were greatest.
We initiated a HST/WFPC2 study of Phoenix to investigate its stellar population in greater detail. In particular, our project was motivated by the desire to determine whether an ancient population of stars exists by looking for a horizontal branch population. During the period between proposal submission and the time the observations were taken, however, several groups detected such a horizontal branch from ground-based observations (Held et al. 1999, Martinez-Delgado et al. 1999, Tolstoy et al. 2000). Nonetheless, the deeper HST data still provide several pieces of valuable information about the star formation history of Phoenix, which we discuss in this paper: 1) WFPC2 photometry of the horizontal branch is more precise than can be obtained from the ground, leading to the ability to study its morphology and determine its magnitude with higher precision, 2) the deeper observations allow us to observe stars down to the level of a turnoff for an ancient population, providing information on the distribution of ages of stars in Phoenix, and 3) accurate photometry of the younger main sequence stars allows us to assess the degree to which more recent star formation has been episodic and also to get some indication of the relative metallicities of the young population compared with the older one.
In section 2 we discuss our observations and data reduction. Section 3 discusses the morphology of the color-magnitude diagram. In Section 4 we use numerical simulations of the distribution of stars in the color-magnitude diagram to infer the star formation history of Phoenix, and discuss the uncertainties which attend such an analysis. Some implications of our Phoenix results for the evolution of dwarf galaxies in general are discussed in Section 5.
2 Observations and Reductions
One field in Phoenix centered on (J2000) = 01:51:06.3, (J2000) = -44:26:40.9 was imaged with WFPC2 on HST on 15 January 1999. While appearing to be close to the center of the galaxy as seen on the digitized POSS, this field was chosen to avoid bright (field) stars. Our program was specifically intended to concentrate on the old background stellar population of Phoenix. However, given that various authors (Held et al. 1999, Martinez-Delgado et al. 1999, Ortolani & Gratton 1988, Canterna & Flowers 1977) find the youngest stars in Phoenix to be concentrated towards the center of the galaxy, our WFPC2 field does sample these stars as well. Table 1 shows the relevant parameters for the HST observations.
The WFPC2 observations were obtained over a total of 4 orbits. Six exposures were made through each of the F555W and F814W filters. Half of the exposures were made at one telescope pointing, while the remaining half were slightly offset by arcsec along the axes of the WFPC2 CCDs. Data were processed through the STScI pipeline. The combined exposures in F555W at one of the pointings are shown in Figure 1.
Photometry was obtained using simultaneous PSF-fitting on the entire stack of frames, as described in Holtzman et al. (1997), using custom software within the XVISTA data reduction package that was developed/modified based on the routines of Stetson (1987); this software has been extensively used to reduce HST/WFPC2 data. In brief, all frames were constrained to have the same lists of stars with the same relative positions (allowing for slight scale changes between the two different filters). The stars in different exposures through the same filter were constrained to have the same relative brightnesses, with frame-to-frame scaling constrained by the relative exposure times. Model PSFs were derived individually for each frame using phase retrieval of a few bright stars to derive the mean focus for each frame, individual exposure jitter information, and the most recent estimates for the variations of aberrations and pupil functions across the WFPC2 field of view. Prior to the PSF fitting, frames at each of the two pointings were compared with each other to flag cosmic rays in each frame, and these were ignored during the fitting process. Aperture corrections were determined by comparing the PSF magnitudes with measurements of stars through radius apertures made on frames in which all neighbors had been subtracted using the PSF-fitting results. Both PSF-fitting and aperture photometry results were corrected for the effect of charge transfer efficiency problems in the WFPC2 detectors using the prescription of Dolphin (2000); results presented in this paper were largely unaffected by this correction, however.
Zeropoints from Holtzman et al. (1995) were used to place the instrumental magnitudes on the synthetic WFPC2 photometric system (which we use for comparison with isochrones), and transformations to Johnson/Cousins V and I from Holtzman et al. (1995) were used for comparison with previous results on the tip of the red giant branch and giant branch colors.
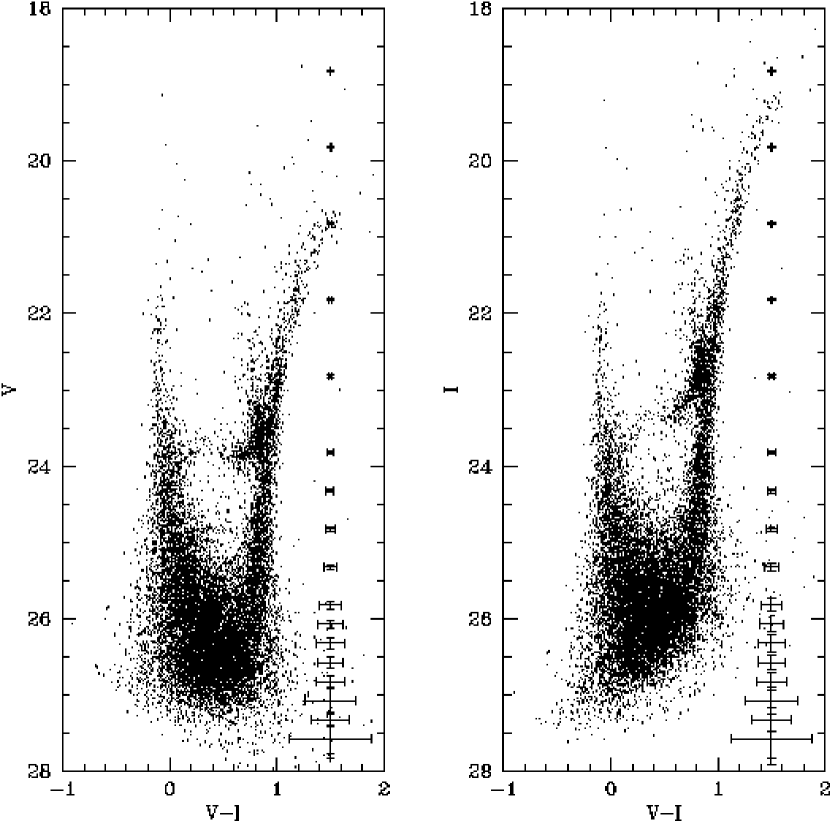
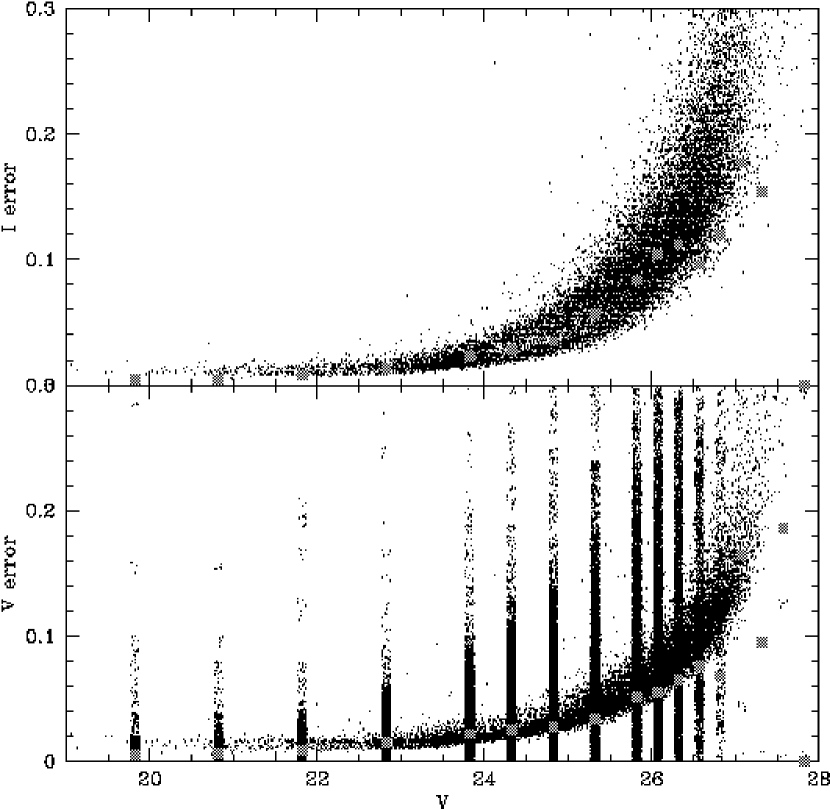
The V vs. (V-I) and I vs. (V-I) color-magnitude diagrams (CMDs) for the full WFPC2 field observed in Phoenix are shown in Figure 2. Photometric errors as estimated from the PSF-fitting are plotted versus magnitude in Figure 3 and demonstrate the high accuracy of the WFPC2 photometry; typical 1 photometric errors at the horizontal branch are mag.
More detailed photometric errors were derived using a set of twenty artificial star tests. In each test, over a thousand simulated stars of a given brightness were added to images in a grid pattern (to prevent additional crowding) and photometry was rederived for all stars on the frame. The 20 tests covered brightnesses between , with finer sampling at the faint end to measure the completeness of the photometry; at each brightness, the artificial stars were chosen to have the median color of the observed stars at that brightness. Photometry for the simulated stars at each magnitude were extracted to provide error histograms. These were used in the construction of artificial CMDs discussed below. In general, the true errors (difference between observed and simulated brightnesses) are comparable to those estimated from the PSF-fitting routines for the bulk of the simulated stars, but there is always a subset of stars which have significantly larger errors. These are generally the product of systematic errors caused by crowding, and as a result, are correlated in the two bandpasses. In addition, the errors for the artificial stars are smaller than those estimated by the PSF-fitting routines for the brighter stars, which is most likely a result of using the exact same PSF to create and reduce the artificial stars. An indication of these effects is shown in the bottom panel of Figure 3; the various vertical bands are the measured errors for the simulated stars. The distribution of these errors is non-Gaussian since a small subset of stars have relatively large errors; still, it is apparent that the bulk of the artificial stars have observed errors consistent with the rms errors which are output from the PSF-fitting routine (and shown as the continuous set of points). We emphasize, however, that we use the observed error distribution from the artifical star tests in our detailed comparison of simulated CMDs with the data discussed below.
Error bars plotted in Figure 2 show the rms errors from the artificial star tests as a function of magnitude. Since the true distribution of errors is non-Gaussian, these do not fully convey all the information we have used about the error distribution; the error bars shown in Figure 2 were computed by determining an rms from the measured error distribution with rejection of outliers.
3 The Color-Magnitude Diagram
The CMD of Phoenix provides examples of stars in many different stages of stellar evolution. The CMD exhibits the types of sequences, most notably the near-vertical blue and red “plumes,” which are typical of dwarf irregular galaxies (e.g., Cole et al. 1999). The main stellar sequences which constitute such plumes are illustrated by Dohm-Palmer et al. (1997) and Gallart et al. (1996).
The vertical blue sequence is the main sequence of a young stellar population in Phoenix. The red sequence is a combination of giant branch and asymptotic giant branch stars which can have a wide range of ages and metallicities. In addition, there is a clear detection of a horizontal branch in Phoenix, with both blue and red components. There is a red clump of stars found near the intersection of the horizontal branch and the giant branch that extends more than 0.5 mag in V and I brighter than the red horizontal branch (RHB). The stars in this clump that are brighter than the RHB are intermediate-age (1-10 Gyr) core helium-burning stars. Finally, there are indications of two sequences extending upwards from the red clump; the most populated one is nearly vertical, and is particularly pronounced in the magnitude range , while a second very sparsely populated sequence gets bluer at brighter magnitudes; these (especially the bluer one) can perhaps be seen more clearly in the larger area ground-based observations of Held et al. (1999). These two sequences correspond to core helium burning stars at either end of the blue loops through which relatively young massive stars evolve.
3.1 Red giant branch
The red giant branch (RGB) is located between and 1.6, and extends brightward to . The color of the RGB can be used to place constraints on the metallicity of stars in Phoenix, and the brightness of the tip can be used as a distance indicator.
If we adopt a distance modulus of (Held et al. 1999, and see below), then the mean color of the red giant branch at () is , or . Using the calibration of Da Costa & Armandroff (1990) between at and [Fe/H], gives a mean metallicity for the Phoenix red giants of [Fe/H] . Our estimate of the mean metallicity of Phoenix is in good agreement with the result of Held et al. (1999), dex lower than that of Martinez-Delgado et al. (1999), and 0.13 dex higher than that of van de Rydt et al. (1991). With an absolute visual magnitude of (Pritchett & van den Bergh 1999), Phoenix falls very close to the [Fe/H] versus relation obtained by Caldwell et al. (1992) for Local Group dwarf elliptical and spheroidal galaxies.
The giant branch at is mag wide in . If this is assumed to be entirely due to a metallicity spread within an ancient stellar population then the calibration of Da Costa & Armandroff (1990) indicates a metallicity spread within Phoenix of [Fe/H] to However, two effects complicate the above determination of the mean metallicity and metallicity spread of Phoenix from giant branch colors. First, the blue edge of the giant branch is likely to include some asymptotic giant branch stars. Second, and probably more important, the giant branch color is a function of age as well as metallicity, in that younger giants are bluer than older ones. At fixed metallicity but mixed ages, the giant branch color derived from assuming an exclusively old population will underestimate the mean metallicity, and the giant branch width will overestimate the metallicity spread. However, if ages and metallicity are correlated, as would occur if younger populations are enhanced in metals, the true metallicity spread can be significantly larger than that inferred from the giant branch width assuming an exclusively old population.
Although there is some uncertainty about the metallicity depending on the age, there is still an upper limit which can be placed on the metallicity of any component of the population. Even if the entire population was young (less than a few Gyr), the color of the giant branch would still require a metallicity less than [Fe/H] -0.7 based on recent Padova isochrones (Girardi et al. 2000, Girardi et al. 1996). This is demonstrated in Figure 4, which shows the Phoenix CMD with isochrones for ages 1.6, 3.2, 6.4, and 12.8 Gyr at and . In order for the RGB to be consistent with a metallicity of Z=0.004 ([Fe/H] = -0.7), the Padova isochrones indicate that the ages of RGB stars would have to be less than 2 Gyr.
The deep HST data allow us to constrain the population further, since the red giant branch of Phoenix is found to be well populated right down to , i.e. , down to the luminosities expected for the base of the RGB of a 13 Gyr stellar population. This demonstrates conclusively that not all the stars are young. Within the allowed range of metallicity, giants which are this faint must be older than 6 Gyr, based on comparisons with the Padova isochrones; for such ages, the dependence of giant branch color on age is relatively weak. Since a significant fraction of the red giants must be relatively old, the isochrones indicate that they must also be relatively metal-poor, i.e. [Fe/H] -1.7.
A more quantitative discussion of the metallicity spread within Phoenix requires analysis of the relative numbers of younger and older stars. This is discussed further below. However, in terms of both the mean metallicity and the extension to faint magnitudes, the RGB of Phoenix is consistent with this galaxy containing a substantial component of stars analogous to Population II of the Milky Way.
The magnitude of the tip of the red giant branch can be used as a distance indicator for metal-poor populations. The accuracy of this technique in the current data set may be limited by the relatively small number of stars; one might expect that the tip magnitude derived from the relatively smaller number of stars in the WFPC2 frame would be fainter than a true tip magnitude, since our tip is essentially defined by the single brightest red giant. Still, we find an apparent tip magnitude of , which is essentially identical to the tip magnitude derived by Held et al. (1999) and just 0.1 mag fainter than the RGB tip determined by Martinez-Delgado et al. (1999), both from ground-based photometry. We adopt an absolute magnitude of for the tip (Lee et al. 1993) and a reddening of (Burstein & Heiles 1982), giving E(V-I) = 0.026 (). This yields a distance modulus for Phoenix based on the tip of the RGB of ; the error in this quantity is several percent based on uncertainties in the adopted extinction. If the true tip is brighter than our brightest star, the distance modulus would be smaller. Our distance provides additional support for the derived TRGB distances of Held et al. () and Martinez-Delgado et al. ().
3.2 Horizontal branch
A horizontal branch (HB) can be discerned at and which merges with the red giant branch at . There are well-defined blue (BHB) and red (RHB) components of the horizontal branch, separated by a gap which likely contains RR Lyrae stars. At first glance the occurrence of a RHB in Phoenix, which has a mean metallicity as low as [Fe/H] (i.e. , comparable to Galactic globular clusters such as M13 and M3), might indicate that Phoenix is an example of a second-parameter stellar system. However, if there is a metallicity spread, at least some of these RHB stars may have evolved from the most metal-rich old red giants in Phoenix. Given that there is likely both an age and metallicity (see below) spread in Phoenix, interpreting the morphology of the horizontal branch is a complex problem. Nevertheless, the presence of a distinct blue HB clearly indicates that there is an ancient population of stars in Phoenix, as noted by Tolstoy et al. (2000).
The accurate WFPC2 photometry allows a measurement of the horizontal branch magnitude at . From ground-based photometry, Held et al. (1999) estimated the horizontal branch to be at . Using the Lee et al. (1990) relation between the absolute visual HB magnitude and metallicity, our measurement gives a distance of , larger than the TRGB method, but perhaps not in bad agreement given uncertainties in the HB calibration.
3.3 Main sequence
A young main sequence locus extends brightward to (with a few even brighter stars) or . A similar blue plume with was found by Martinez-Delgado et al. (1999) at magnitudes brighter than (which corresponds to the faint limit of their photometry at ), and is evident in the region and of Fig. 12 of Held et al. (1999). In these ground-based CMDs the main sequence population does not appear to be as prominent as seen in the WFPC2 CMD; this may be an effect of larger photometric errors smearing out the ground-based observations of the main sequence and increasing incompleteness for bluer stars in the ground-based observations. The accuracy of the WFPC2 photometry shows that the main sequence is well populated, and hence that the young star contribution to the total population of Phoenix is significant, as will be shown quantitatively below.
Figure 5 shows the Padova isochrones for two ages (100 Myr and 3.2 Gyr) and metallicities of and 0.004. The extension of the main sequence up to suggests that stars as young as 100 Myr exist in Phoenix, in good agreement with previous works (Martinez-Delgado et al. 1999, Held et al. 1999). Main sequence turnoff stars this bright would have masses of .
Several points are apparent from Figure 5. First, there are many stars which fall significantly redward of any of the ZAMS isochrones. The observed width (in color) of the upper main sequence is significantly larger than expected from observational errors; from artificial star tests we find that magnitudes for the bulk of the stars are measured to an accuracy of a few percent down to . The color spread of main sequence stars almost certainly implies that stars with a range of ages exist in Phoenix; it is highly unlikely that the color spread results entirely from metallicity spread, since very metal-rich stars would be required. Such a metal-rich population would produce giants significantly redder than any that are observed. Stars which fall redward of the ZAMS are stars which are evolving off of the main sequence. Despite the accurate photometry, there are no pronounced main sequence turnoffs in the CMD between ages of 100 Myr and 4 Gyr, suggesting that the young population in Phoenix is not the result of one or several distinct bursts of star formation, but rather is the result of a more continuous star formation history over the past several Gyr. This is consistent with the analysis of Martinez-Delgado et al. (1999), who estimate that the recent ( Gyr) star formation rate is comparable to the average star formation rate for the age interval 1-15 Gyr.
It appears that the isochrone ([Fe/H] = , i.e. the metallicity inferred for the giants) falls blueward of the main body of the main sequence, suggesting that the younger stars in Phoenix have significantly higher metallicities than the older population. This would imply that Phoenix has undergone chemical enrichment over its lifetime. This suggestion is supported by the giant branch colors as well; if all of the stars in Phoenix had [Fe/H] -1.7, the younger giants would be bluer than any of the observed giants.
3.4 Other core helium burning stars
A clear red clump of stars exists near the intersection of the horizontal branch with the red giant branch. These are intermediate age (several Gyr) core helium burning stars, and confirm the existence of an intermediate age population suggested by the width of the main sequence.
A sequence of red helium-burning stars (with ages of around 0.4-0.8 Gyr) extends vertically upwards from the red end of the horizontal branch to an magnitude comparable to the tip of the red giant branch. This sequence is located about 0.2 mag blueward of the RGB isochrones. These are younger stars in the reddest stage of the so-called “blue loops” of later stellar evolution. There is a hint of a sequence corresponding to the blue end of the blue loops; this sequence slopes towards the main sequence and although it has only a few stars, it is defined by the observation that there are gaps around it in the CMD, suggesting that these stars are not foreground stars. The exact details of the ages of these stars is difficult to ascertain without knowledge of their metallicities.
Intermediate-age (1-10 Gyr) asymptotic giant branch stars are seen in CMDs of dwarf irregular galaxies such as IC 1613 (Cole et al. 1999), Sextans A (Dohm-Palmer et al. 1997), and NGC 6822 (Gallart et al. 1996), where they extend redward of from the region of the tip of the first ascent giant branch. There are few such stars apparent in the Phoenix CMD of Figure 2. However, Held et al. (1999) found a significant number of such stars in their ground-based CMD and they concluded on this basis that intermediate-age stars constitute a substantial component of Phoenix; additional evidence for the presence of AGB stars is discussed by Martinez-Delgado et al. (1999).
4 The Star Formation History of Phoenix
Given that stars of many different ages are present in Phoenix, it is of interest to know the relative number of stars at different ages, or alternatively, the history of the star formation rate. To some extent, the answer to this question depends on where one looks in Phoenix, since it is apparent from larger field studies (Held et al. 1999, Martinez-Delgado et al. 1999) that the star formation history varies across the galaxy, with younger stars being more centrally concentrated. Here we consider somewhat more quantitatively the approximate star formation history that is required to match the populations seen in the central region of Phoenix imaged by HST/WFPC2. We can also try to quantitatively address the relative numbers of stars of different metallicities.
There are many complications to extracting star formation histories from the distribution of stars in a CMD, and several groups have developed different methods for doing so (e.g., Tolstoy & Saha 1996; Dolphin 1997; Hernandez, Valls-Gabaud, & Gilmore 1999; Ng 1998; Gallart et al. 1999; Holtzman et al. 1999). In the current paper, we analyze our CMD based on the methods of Holtzman et al. (1999), in which the number of stars in many regions of the CMD are fit using least-squares techniques to a combination of basis functions of stellar populations of different ages and metallicities. The best fit was derived using the estimator of Mighell (1999).
The interpretation of derived star formation histories, and in particular an understanding of the uncertainties in the results, is a complex issue. Detailed comparisons of results obtained by using different methods have not yet been performed, and the sensitivity of the results to systematic errors, e.g., in the input stellar models or assumed initial mass function (IMF), is difficult to assess. Consequently, the results presented here should be viewed as preliminary; we attempt to assess uncertainties by showing results not only for different parameters, but also using different subsets of the observed data to derive star formation histories.
For the current purpose, we derive a star formation history assuming an IMF with the Salpeter (1955) slope. Since we do not sample the lower main sequence of completely unevolved stars, independent constraints on the IMF slope are difficult. We also assume that unresolved binaries are not important in the observed CMD of Phoenix, which will be the case regardless of the true binary fraction in the galaxy if the masses of binary stars are drawn independently from the same initial mass function. This is because the most likely companion masses in this case are significantly lower than the masses of the stars which are observed and thus do not strongly affect the system luminosity or color. The issue of whether masses in binary star pairs are uncorrelated or not is still the matter of significant debate.
We derive star formation histories for different age bins, where the width of the age bins increases logarithmically with lookback time. This is necessitated by the fact that it becomes increasingly difficult to resolve (in a temporal sense) star formation events as one goes to older ages, since isochrones become more and more similar for older ages. As a result, the derived star formation histories cannot provide information about the variation of the star formation rate on time scales shorter than the width of the age bins, roughly 25% of the age of any given population. Within each age bin, the star formation rate is assumed to be constant.
Star formation histories were extracted from the Phoenix CMD for five different choices of distance modulus: , 23.0, 23.1, 23.2, and 23.3. Using , the distance as derived from our TRGB, gave the best fits (lowest ), although they were only marginally better than those using . For the reasons discussed above, it was not possible to find good fits to the CMD using an exclusively metal-poor population, or for that matter, using any star formation history in which the metallicity does not change over time. This is because the giant branch requires a metal-poor population, while the main sequence requires a population of higher metallicity. As a result, we imposed no constraints on an age-metallicity relation to fit the Phoenix population; the constituent basis stellar populations cover all combinations of age and metallicity, although only seven discrete metallicities (corresponding to those for which we have isochrones from the Padova group) were used.
Results for our best-fitting model are shown in Figure 6. The upper left panel gives the best fitting star formation rate as a function of lookback time. Since we only cover a small region of the galaxy, this star formation history is given in a relative sense only; the total number of stars formed is normalized to sum to unity. The quality of the fit can be judged by looking at the residual Hess diagram shown in the lower right. This panel shows the difference between the number of observed and the number of stars in the best-fitting model, in units of the expected errors from counting statistics; the diagram is scaled so that the range of black to white covers from to , where is defined based on the suggestions made by Mighell (1999). Other panels show the derived cumulative age and metallicity distribution functions, and a comparison of the observed and model luminosity functions. In general, results are more uncertain for the youngest populations ( Gyr), since the stars that are uniquely contributed by these populations (upper main sequence stars) comprise a relatively small number of the stars in the color-magnitude diagram.
The lower left panel gives a representation of the “population box” (Hodge 1989) for the central regions of Phoenix. This combines information about the derived formation rate as a function of age and metallicity. Remarkably, without imposing any constraints on the age-metallicity relation, we recover a rough relation in which metallicity increases with time; a similar result also emerged from a similar analysis of several fields in the LMC (Holtzman et al. 1999). This lends quantitative support to our suggestion that the metallicity in Phoenix has evolved over time; the derived metallicity distribution is shown in the upper right panel. The population box may also highlight some problems with the models as well; the observed color-magnitude diagram appears to require a small population of young metal-poor stars. The presence of this feature comes from the existence of a few relatively blue upper main sequence stars, so it is difficult to know for sure how seriously to consider them; accurate photometry over a larger field is required.
A comprehensive understanding of the uncertainties in the results presented in Figure 6 is difficult. The formal errors on the derived star formation rates are relatively small, usually 5-10% for most of the age bins (larger for the youngest ages). However, the true uncertainties are probably significantly larger and systematic, depending on the choice of constituent basis stellar populations, distance, reddening, IMF, stellar models, the use of discrete metallicities, and the details of how the best fit is defined. Our experience with allowing these to vary suggests that while the star formation rate in individual age bins can vary significantly (factor of two), the variations are correlated such that changes in derived star formation rate for one stellar population are generally accompanied by nearly opposite changes in other similiar (i.e. , in age or metallicity) populations. As a result, the cumulative age distribution tends to be relatively robust against systematic errors. This is demonstrated in Figure 7, which shows cumulative age distributions for a variety of models. The solid curves all use the same distance modulus, but are determined using different subsets of the observed data: results were derived using two different faint magnitude cutoffs ( and ) for the region of the CMD which was fit and using both the complete data set as well as using randomly selected subsamples of half the observed stars. The dotted curves show the systematic changes resulting from using different distance moduli, although the extremes of these choices ( and 23.3) provide noticeably poorer fits.
Our overall conclusion is that the CMD of Phoenix requires star formation to have been ongoing at a roughly constant rate over a Hubble time. The fits suggest that the bulk of the stars even in the central region of Phoenix are older than 5 Gyr.
The details of fluctuations in the overall star formation rate are significantly more uncertain. Although the fit in Figure 6 suggests some fluctuations in the star formation rate, we feel that the actual evidence for strong variations is weak, although they are certainly not ruled out. Different choices of population parameters (e.g., distance) or what regions of the CMD are fit can change the timing and amplitude of these fluctuations. As a result, it is less clear as to what the current results show about whether the star formation rate in Phoenix is episodic. However, it is clear from an inspection of the CMD that there are no distinct main sequence turnoffs as can be seen, for example, in the CMDs of the Carina dwarf spheroidal (Smecker-Hane et al. 1996).
One of the main reasons for uncertainties in the details of the star formation history comes from the age-metallicity degeneracy of the location of stars around the turnoff in a CMD; different combinations of age and metallicity can place stars at the same location in the CMD. Without the presence of the unevolved lower main sequence in the current data or independent measurement of metallicities, it becomes difficult to accurately separate these different populations. The situation would be improved with significantly deeper photometry and/or with the measurement of independent metallicities for individual stars in Phoenix.
5 Discussion
Deep HST/WFPC2 imaging has provided a color-magnitude diagram (CMD) of the central regions of the Phoenix dwarf galaxy at unprecedented accuracy. The presence of stars at all ages is apparent in this diagram. A distinct horizontal branch and the presence of a red giant branch which extends all the way down to a turnoff expected for an old population indicates that this system has a substantial component of metal-poor stars with metallicities comparable to the mean of the Galactic halo; Phoenix appears to have an underlying component of ancient Population II stars. In this respect it is similar to dwarf spheroidal galaxies like Ursa Minor, Draco, and Sculptor, as previously concluded by Held et al. (1999), Martinez-Delgado et al. (1999), and Tolstoy et al. (2000).
However, the existence of red clump stars and main sequence stars confirm that Phoenix has experienced considerable star formation over the past few Gyr, with star formation possibly as recent as 100 Myr ago. The location of the main sequence suggests that the metallicity in Phoenix has evolved with time; old blue horizontal branch stars and the giant branch stars require low metallicities, comparable to those in the halo of the Milky Way, while the younger main sequence stars suggest somewhat higher metallicities.
Fits to the observed CMD suggest that star formation has been roughly continuous over the lifetime of Phoenix. There is no obvious evidence for strongly episodic star formation, although the formal fits for the star formation history suggest that a mildly varying star formation rate can certainly fit the data. One caveat to this statement is that it applies only over relatively long (e.g., Gyr) timescales; burstiness on very short timescales would be essentially impossible to distinguish from the CMD for all but the most recent past. Another caveat is that the details of the derived star formation rate are suspect due to a variety of reasons including the age-metallicity degeneracy; independent measurements of metallicities of stars in Phoenix should improve the situation considerably.
The implications are that a dwarf galaxy can have star formation which extends over nearly a Hubble time. With roughly continuous star formation, Phoenix appears to resemble the Magellanic Clouds (e.g., Holtzman et al. 1999). However, Phoenix is a significantly less massive system in which it might be expected that the loss of interstellar gas and interruptions in star formation would be much more important. In fact, the apparent star formation history of Phoenix stands in contrast to the strongly episodic star formation of Carina (Smecker-Hane et al. 1994, 1996, Hurley-Keller et al. 1998), a dwarf galaxy that is only 0.8 mag fainter than Phoenix (Mateo 1998). It appears that the mechanisms governing star formation in dwarf galaxies may be rather complex.
The HST/WFPC2 data on Phoenix add support to the growing evidence in the literature that dwarf galaxies, both dIrrs and dSphs, can have very varied star formation histories, particularly in recent epochs. By contrast, it may be possible that there is at least some commonality between dwarf galaxies in regard to their early chemical evolution. As noted in Section 3.1, Phoenix appears to follow the same integrated-magnitude versus metallicity relation as dwarf spheroidal galaxies in the Local Group, some of which, like Draco and Ursa Minor, do not appear to have supported recent star formation such as that of Phoenix. Nonetheless the degree of chemical enrichment in these systems, as indicated by the color of the old giant branch, would appear to be correlated with the overall (luminous) mass of the galaxy. This suggests that the amount of metal enrichment during the earliest phases of star formation within dwarf galaxies (perhaps more than Gyr ago) does vary in a way that depends to some extent on basic galaxy properties such as mass. In classical closed box models of chemical evolution the average metallicity of all stars formed up to a given time is proportional to the fraction by mass of the galaxy that has turned into stars (e.g., Smith 1985). Within the context of such a model, the observations indicate that the fraction of a galaxy which is turned into old metal-poor stars, and the attendant early chemical evolution history, is governed by similar mechanisms in both dSph and dIrr galaxies.
Support for this work was provided by NASA through grant number GO-0698.02-95A from the Space Telescope Science Institute, which is operated by the Association of Universities for Research in Astronomy, Incorporated, under NASA contract NAS5-26555.
References
- (1)
- (2) Burstein, D. & Heiles, C. 1982, AJ, 87, 1165
- (3) Caldwell, N., Armandroff, T. E., Seitzer, P., & Da Costa, G. S. 1992, AJ, 103, 840
- (4) Canterna, R., & Flower, P. J. 1977, ApJ, 212, L57
- (5) Carignan, C., Demers, S., & Cote, S. 1991, ApJ 381, L13
- (6) Cole, A. A., et al. 1999, AJ, 118, 1657
- (7) Da Costa, G. S., & Armandroff, T. E. 1990, AJ, 100, 162
- (8) Dohm-Palmer, R. C., Skillman, E. D., Saha, A., Tolstoy, E., Mateo, M., Gallagher, J., Hoessel, J., Chiosi, C., & Dufour, R. J. 1997, AJ, 114, 2514
- (9) Dolphin, A. 1997, NewA, 2, 397
- (10) Dolphin, A. 2000, PASP, in press
- (11) Gallart, C., Aparicio, A., Bertelli, G., & Chiosi, C. 1996, AJ, 112, 1950
- (12) Gallart, C., Freedman, W. L., Aparicio, A., Bertelli, G., & Chiosi, C. 1999, AJ, 118, 2245
- (13) Girardi, L., Bressan, A., Bertelli, G., & Chiosi, C. 2000, A&AS 141, 371
- (14) Girardi, L., Bressan, A., Chiosi, C., Bertelli, G., & Nasi, E. 1996, A&AS 117, 113
- (15) Held, E. V., Saviane, I., & Momany, Y. 1999, A&A, 345, 747
- (16) Hernandez, X., Valls-Gabaud, D., & Gilmore, G. 1999, MNRAS, 304, 705
- (17) Hodge, P. 1989, ARA&A, 27, 139
- (18) Holtzman, J. A., Burrows, C. J., Casertano, S., Hester, J.J., Trauger, J. T., Watson, A. M., Worthey, G., & the WFPC2 IDT 1995, PASP, 107, 1065
- (19) Holtzman, J. A., Mould, J. R., Gallagher, J.S., Watson, A. M., Grillmair, C. J., & the WFPC2 IDT 1995, AJ, 113, 656
- (20) Holtzman, J. A., Gallagher, J.S., Cole, A.A., Mould, J.R., Grillmair, C.J., & the WFPC2 IDT 1999, AJ, 118, 2262
- (21) Hurley-Keller, D., Mateo, M., & Nemec, J., 1998, AJ, 115, 1840
- (22) Lee, Y.W., Demarque, P., & Zinn, R. 1990, ApJ 350, 155
- (23) Lee, M. G., Freedman, W. L., & Madore, B. F. 1993, ApJ, 417, 553
- (24) Martinez-Delgado, D., Gallart, C., & Aparicio, A. 1999, AJ, 118, 862
- (25) Mateo, M. 1998, ARA&A, 36, 435
- (26) Mighell, K.J., 1999, ApJ, 518, 380
- (27) Ng, Y. K. 1998, A&AS, 132, 133
- (28) Ortolani, S., & Gratton, R. G. 1988, PASP, 100, 1405
- (29) Pritchett, C. J., & van den Bergh, S. 1999, AJ, 118, 883
- (30) Salpeter, E. E. 1955, ApJ, 121, 161
- (31) Schuster, H. E., & West, R. M. 1976, A&A, 49, 129
- (32) Smecker-Hane, T. A., Stetson, P. B., Hesser, J. E., & Lehnert, M. D. 1994, AJ, 108, 507
- (33) Smecker-Hane, T. A., Stetson, P. B., Hesser, J. E., & VandenBerg, D. A. 1996, in From Stars to Galaxies: The Impact of Stellar Physics on Galaxy Evolution, ASP Conf. Ser. Vol. 98, eds. C. Leitherer, U. Fritze-von-Alvensleben, & J. Huchra (San Francisco: ASP), p. 328
- (34) Smith, G. H. 1985, PASP, 97, 1058
- (35) Stetson, P.B. 1987, PASP 99, 191
- (36) St-Germain, J., Carignan, C., Cote, S., & Oosterloo, T. 1999, AJ, 118, 1235
- (37) Tolstoy, E., Gallagher, J., Greggio, L., Tosi, M., De Marchi, G., Romaniello, M., Minniti, D., & Zijlstra, A. 2000, The Messenger, 99, 16
- (38) Tolstoy, E., & Saha, A. 1996, ApJ, 462, 672
- (39) van de Rydt, F., Demers, S., & Kunkel, W. E. 1991, AJ, 102, 130
- (40) Young, L., & Lo, K.Y. 1997, ApJ 490, 710
| Table 1. | ||
|---|---|---|
| Summary of Observations | ||
| Dataset | Filter | Exposure time (s) |
| u48i0201r | F814W | 100 |
| u48i0202m | F814W | 1300 |
| u48i0203r | F814W | 1000 |
| u48i0204r | F555W | 100 |
| u48i0205r | F555W | 1300 |
| u48i0206r | F555W | 1100 |
| u48i0207r | F555W | 100 |
| u48i0208r | F555W | 1300 |
| u48i0209r | F555W | 1000 |
| u48i020ar | F814W | 100 |
| u48i020br | F814W | 1300 |
| u48i020cr | F814W | 1100 |


![[Uncaptioned image]](/html/astro-ph/0008468/assets/x5.png)
