Embedded Star Clusters: The ISO View
Abstract
We summarize the main results of a mid-IR photometric survey with ISO for a few nearby embedded clusters. The sensitivity and spatial resolution of ISOCAM provided a wonderful tool for studies of the youngest stellar clusters, which are still deeply embedded in their parent molecular clouds. Mid-IR photometry is found to be extremely efficient in finding all the young stellar objects (YSOs) with IR excesses, i.e. mainly T Tauri stars surrounded by circumstellar disks and also some Class I sources. The spatial distribution of these sources is highly clustered and even sub-clustered, with a tendency of stronger concentration for the younger regions. The improved samples of IR-excess YSOs appear complete down to for the most nearby clusters. This gives constraints on the mass functions well into the brown dwarf domain. The first results show that the mass functions of these clusters are identical to the field star IMF derived by Kroupa et al. (1993) with a flattening of the mass function at .
ESTEC, Astrophysics Division, Noordwijk, The Netherlands
Nordic Optical Telescope, Apdo 474, E-38700 Santa Cruz de La Palma
Observatoire de Bordeaux, BP 89, FR-33270 Floirac
1. Introduction
Large scale cluster properties, such as the stellar Initial Mass Function (IMF) and the spatial distributions, are likely to hold important clues to the questions related to the origin and early evolution of stellar clusters. In order to address these problems we approach the large scale properties observationally in as young clusters as possible. By doing that, we should avoid the potential incompleteness problems often encountered in studies of clusters of ages yrs, such as mass segregation and loss of low-mass members through dynamical evolution. In addition, in these young regions there is a closer link between the stars and the material from which the stars form, such that studies of the cloud morphology and e.g. the clump mass functions can be directly compared to the stellar mass functions. Detection and classification of stellar and sub-stellar members of embedded clusters require sensitivity and spatial resolution in the infrared (IR). Since the majority of the cluster members are contracting down the Hayashi track, or in some cases even in their protostellar phases at these young ages, they are more luminous than later on, especially in the IR. This paper reviews what has been discerned about embedded star clusters from ISOCAM, the mid-IR camera aboard the Infrared Space Observatory (Cesarsky et al. 1996; Kessler et al. 1996).
Before ISOCAM, our knowledge of the stellar content of embedded clusters was in most cases limited to observations in the near-IR and the IRAS survey. Extensive ground based surveys in the J (1.25 m), H (1.65 m), and K (2.2 m) bands have revealed numerous Young Stellar Objects (YSOs) clustered in star formation regions (e.g. Eiroa & Casali 1992, Prusti et al. 1992; Wilking et al. 1997; Barsony et al. 1997), while mid-IR ground based data have been more scarce (Lada & Wilking 1984, Greene et al. 1994), and the spatial resolution of IRAS has been a limitation. See Wilking (2000) for an observational review on embedded clusters.
Section 2 gives an overview of the ISOCAM star formation surveys, Section 3 presents the general result of improved YSO samples based on the IR excess criterion, Section 4 discusses the nature of the IR-excess population, Section 5 the spatial distributions, Section 6 the improved luminosity functions, and Section 7 the implications for the IMF.
2. The ISOCAM surveys of star-formation regions
The surveys LNORDH.SURVEY_1 and GOLOFSSO.D_SURMC within the ISO central programme mapped selected parts of the major nearby star formation regions in the two broad band filters LW2 (5-8.5 m) and LW3 (12-18 m), designed to avoid the silicate features, and selected to sample the mid-IR Spectral Energy Distribution (SED) of YSOs in different evolutionary phases. The objective of the survey was to make a deep search for low-mass YSOs.
A review of these surveys was given by Nordh et al. (1998). The first results increased the number of recognized YSOs in the Chamaeleon dark clouds by almost a factor of 2 (Nordh et al. 1996). Olofsson et al. (1998) obtained a luminosity function for the Chamaeleon I IR-excess YSOs, finding that a substantial fraction of these objects could be young brown dwarfs with circumstellar disks, as suggested from their IR colours. An improved luminosity function from re-analyzed data was presented by Persi et al. (2000). The first results from the R Corona Australis region are found in Olofsson et al. (1999). The Ophiuchi embedded cluster is presented by Bontemps et al. (2000a, 2000b) with a thorough derivation of the luminosity and mass function. ISOCAM results on the Serpens Cloud are found in Kaas et al. (1999, 2000a, 2000b). Analysis of other regions is on-going, and specific results will be detailed elsewhere.
3. Deep sample of embedded YSOs with ISOCAM
The observational challenge in a statistical study of an embedded cluster is primarily to detect the stellar objects, then to separate the cluster members from field stars, and finally to determine intrinsic properties such as luminosity and mass of the members. The degree of embeddedness (A 10-100) requires sensitive IR observations, and the clustering requires good spatial resolution. With the 3-6′′/pix resolution of ISOCAM, and with an achievable sensitivity of a few mJy for 15 s on-source integration at 6.7 and 14.3 m, we are able to sample objects down to at least 0.02 for the nearby regions. This corresponds to masses well into the brown dwarf regime, for reasonable estimates of the ages.
A summary of the main observational result in Chamaeleon, RCrA, Ophiuchi, and Serpens is given in Fig. 1a)-d), where we plot the colour index , defined as the logarithm of the flux ratio between the two filters, versus the flux at 14.3 m (in Jansky). As an alternative to the index, one can calculate the SED index between 6.7 and 14.3 m, shown on the right-hand y-axes. In each region the sources fall in two separate groups. One is located at (), which is the colour expected for normal photospheres, i.e. the slope in the Rayleigh-Jeans tail. The spread around this value mainly indicates the increasing photometric uncertainty with decreasing flux. The effect of extinction is small, and a reddening vector of size corresponding to A (A 30) is indicated in each panel. The second group of sources comprises all objects located well above the first group. These are sources with mid-IR excess emission. Most of these sources have colours typical of classical T Tauri stars (CTTS), and the IR excess is interpreted in terms of optically thick circumstellar disk emission.


Fig. 1 a) shows sources from 3 maps (about 0.8 square degrees) located in Cha I (Persi et al. 2000), Cha II and Cha III (Nordh et al. 1996). Fig. 1 b) shows point sources from 0.42 square degrees in RCrA (Olofsson et al. 1999), where the central Coronet cluster could not be mapped due to detector saturation precautions. The Ophiuchi sample from a total of 0.7 square degrees mapping (Bontemps et al. 2000a,b) is shown in Fig. 1 c). Fig. 1 d) shows the sample from a 0.22 square degree survey of the Serpens Cloud (Kaas et al. 1999). Filled circles indicate the new YSOs found with ISOCAM.
Practically all sources detected with ISOCAM have near-IR K-band counterparts; although in dense clouds and for the youngest objects, relatively deep K-band ( 15 mag) data might be required. Thus, rather than having discovered previously unseen objects, the main value of the ISOCAM surveys has been to provide a means by which IR-excess YSOs can be easily distinguished from field stars, mainly due to the small effect of reddening in the mid-IR. YSOs without IR-excesses, on the other hand, can not be recognized, and alternative approaches, such as X-ray surveys (Feigelson & Montmerle 1999), appear promising in order to sample this part of the cluster population. ISOCAM has, on the average, doubled the IR-excess populations.


While circumstellar dust easily is recognized by the IR excesses that show up in broad band photometry, it is necessary, however, to go to sufficiently long wavelengths in order to clearly separate the effects of cloud extinction to those of intrinsic IR excess. This is illustrated in Fig. 2 where we compare the frequently used colour diagram with the single colour index for sources from Ophiuchi and Serpens with available ISOCAM and JHK photometry. The left panel shows a clear separation of the IR excess population (filled circles). In the diagram, however, sources with IR-excess (filled circles) mix with those without IR excesses (open triangles) and cluster along the reddening vector. We find that on the average about 50% of the mid-IR excess population have near-IR excesses in the diagram (e.g. Kaas et al. 2000b). Thus, studies of embedded clusters based on JHK data alone are seriously incomplete, and any determination of disk frequencies based on such studies must be interpreted with care.
The IR excesses, so apparent in the colour index, show up already at 6.7 m, and both the diagram (Olofsson et al. 1999, Persi et al. 2000) and the diagram (Kaas et al. 2000b) are efficient in distinguishing between intrinsic IR excess and effects of scattering and extinction. These diagrams are used to sample faint IR-excess sources not detected at 14.3 m.
4. The nature of the IR-excess sources
According to the current empirical picture of early stellar evolution (Adams et al. 1987; Lada 1987; André et al. 1993), young stars can be observationally classified along the evolutionary sequence: Class 0 - Class I - Class II - Class III; corresponding to a gradual loss of circumstellar matter with age. For sources with near-IR and mid-IR photometry, one can use the classical parametrization of the Spectral Energy Distribution (SED) and calculate the mid-IR spectral index , usually taken between 2 and 10 m (Wilking & Lada 1984). In Fig. 3 we plot versus , or equivalently the colour diagram, for a subset of our sources and draw the YSO class loci according to current definitions. Previously known Class I sources (large stars), Class II sources (filled circles), and Class III sources (filled triangles) appear mainly within their respective loci.

Following this simplified IR spectral classification scheme, the new IR-excess population (open circles) can now be tentatively classified as Class I and Class II sources. In Chamaeleon I and in Ophiuchi the resulting Class I/Class II number ratio is about , as expected based on current ideas about the timescales for each phase. In the Serpens Cloud Core, however, this ratio is appreciably larger (close to 1), and this has been interpreted in terms of an extremely young age for this region (Kaas et al. 2000a, 2000b).
The strong influence of extinction at 2.2 m is apparent. Sources without IR-excesses (triangles) are outlining the reddening line in this diagram. These are a mix of reddened field stars and Class III sources, and the large scatter is probably from the contribution of small IR excesses in a number of Class II - Class III transition objects. The border used in Fig. 1 to separate between Class II and Class III sources, at corresponding to , is shown as a dashed slope. The mid-IR excess group to the right follows roughly the same slope as the reddening vector, and Class I sources are found at the extreme end of the colour, rather than at the extreme of the colour. We speculate that this roughly similar colour for Class II and Class I sources could be due to dust properties such as broad silicate absorption features or the presence of H2O and CO2 ices in the 14.3 m band for the more embedded sources (Class Is), but this requires further study.
Since we cannot distinguish between Class III sources and field stars from broad band photometry alone, we can only give rough upper limits on the disk frequencies in the populations sampled by ISOCAM, based on previous studies of the stellar populations and/or models of the mid-IR point source sky. As an example, we mention that within the region covered by ISOCAM in Chamaeleon I, the fraction of IR-excess sources among currently known YSOs is 76% (Persi et al. 2000). There could be more Class IIIs, however, among the non-IR-excess sources. Also, the fraction of disk sources among YSOs should be counted as a function of cluster radius or cloud density, in order to compare between the regions.
5. Spatial distributions
The spatial distribution of the IR-excess YSOs is always found clustered at the scale of the molecular clouds, but also more locally, as a few sub-clusters which are normally associated with the dense cores of the molecular clouds. In Chamaeleon I clustering is apparent around the reflection nebula Ced 112 on a size scale of about 10-15 arcmin or 0.5-0.7 pc, while the clustering around Ced 110 and Ced 111 is less confined (Nordh et al. 1996; Persi et al. 2000). In Ophiuchi 4 sub-clusters are found associated with dense cores: Oph A, B, EF (between Oph E and Oph F) and L1689S. These have approximate sizes of 4-8 arcmin, or 0.2-0.3 pc (Bontemps et al. 2000b). For comparison, the spatial distribution in TMC-1 shows no sign of clustering.
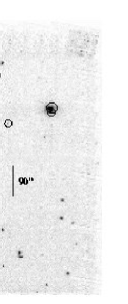
Figure 4 shows a 13’ 13’ ISOCAM image covering the Serpens Cloud Core ( 1 square pc for a distance of 260 pc). The YSOs with sufficient IR-excess to be of Class II and Class I type (encircled) mainly follow a NW-SE oriented ridge, and most are further seen clustered into 4 dense sub-clusters (large circles), each with a diameter of about 1.5 arcmin, or 0.1 pc. Each of these contains between 5 and 14 YSOs in general (at the sensitivity and resolution of ISOCAM), and between 2 and 6 Class I sources in particular (Kaas et al. 2000a,b). The unusually rich collection of clustered Class I sources strongly argues in favour of this region being especially young. The locations of the sub-clusters coincide well with the distribution of tracers of the dense cloud, such as 1100 m continuum emission (Casali et al. 1993), C18O line emission (White et al. 1995), and high resolution 3 mm continuum emission (Testi & Sargent 1998). In particular, the 4 clusters coincide with the spatially and kinematically separated N2H+ cores A,B,C,D found by Testi et al. (2000), which strongly supports their claim of an observational evidence for hierachical fragmentation within a cluster-forming core.
6. Luminosity and mass functions
As shown in the previous sections, mid-IR surveys significantly improve the census of young stars in embedded clusters. This provides new and larger samples of newly formed stars in these star forming regions. The resulting luminosity functions (LF) are therefore more complete and give more precise constraints on the distribution of stellar masses which can give clues to the origin of the galactic IMF. The embedded young stars are, however, difficult to study, and even their stellar luminosities are not easy to estimate from simple photometric data (without spectroscopy).
For embedded (not optically visible) pre-main sequence stars, the most reliable method to estimate stellar luminosities from photometric data consists in deriving dereddened I or J band magnitudes and to convert them to stellar luminosities. This is possible because I and J are close to the maximum of the photospheric energy distribution and not too much affected by intrinsic IR excesses (e.g. Greene et al. 1994, Persi et al. 2000, Bontemps et al. 2000b). The resulting luminosity functions for the Ophiuchi (140 pc) and the Chamaeleon I (160 pc) clusters are shown in Fig. 5. These luminosity functions are actually limited to Class II YSOs. The Class III YSO samples are still too incomplete to be included.
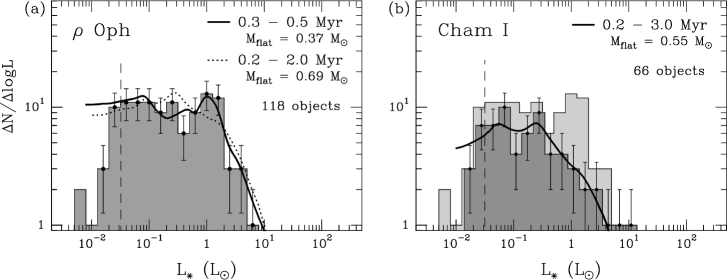
The global shapes of these two luminosity functions are similar: the number of stars per logarithmic bin sharply decreases for and is more or less constant at low luminosities, down to the completeness level, which is equal to in both cases. However, the flattening occurs at for Ophiuchi while at for Chamaeleon I. Even if the “flattening luminosity” for Chamaeleon I is rather uncertain due to the smaller number of stars (66 instead of 118 for Ophiuchi), the Ophiuchi luminosity function certainly flattens out at a higher luminosity than the Chamaeleon I LF. According to Bontemps et al. (2000b), the clear flattening over two orders of magnitude in the Ophiuchi cluster can be explained only by a similar flattening of the underlying mass function. Assuming a flat (in logarithmic units) mass function, these authors have built a simple modeling of the LFs using D’Antona & Mazzitelli (1998) pre-main sequence tracks and assuming some simple age distributions for the young stellar population (see Bontemps et al. 2000b for details). The results of this modeling are shown in Fig. 5 for Ophiuchi and Chamaeleon I. The parameters for these fits (made on the parameter at which the mass function flattens out) are given in the plots. For Ophiuchi the best fit is obtained with the combination of a rather small age of 0.4 Myr for the Class IIs and . A model with a broad distribution of ages between 0.2 and 2.0 Myr, and a larger flattening mass can, however, also fit the data acceptably. A small age for the Ophiuchi embedded population has been favored by recent, independent works (Greene & Meyer 1995; Luhman & Rieke 1999). Our new results might therefore support very well these previous suggestions. Fig. 5b shows the result of a similar modeling for the Chamaeleon I data (reduced to the 66 Class IIs with estimates in Persi et al. 2000). It shows that a good modeling of the observed luminosity function is also possible here. An older population of stars is used because there are good evidences that the Chamaeleon I region is older than Ophiuchi (e.g. Lawson et al. 1996). With such a larger average age, the flattening at a lower luminosity can be reproduced with more or less the same mass function as for Ophiuchi: the best fit is obtained with .
7. Implications for the IMF
The constraints on the mass functions within the surveyed clusters, which are born in typical star-forming regions, are expected to ultimately explain the origin of the field star IMF. Up to now a mass function has been derived only for the Ophiuchi cluster. After correction for hidden binaries, Bontemps et al. (2000b) obtained a single star mass function which is very similar to the field star IMF derived by Kroupa et al. (1993). No turnover or local maximum is recognized down to . This shows that a large number of young brown dwarfs are actually present in the Ophiuchi cluster. Thirty brown-dwarf candidates111They all have a mid-IR excess since they have been selected using this criterium. have been detected there.
8. Conclusions
The ISOCAM survey has significantly improved our understanding of embedded clusters. Because the samples of IR-excess YSOs are now much more complete, the IMF can be studied with confidence well into the brown dwarf domain for the nearest regions, and the distribution of the youngest YSOs (Class I and Class II sources) can be studied on small spatial scales. There is good correspondance between the currently estimated ages of the 3 star formation regions Chamaeleon I, Ophiuch and Serpens, and the size of their sub-clusters of IR-excess YSOs. We conclude that the luminosity functions which are complete down to can easily be modeled with plausible age distributions. The mass functions needed to reproduce the observations are roughly flat in logarithmic units in the low-mass range, and the flattening occurs at of the order of . For future work we would like to build luminosity functions for more clusters to test whether such a flat mass function can always reproduce the observations.
References
Adams, F.C., Lada, C.J., Shu, F.H., 1987, ApJ 312, 788
Andre, P., Ward-Thompson, D., Barsony, M., 1993, ApJ 406, 122
Andre, P., Montmerle, T., 1994, ApJ 420, 837
Barsony, M., Kenyon, S.J., Lada, E.A., Teuben, P.J., 1997, ApJS 112, 109
Bontemps, S., 2000a, In: Star Formation from the Small to the Large Scale, eds. F. Favata, A.A. Kaas, A. Wilson, ESA SP-445, 427
Bontemps, S., André, P., Kaas, A.A., Nordh, L., Olofsson, G., Huldtgren, M., et al. 2000b, submitted to A&A
Casali, M.M. Eiroa, C., Duncan, W.D., 1993, A%A 275, 195
Cesarsky, C.J., et al. 1996, A&A 315, L32
D’Antona, F., Mazzitelli, I., 1998. In: Brown Dwarfs and Extrasolar Planets, Rebolo R., Martín E.L., Zapatero Osorio M.R. (eds.), ASP Conf. Ser., vol. 134, 442
Eiroa, C., Casali, M.M., 1992, A&A 262, 468
Feigelson, E.D., Montmerle, T., 1999, ARA&A 37, 363
Greene, T.P., Meyer, M.R., 1995, ApJ 450, 233
Greene, T.P., Wilking, B.A., André, P., Young, E.T., Lada, C.J., 1994, ApJ 434, 614
Kaas, A.A., Olofsson, G., Bontemps, S., et al., 1999, In: The Universe as seen by ISO, ESA SP-427, 493
Kaas, A.A., Olofsson, G., Bontemps, S., et al., 2000a, In: Star Formation from the Small to the Large Scale, ESA SP-445, 427
Kaas, A.A., Olofsson, G., Bontemps, S., et al., 2000b, in prep. for A&A
Kessler, M.F., et al., 1996, A&A 315, L27
Kroupa, P., Tout, C., Gilmore, G.F., 1993, MNRAS 262, 545
Lada, C., 1987, In: IAU Symp. 115, Star Forming Regions, eds. Peimbert, M., Jugaku, J., p. 1
Lada, C., Wilking, B.A., 1984, ApJ 287, 610
Lawson, W.A., Feigelson, E.D., Huenemoerder, D.P., 1996, MNRAS 280, 1071
Luhman, G.H., Rieke, G.H., 1999, ApJ 525, 440
Nordh, L., Olofsson, G., Abergel, A., et al. 1996, A&A 315, L185
Nordh, L., Olofsson, G., Bontemps, S., Huldtgren, M., Kaas, A.A., et al., 1998, In: Star Formation with ISO, eds. Yun, J., Liseau, R., p. 127
Olofsson, G., Kaas, A.A., Nordh, L., Bontemps, S., Huldtgren, M., et al., 1998, In: Brown Dwarfs and Extrasolar Planets, eds. R. Rebolo, E.L. Martin, M.R. Zapatero Osorio, p. 81
Olofsson, G., Huldtgren, M., Kaas, A.A., Bontemps, S., Nordh, L., et al., 1999, A&A 350, 883
Persi, P., Marenzi, A.R., Olofsson, G., et al., 2000, A&A 357, 219
Prusti, T., Whittet, D.C.B., Wesselius, P.R., 1992, MNRAS 254, 361
Strom, K.M., Strom, S.E., Merrill, K.M., 1993, ApJ 412, 233
Strom, K.M., Kepner, J., Strom, S.E., 1995, ApJ 438, 813
Testi, L., Sargent, A.I., 1998, ApJ 508, L91
Testi, L., Sargent, A.I., Olmi, L., Onello, J.S., 2000, in press
White, G.J., Casali, M.M., Eiroa, C., 1995, A&A 298, 594
Wilking, B.A., Greene, T.P., Lada, C.J., Meyer, M.R., Giblin, T., Reyner, J.T., Zinnecker, H., 1997, AJ 114, 2029
Wilking, B.A., 2000, this issue