email: Michel.Boer@cesr.fr
Evidences for two Gamma-Ray Burst
afterglow
emission regimes
Abstract
We applied cosmological and absorption corrections to the X-ray and optical afterglow fluxes of a sample of Gamma-Ray Burst sources of known distance. We find a good correlation in X-rays and that the GRBs in our sample form two well defined classes. We tentatively interpret them as radiative and adiabatic afterglow behaviours in the framework of the fireball model for GRBs. We do not observe this correlation at optical wavelengths. This discrepancy with the model may be due to the absorption in the source vicinity.
Key Words.:
Gamma-Ray Bursts; X-ray Afterglows; Optical Afterglows1 Introduction
The detection of X-ray and optical afterglows of cosmic gamma-ray bursts (hereafter GRB) has firmly established the fireball model (Rees and Mészáros Rees92 (1992), Mészáros and Rees Mesz97 (1997), Panaitescu et al. Pana98 (1998)) as a standard tool to interpret GRB afterglows. A vast majority of sources have X-ray afterglows, while about half of them have been observed at optical wavelengths. The fireball model provides firm predictions on the temporal behaviour of the afterglow emission at all wavelengths, allowing an inter-comparison of different events (Piran Piran99 (1999), Sari et al. Sari98 (1998)). In this framework the afterglow emission is described as synchrotron emission of accelerated electrons during the shock of an ultra-relativistic shell with the external medium.
In this letter, we use a set of GRB sources detected during their afterglow both at X-ray and optical wavelengths, and for which a firm measure of the source distance has been established. We apply several distance corrections and we take into account the galactic absorption for the optical data. The light-curve of each source of our sample is computed for a standard distance corresponding to a redshift of 1.
2 The burst sample
We used a sample of eight GRBs detected both at X-ray, by the NFI instrument on board the BeppoSAX satellite, and optical wavelengths. A redshift measure is available for each of the sources of our sample. We did not use the data from GRB 980425 since its association with SN 1998bw remains questionable. The redshifts and the main references on the sources of our sample have been summarized on table 1.
-
1
Costa Costa99 (1999)
-
2
Galama et al. Gal97 (1997)
-
3
Pedersen et al. Peder98 (1998)
-
4
Diercks et al. Diercks98 (1998)
-
5
Djogovsky et al. Djo98 (1998)
-
6
Hjort et al. Hjort98 (1998)
-
7
Halpern et al. Halp98 (1998)
-
8
Vreeswijk et al. Vree99 (1999)
-
9
Galama et al. Gal99 (1999)
-
10
Staneck et al. Sta99 (1999)
-
11
Piro L. Piro00 (2000)
-
12
Halpern et al. Halp00 (2000)
We insist on the fact that we selected GRBs on the basis of the consistency of X-ray and optical data. This imply to use only the BeppoSAX data for the 2-10 keV band and optical magnitudes in the R band.
3 Normalization of the X-ray data
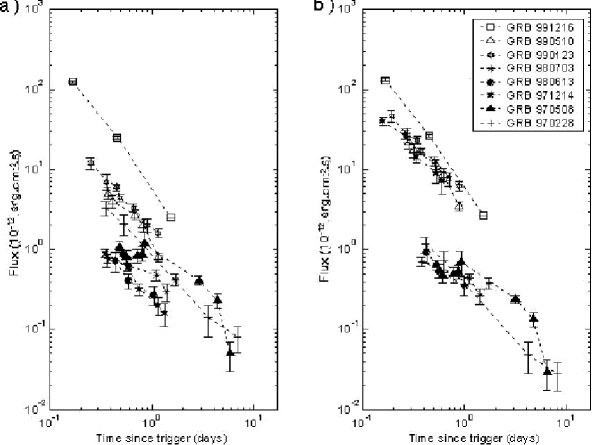
In order to be able to compare the flux in the 2-10keV band, we normalized the data to a common distance corresponding to a redshift of 1. We applied the following corrections: distance-luminosity (relative to the target distance), normalization to the 2-10keV band in flux, and time dilation of the temporal scale. These corrections have been computed using the spectral index provided for the GRB source spectra when available. When the burst X-ray spectrum was not known with enough accuracy, we used the value of 1, which seems to be consistent with the majority of the burst afterglow spectra (Costa Costa99 (1999)). We took as a base a flat universe with . Table 2 details the resulting correction factors applied to the data.
Figure 1a displays the X-ray afterglow raw data. The same sample is displayed figure 1b, but we applied the corrections shown in table 1 in order to plot the light curves for a standard distance corresponding to a redshift of 1.
4 Optical data
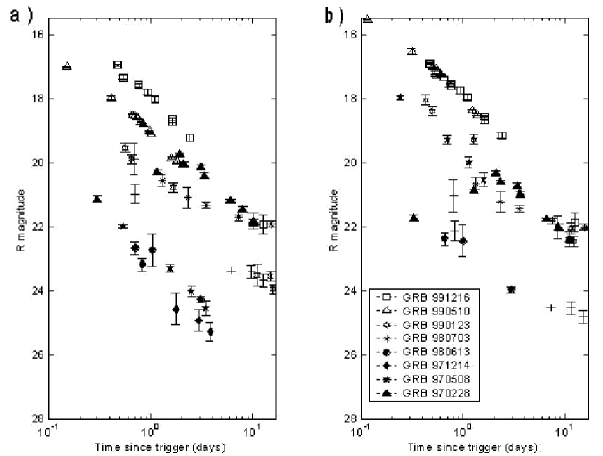
The same corrections have been computed for the optical data in the R band from the same sources, of course taking into account the wavelength. At optical wavelengths the galactic absorption may be somewhat high. We used the work of Schlegel et al. (Schl98 (1998)) to derive an additional correction to apply to the data. The resulting factors are shown on table 3.
The raw optical light curves are displayed on figure 2a. On figure 2b we plotted the corrected light curves, again for a standard distance corresponding to a redshift of 1. As it can be seen, the correlation observed at X-ray wavelengths vanishes almost completely, though the dispersion in magnitude is somewhat reduced.
5 Discussion and conclusions
The X-ray data present, when corrected, an obvious correlation into two homogeneous groups. We find a mean slope of for the most luminous subset, and for the less luminous afterglows.
If we try to interpret the observed correlation in the framework of the fireball model, we have to suppose that the differential density of the medium shocked by the fireball plays a secondary role. Let us refer to the equations (7) to (12) of Sari at al. (Sari98 (1998)). If we take for the index of the electron distribution power law, our results at X-ray wavelengths are compatible with the radiative case for the most luminous afterglow group, and with the adiabatic case for the less luminous group. This is also close to the standard value assumed by Sari et al. (Sari96 (1996)) of .
However, the afterglow temporal evolution should be dependent on the surrounding medium density. It is clearly not the case here, though the burst sample is somewhat restricted. An explanation may be that the burst source surrounding medium has been ”washed” before the shock. Of course, in the absence of any measure of the critical transition time of the afterglow light curve, it is impossible to conclude on the density parameter. However the correlation we present at X-ray wavelengths seems to be more compatible with a weak dependence on it, i.e. a somewhat low density medium. For the GRBs belonging to the most luminous group, this conclusion is consistent with the results obtained by Kumar (Kum2000 (2000)) for a sample of 7 bursts in the same 2-10 keV energy range. It is interesting to note that Kumar and Piran (Kum2000b (2000)) have shown that the width of the distribution function for the X-ray afterglow flux should be significantly smaller that the spread in GRB fluences. The small number of sources we used in this work prevent from any firm conclusion, though GRB afterglows in the slow cooling regime may show a larger dispersion, which may be confirmed with the larger data set expected from HETE-2 and SWIFT.
It is difficult to find a firm explanation on the absence of correlation at optical wavelengths. Since the fireball model predicts that the ratio between the optical and X-ray luminosity should remain approximately constant during the early phases of the afterglow, we can try to explain the absence of correlation by an external reason, such as the absorption in the host galaxy of the GRB source. In this case the discussion of the above paragraph does not apply. Assuming that the X-ray and optical light curves have the same indexes, we computed the absorption coefficients tabulated in the second column of table 4.
All values are relative to the magnitude of GRB 980703. For GRB 970508, we computed the correction on the decreasing part of the light curve after 1.5 day. This correction is negative for GRB 970508, the most luminous of our sample. Since the absorption occurs at UV wavelengths if we take into account the source redshift, these values are quite reasonable. They correspond to a rough column density of at most (Prehdel and Schmitt Pred95 (1995)). For these values of the host galaxy medium column density, the transmission coefficient of 2keV photons is above 0.95 (Seward, Sew2000 (2000)). In order to assess the role of the UV absorption, we computed the decay slopes at X-ray wavelengths, and we compare them with the rate of decay of the afterglow light in the R band. The results are given in the last two columns of table 4.
The mean power law decay index at X-ray wavelengths is for the most luminous afterglow group, and for the less luminous one. At optical wavelengths the values are respectively , and . Though there is on average some difference at optical wavelengths also between the two groups, this feature cannot be considered as established.
We have presented in this letter a correlation between the afterglow light curves at X-ray wavelengths. While this behaviour is not observed in the optical domain, the decreasing rate may appear to be correlated in both energy ranges. The fireball model provides a framework to explain the X-ray light curves, while the host galactic absorption may shade the correlation in the visible range. The HETE-2 experiment, due to launch this year, will provide new data which may confirm this picture.
Acknowledgements.
We thank J.L. Attéia, R. Mochkovitch, P. Mészáros and the anonymous referee for helpful comments. Thanks are also due to J. Greiner who maintains a web page (http://www.aip.de/jcg/grb.html) with exhaustive data on burst afterglows.References
- (1) Costa, E., 1999, A&AS 138, 425
- (2) Diercks, A., et al., 1998, ApJ 503, L105
- (3) Djogovski, S.G., et al., 1998, GCN 117
- (4) Galama, T. et al., 1997, Nat 387, 479
- (5) Galama, T. et al., 1999, Nat 398, 394
- (6) Halpern, J.P., et al., 1998, GCN 134
- (7) Halpern, J.P., et al., 2000, ApJ, in press
- (8) Hjorth, J., et al., 1998, GCN 109
- (9) Kumar, P., 2000, ApJ 538, L125
- (10) Kumar, P., and Piran, T., 2000, ApJ 535, 152
- (11) Mészáros, P., and Rees, M., 1997, ApJ 476, 232
- (12) Panaitescu, A., Mészáros, P., and Rees, M., 1998, ApJ 503, 314
- (13) Pedersen, H., et al., 1998, ApJ 496, 311
- (14) Piran, T., 1999, Phys. Rep. 314, 575
- (15) Piro, L., 2000, Astrophys. Let. Com., in press
- (16) Predehl, P., and Schmitt, J.H.M.M., 1995, A&A 293, 889
- (17) Rees, M., and Mészáros, P., 1992, MNRAS 258, 41
- (18) Sari, R., Narayan, R., and Piran, T., 1996, ApJ 473, 204
- (19) Sari, R., Piran, T., Narayan, R., ApJ 497, L17
- (20) Schlegel, D.J., Finkbeiner, D.P., and Davis, M. 1998, ApJ 500, 525
- (21) Seward, F.D., 2000, in Allen’s Astrophysical Quantities, A.N. Cox (edt.), Springer Verlag, p. 195
- (22) Stanek, K.Z., et al., 1999, ApJ 522, L39
- (23) Vreeswijk, P.M., et al., 1999, A&AS 138, 447