Optical Variability of the T Tauri Star HH3011affiliation: Based on observations obtained with the 1.2 m Telescope at the F. L. Whipple Observatory
Abstract
We report results of photometric monitoring of the T Tauri star plus disk system HH30. We find that HH30 is highly variable over timescales of a few days with mag, mag. Furthermore we find hints of periodicity with periodograms indicating possible periods of 11.6 and 19.8 days. The photometry is available through the anonymous ftp service. We model the variability with Monte Carlo radiation transfer simulations for a spotted star plus disk system and find that the large variability is best reproduced with a single hot spot and circumstellar grains that are larger than typical interstellar grains. The apparent existence of a single hot spot and the need for larger, more forward throwing grains is consistent with previous modeling of HST imagery.
keywords:
stars: pre-main-sequence — stars: rotation — stars: spots — stars: individual (HH30) — accretion, accretion disks — radiative transfer1. Introduction
Signatures of hot and cool starspots have been observed in numerous T Tauri stars, primarily in the form of photometric variability, with periodic variability detected in hundreds of systems (e.g., Bouvier et al. 1993; Wichmann et al. 1998; Choi & Herbst 1996; Makidon et al. 1997; Stassun et al. 1999). While cool spots have been mapped through Doppler imaging of weak-lined T Tauri stars (e.g., Hatzes 1995), hot spots tend to be associated with variability in Classical T Tauri stars (e.g., Kenyon et al. 1994; Bouvier et al. 1993; Herbst et al. 1994). The hot spots are thought to be associated with the accretion process, and the currently favored magnetic accretion models naturally provide for hot spots on stellar surfaces (Ghosh & Lamb 1979a, 1979b; Königl 1991; Shu et al. 1994; Ostriker & Shu 1995; Najita 1995).
Hot spots yield specific brightness and polarization variations as they rotate into and out of view (Wood et al. 1996; Mahdavi & Kenyon 1998; Stassun & Wood 1999). Wood & Whitney (1998) investigated the effects of hot starspots on the morphology of scattered light disks. The non-axisymmetric illumination of the disk by hot spots leads to an asymmetric brightening of the disk. Such asymmetric brightening has been detected in HST observations of the edge-on disk system HH30 (Burrows et al. 1996; Stapelfeldt et al. 1999a), hinting at possible agreement with the magnetic accretion model.
The gross consistency between the existing observations of HH30 and the predictions of the magnetic accretion model is tantalizing, but ambiguous due to the large timescales separating the HST observations. Periodic variability due to magnetic accretion is expected to match the rotational periods for Classical T Tauri stars: of the order less than one day to tens of days (Attridge & Herbst 1992; Bouvier et al. 1993; Edwards et al. 1993; Eaton et al. 1995; Stassun et al. 1999; Herbst, et al. 2000). In some cases the hotspots are stable over many rotation periods.
Motivated by the apparent success of the magnetic accretion model at explaining the morphological variations observed in the limited HST imagery, we have undertaken a ground-based photometric monitoring campaign on HH30 to determine the timescale of any variability. In Section 2 we present the results of our observational campaign, in Section 3 we present models for the observed photometric variability, and we summarize our findings in Section 4.
2. Observations
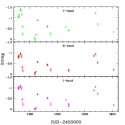
Data for HH30 (RA = 04 31 37.5, DEC = 18 12 26.0; , , Mundt & Fried 1983) were obtained with the 1.2 m telescope at the F. L. Whipple Observatory (FLWO), using the “4Shooter” CCD mosaic (Szentgyorgyi et al. 2000) with four thinned, back-side illuminated, AR coated Loral CCDs. The camera has a pixel scale of 0.335 arcsec/pixel and field of view of roughly 11.5 arcmin for each chip. The data were taken in the CCD binning mode. To obtain multi-wavelength variability information we used filters from the FLWO “Harris Set”. We obtained data (see Figure 1), between September 7th 1999 and February 28th 2000, usually consisting of up to three sets of 300 sec, 180 sec, 180 sec exposures. In total we have 24 useful images of HH30 in the -band and 27 useful images in each of the -bands, spanning about 174 days. The seeing ranged from arcsec to about arcsec. The data can be accessed from anonymous ftp at ftp://cfa-ftp.harvard.edu/pub/kstanek/HH30.
Preliminary processing of the CCD frames was done with the standard routines in the IRAF-CCDPROC package.111IRAF is distributed by the National Optical Astronomy Observatories, which are operated by the Associations of Universities for Research in Astronomy, Inc., under cooperative agreement with the NSF Photometric variability was determined using two separate techniques: aperture photometry and point-spread function (PSF) fitting. PSF fitting was done using the photometric pipeline of the project DIRECT (Kaluzny et al. 1998; Stanek et al. 1998), based on the Daophot/Allstar photometry package (Stetson 1987, 1991). The differential light curves obtained by both methods agreed well, which was reassuring considering that the HH30 nebulosity is somewhat resolved in our images. As a further check, we saw no correlation between the derived photometric changes and the seeing or sky brightness.
The resulting differential light curves are shown in Figure 1 and are adjusted so the faintest measurement in each band corresponds to mag. The HH30 nebulosity was observed to vary in brightness over timescales of a few days by mag, mag, and mag. The changes in brightness are very well correlated between the three photometric bands. There are hints of periodicity with the rise and fall at the start of our observations and again around HJD 1570 in Figure 1. Independently for each band we searched for periodicity using a variant of the Lafler-Kinman (1965) string-length technique, proposed by Stetson (1996) and also the Lomb (1976) normalized periodogram method. The strongest signals in our periodogram techniques were found at 19.8 days (97% probability) and 11.6 days (95% probability). An 11.6 day period is more typical of T Tauri stars and further monitoring of HH30 will possibly yield a more reliable period. We emphasize that this period detection is very tentative given the present data, and we encourage follow-up observations to confirm or refute our finding.
Photometric variability in excess of 2 mags may be obtained by hot spots on the stellar surface (e.g., Mahdavi & Kenyon 1998). Hot spots produce larger photometric variability at shorter wavelengths due to the increased spot/star luminosity ratio. Our observations show that , but . The apparent inconsistency of the band variability may be attributed to contamination from strong H and [S ii] emission associated with HH30’s jet (Burrows et al. 1996). Bouvier et al. (1999) discounted a hotspot model for AA Tau because they did not detect any color variations ( mag in all bands). Our HH30 data do show color variations and in the next section we investigate hot spot models for HH30 and restrict our simulations to the and bands due to the likely contamination of the band observations by jet emission.
3. Models
The large variability we observe may occur for a model with two diametrically opposed hot spots when the second spot is occulted (either by the star or the circumstellar disk) and the observed spot is seen directly at maximum light and is obscured by the star at minimum light. However, for the high inclination of HH30 (, Burrows et al. 1996) we only see a scattered light nebula and do not see the star directly. For a model with two diametrically opposed hot spots, we found that at high inclinations the photometric variability was only around 0.2 mag (Wood & Whitney 1998). As one spot rotates behind the star, the second spot rotates to the front yielding the small amplitude variability. In addition, because we are only detecting scattered light we always see some reflected light from the hot spots yielding small variations in the total intensity.
The fact that we are viewing scattered light makes it impossible for us to apply inversion techniques to determine spot parameters (e.g., Bouvier et al. 1993; Vrba, Herbst, & Booth 1988), since the light curves are sensitive not only to the star and spot parameters, but also the disk structure and circumstellar dust properties. The new WFPC2 observations presented by Stapelfeldt et al. (1999a) and the large variability present in Figure 1 suggests that one hot spot dominates the nebular and photometric variability. We now construct single hot spot models for HH30.
HH30 has been modeled by Burrows et al. (1996) and Wood et al. (1998) with a flared disk geometry,
| (1) |
where is the radial coordinate in the disk midplane and the scale height increases with radius, . Following Burrows et al. (1996) and Wood et al. (1998) we adopt: , , (giving AU), and a disk mass of . We construct scattered light models using our Monte Carlo radiation transfer code (Whitney & Hartmann 1992; Wood & Whitney 1998; Stassun & Wood 1999) and assume there is one circular hot spot of radius at latitude on the stellar surface. The relative number of photons released from the spot and star is,
| (2) |
where we assume that the luminosities of the star and spot are Planck functions at the spot () and stellar () temperatures.
Figure 2 shows the simulated and band photometric variability for , , K, K (Wood & Whitney 1998; Stapelfeldt et al. 1999). We assumed that the circumstellar dust can be characterized by a Kim, Martin, & Hendry (1994, hereafter KMH) size distribution, typical of grains in the interstellar medium. For KMH grains the and band dust parameters (opacity, albedo, peak polarization, and asymmetry parameter in the Heyney-Greenstein scattering phase function) are displayed in Table 1.
Viewing this model at low inclinations we can easily obtain mag. However at , we cannot reproduce the observed large amplitude variability — we only see scattered light and always detect reflected light from the hot spot, irrespective of rotational phase. Therefore the amplitude of variability is smaller ( mag, mag) than when we see the star directly. One way of increasing the variability is to change the spot size and temperature. Alternatively, if the forward beaming of the scattered light is increased (increasing the asymmetry parameter, ), we will see less scattered light from the spot at minimum light when it is occulted by the star. Such an increase in the asymmetry parameter, indicative of large grains in the disk, was found by Burrows et al. (1996). Other modeling efforts have also found evidence for larger, more forward throwing grains in protostellar environments (e.g., Lucas & Roche 1998). We have therefore constructed models with larger, more forward throwing grains (see parameters in Table 1). This population of grains was used by Cotera et al. (2000) and Whitney & Wolff (2000) to model multiwavelength HST images of HH30. The dust grains are homogeneous spheres composed of either amorphous carbon (BE1, Rouleau & Martin 1991) or revised astronomical silicate (Weingartner & Draine 2000). The size distribution for each component is specified using a power-law with exponential decay (i.e., ) with a cross-section weighted average radius (summed over both components) of 0.092 µm. The relative numbers of each grain type are such that the dust completely consumes slightly “super-solar” abundances in carbon and silicate: 400 ppm for C/H and 40 ppm for Si/H. We refer the reader to Whitney & Wolff (2000) for a more detailed discussion of the dust model.
With the larger grains the amplitude of the variability is unaffected at low inclinations because the direct starlight is much brighter than the scattered light. For , we found larger variability (mag, mag) than for the simulation using KMH grains due to the increased beaming of the scattered light by the forward throwing grains.
Increasing the phase function asymmetry through larger grains increases the photometric variability, but it is still less than observed. Therefore, we have investigated other models which have larger spot/star luminosity ratios and different spot parameters. Figure 3 shows a simulation in which we obtain mags and mags, in agreement with our observations. This simulation has K, K, , and . We can obtain the same amplitude of variability with a model that has K and K. As the central star in the HH30 system is not observed directly, its effective temperature is somewhat uncertain and may be cooler than the K, M0 spectral type determined by Kenyon et al. (1998). The large spot/star luminosity, required to match our observations, could result in considerable veiling allowing for a later spectral type (see Kenyon et al. 1998). The spot size and latitude may be constrained through detailed modeling of time series images of the scattered light disk (Stapelfeldt, et al. 1999a).
4. Summary
We have presented photometric observations of HH30 that show it is highly variable over timescales of a few days ( mags, mags, mags), with hints of periodicity at 11.6 or 19.8 days. This contrasts with the recent work of Stapelfeldt et al. (1999b) whose HST observations suggest a characteristic timescale on the order of 15 years, possibly related to inhomogeneities in the disk. The much shorter timescale variability in our data indicates a stellar origin for the photometric variability we observe. High resolution imaging is required to determine whether the variability we observe is related to the morphological variations in the scattered light images.
Comparing our findings to classical T Tauri stars, HH30’s variability is among the largest yet reported. We have modeled the variability in the context of the magnetospheric accretion model with a single hot spot on the stellar surface. The large variability requires a large spot/star luminosity ratio and that the circumstellar grains are larger and more forward throwing than interstellar grains. Variability due to accretion hot spots is often stochastic (e.g., Herbst et al. 1994) and while our modeling has adopted a single stable hotspot, further observations are required to better sample the lightcurve and determine changes in the spot sizes and temperatures. Our modeling of the circumstellar dust is consistent with many other studies that are providing evidence for grain growth in dense environments of T Tauri stars.
While our observations and modeling support the magnetic accretion hypothesis for HH30, alternative sources of the variability may be orbiting dust clouds, inhomogeneities in the disk structure close to the star, a binary star, and stellar flares. Further monitoring of HH30 with sampling on the order of days will yield further insight into this system. If the variability is due to magnetic accretion there will be specific time sequence variations of the phometry, polarimetry, and morphology of the scattered light disk due to illumination by hot spots. Even if the accretion is stochastic there will be specific correlations between the photometry and polarimetry (Stassun & Wood 1999, Fig. 7). Rotational modulation will manifest itself in high resolution imaging studies through asymmetric brightening of scattered light images (Wood & Whitney 1998; Stapelfeldt et al. 1999a). Lower resolution imaging should still be able to detect the asymmetric brightening via shifting of the photometric centroid of the system as pointed out by Stapelfeldt et al. (1999a).
Acknowledgements.
We thank Scott Kenyon for discussions relating to this project and the following people who helped us in obtaining observations of HH30 at FLWO: Pauline Barmby, Ann Bragg, Paul Green, Saurabh Jha, Amy Mossman, Jose Munoz, and Rudy Schild. The referee, Bill Herbst, provided comments and suggestions that have improved this paper. We acknowledge financial support from NASA’s Long Term Space Astrophysics Research Program, NAG5 6039 (KW), NAG5 8412 (BW); the National Science Foundation, AST 9909966 (BW and KW); the HST Archival Research Program AR-08367.01-97A, (BW, KW, KS); and NASA contract NAS8-39073 (SJW). Support for KZS was provided by NASA through Hubble Fellowship grant HF-01124.01-99A from the Space Telescope Science Institute, which is operated by the Association of Universities for Research in Astronomy, Inc., under NASA contract NAS5-26555.References
- (1) Attridge, J. M., & Herbst, W. 1992, ApJ, 398, L61
- (2) Bouvier, J., et al. 1999, A&A, 349, 619
- (3) Bouvier, J., Cabrit, S., Fernandez, M., Martin, E. L., & Matthews, J. M. 1993, A&A, 61, 737
- (4) Burrows, C.J., et al. 1996, ApJ, 473, 437
- (5) Choi, P. I., & Herbst, W. 1996, AJ, 111, 283
- (6) Cotera, A., et al. 2000, in preparation
- (7) Edwards, S., et al. 1993, AJ, 106, 372
- (8) Ghosh, P., & Lamb, F. K. 1979a, ApJ, 232, 259
- (9) Ghosh, P., & Lamb, F. K. 1979b, ApJ, 234, 296
- (10) Hatzes, A. P. 1995, ApJ, 451, 784
- (11) Herbst, W., Herbst, D. K., Grossman, E. J., & Weinstein, D. 1994, AJ, 108, 1906
- (12) Herbst, W., Rhode, K. L., Hillenbrand, L. A., & Curran, G. 2000, AJ, 119, 261
- (13) Kaluzny, J., Stanek, K. Z., Krockenberger, M., Sasselov, D. D., Tonry, J. L., & Mateo, M. 1998, AJ, 115, 1016
- (14) Kenyon, S. J., et al. 1994, AJ, 107, 2153
- (15) Kenyon, S.J., Brown, D.I., Tout, C.A., & Berlind, P. 1998, AJ, 115, 2419
- (16) Kim, S.H., Martin, P.G., & Hendry, P.D. 1994, ApJ, 422, 164
- (17) Königl, A. 1991, ApJ, 370, L39
- (18) Lafler, J., & Kinman, T. D. 1965, ApJS, 11, 216
- (19) Lomb, N.R. 1976, Ap&SS, 39, 447
- (20) Lucas, P.W., & Roche, P.F. 1998, MNRAS, 299, 699
- (21) Mahdavi, A., & Kenyon, S. J. 1998, ApJ, 497, 342
- (22) Makidon, R. B., et al. 1997, BAAS, 191, 5.06
- (23) Mundt, R., & Fried, J.W. 1983, ApJ, 274, 83
- (24) Najita, J. 1995, RevMexAA, 1, 293
- (25) Ostriker, E. C., & Shu, F. H. 1995, ApJ, 447, 813
- (26) Rouleau, F., & Martin, P.G. 1991, APJ, 377, 526
- (27) Shu, F. H., Najita, J., Ostriker, E. C., Wilkin, F., Ruden, S., & Lizano, S. 1994, ApJ, 429, 781
- (28) Stanek, K. Z., Kaluzny, J., Krockenberger, M., Sasselov, D. D., Tonry, J. L., & Mateo, M. 1998, AJ, 115, 1894
- (29) Stapelfeldt, K.R., et al. 1999a, ApJ, 516, L95
- (30) Stapelfeldt, K.R., Watson, A.M., Krist, J.E., & Burrows, C.J. 1999b, BAAS, 195, 02.02
- (31) Stassun, K., Mathieu, R.D., Mazeh, T., & Vrba, F.J. 1999, AJ, 117, 2941
- (32) Stassun, K., & Wood, K. 1999, ApJ, 510, 892
- (33) Stetson, P.B. 1987, PASP, 99, 191
- (34) Stetson, P.B 1991, in “Astrophysical Data Analysis Software and Systems I”, ASP Conf. Ser. Vol. 25, eds. D.M. Worrall, C. Bimesderfer, & J. Barnes, 297
- (35) Stetson, P. B., 1996, PASP, 108, 851
- (36) Szentgyorgyi, A. H., et al. 2000, in preparation
- (37) Vrba, F.J., Herbst, W., & Booth, J.F. 1988, AJ, 96, 1032
- (38) Weingartner, J.C., & Draine, B.T. 2000, ApJ submitted, astro-ph/9907251
- (39) Whitney, B. A., & Wolff, M.J. 2000, in preparation
- (40) Whitney, B. A., & Hartmann, L. 1992, ApJ, 395, 529
- (41) Wichmann, R., Bouvier, J., Allain, S., & Krautter, J. 1998, A&A, 330, 521
- (42) Wood, K., & Whitney, B.A. 1998, ApJ, 506, L43
- (43) Wood, K., Kenyon, S. J., Whitney, B. A., & Turnbull, M. 1998, ApJ, 497, 404
- (44) Wood, K., Kenyon, S. J., Whitney, B. A., & Bjorkman, J.E. 1996, ApJ, 458, L79
| Wave Band | (cm2/g) | |||
|---|---|---|---|---|
| (KMH) | 220 | 0.54 | 0.44 | 0.43 |
| (KMH) | 105 | 0.49 | 0.29 | 0.70 |
| (Large) | 174 | 0.47 | 0.61 | 0.38 |
| (Large) | 134 | 0.49 | 0.58 | 0.34 |