Cosmological Studies from Radio Source Samples
Abstract
I review some recent cosmological studies based on redshift surveys of radio sources selected at low frequencies. The accretion rate onto the central black hole is identified as the basis of a crude physical division of the low-frequency population into two sub-populations: the first comprises ‘Eddington-tuned’ (high accretion rate) quasars and their torus-hidden counterparts; the second comprises ‘starved quasars’ like M87. There exist remarkable similarities between the shapes and evolutionary behaviours of the luminosity functions of radio sources and radio-quiet quasars; all luminous AGN are times rarer at epochs corresponding to than at . I argue that any evidence that quasars were intrinsically rarer at than at is as yet both tentative and indirect. A simple calculation suggests that the radio source population has been over-looked as a potentially important contributor to the entropy budget of the Universe. A recent sub-mm survey of radio sources is used to demonstrate a connection between the events which trigger jets and intense bursts of star formation, and a close link between the histories of star formation and AGN activity is proposed. I discuss the aims and methods of future large redshift surveys of radio sources, emphasising the importance of dovetailing these with the development of robust physical models for radio sources and their epoch-dependent environments.
University of Oxford, Astrophysics, Keble Road, Oxford, OX1 3RH, UK
1. Redshift surveys of low-frequency radio sources
We were all excited at this meeting by the prospect of the GMRT pushing low-frequency astronomy to sensitivities significantly below those of the previous generation of surveys: e.g. the detection levels of 151 MHz flux density reached by the Cambridge 7C survey (e.g. McGilchrist et al. 1990). Nevertheless, the next generation of low-frequency continuum surveys will continue to be dominated by extragalactic sources whose large radio luminosities come ultimately from energy-releasing processes associated with super-massive black holes. In this sense most of the sources in a GMRT survey will not be so different from those in the 3CRR survey and, as we have recently been reminded by Longair (1999), these sources have been studied for nearly forty years. So, what new things can we learn from low-frequency radio surveys deeper than 3CRR? As a partial answer to this question I will develop two themes illustrated by the increased coverage of the 151 MHz luminosity111Throughout this paper I take , and ; radio spectral index, , is defined by , where is the flux-density at frequency ; and radio and optical narrow-line/bolometric luminosities are measured in units of and W respectively. , redshift plane (Fig. 1) provided by recently completed redshift surveys of radio sources.
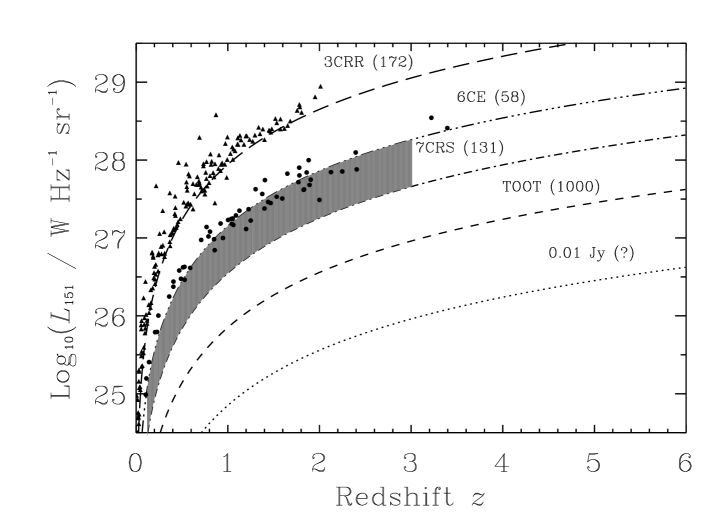
The first theme concerns the demography of the low-frequency radio population. The tight distribution of the 3CRR points on Fig. 1 results from the conspiracy of three features of the radio luminosity function (RLF) — the density of radio sources per unit co-moving volume and per unit logarithm of radio luminosity — namely: (i) the points hug the locus of the 3CRR limit because at any given , the RLF is a steeply declining function of ; and (ii) the points are fairly uniformally distributed along this locus because out to both the normalisation of the RLF and the observable co-moving volume are steeply increasing functions of . A corollary of these features is that the RLF is well determined close to the locus of the limit but estimates elsewhere in the – plane require extrapolations of what is clearly a rapidly varying function (although data like the low-frequency radio source counts provide additional constraints). Constraining the RLF at regions of the – plane corresponding to higher aerial densities of radio sources (e.g. the 7C Redshift Survey, 7CRS, region of Fig. 1) is essential for many studies which utilise radio sources as cosmological probes: e.g. gravitational lensing studies which constrain cosmic geometry (e.g. Kochanek 1996) and clustering studies which map out large-scale structure (e.g. Magliocchetti et al. 1998).
Of more direct concern to us here is the ability to understand the RLF in terms of physical models for radio sources and their cosmic evolution. Ignoring for now any variations in radio source environment, what we would really like to measure is the density , where is the jet power (Scheuer 1974; Rawlings & Saunders 1991), and is the source age, the time after the jet-triggering event. From it is possible to calculate physically meaningful quantities like the birth function – the number of jets triggered per co-moving volume per unit cosmic time — and the total entropy injected into the intracluster medium (ICM) by the radio source population. Successful mapping between the ‘physical’ density and the ‘observable’ density (and hence, by marginalising the projected radio source size , ) requires both a good physical model and samples providing adequate coverage of Fig. 1. Inadequate coverage leads to unbreakable degeneracies between the key parameters: Blundell & Rawlings (1999) have recently emphasised one such effect which means that the known highest- radio galaxies are biased towards objects with extremely high and relatively small , some complicating effects of which will be discussed in Sec. 5.
This introduces the second important theme illustrated by Fig. 1 – the use of radio sources as probes of the very high redshift Universe. The highest redshift object in the 3CRR sample is at . The lack of higher- 3CRR objects is not due to an abrupt high- cut-off in the RLF, but due instead to the intrinsic rarity of radio sources with the extreme radio luminosities [] required to exceed the limit of 3CRR at high redshift. At a given redshift the finite (co-moving) volume on our light cone depends only on the assumed cosmological model, and since the 3CRR survey covers a good fraction of the entire sky, the only way of finding significant numbers of higher- radio sources is by studying objects with luminosities similar to those of the 3CRR objects. This requires spectroscopic surveys of fainter radio-selected samples; the Oxford-led 6CE and 7CRS redshift surveys (see Fig. 1) have demonstrated that one can achieve close to redshift completenesses for such surveys using 4-m class optical telescopes. This has allowed the construction of sizeable and complete samples of radio sources from follow-up of fairly small sky areas.
2. Sub-populations of low-frequency radio sources
The traditional way of dividing the low-frequency radio population into two distinct sub-populations is via the Fanaroff & Riley (1974) scheme based on radio structure: crudely, FRII galaxies have jet-terminating compact hotspots at their outer extremities, whilst FRI galaxies do not. Fanaroff & Riley showed that this FRI/FRII structural division corresponds closely to a division in radio luminosity at although more recent studies (Ledlow & Owen 1996) have suggested an additional dependence on host galaxy luminosity. However, following Hine & Longair (1979) and Laing et al. (1994), there is another, arguably more fundamental, way of dividing the population into two classes. I will adopt two underlying assumptions: (i) that all radio galaxies harbour super-massive () black holes with a low spread in black hole mass (see Willott et al. 1999), and (ii) that higher accretion rates onto the black hole boosts: (a) the quasar optical luminosity, and hence the narrow emission line luminosity; and (b) the jet power, and hence the radio luminosity (Rawlings & Saunders 1991; Serjeant et al. 1998). I will neglect the effects of scatter in correlations between and, for example, the [OII] emission line luminosity (e.g. Baum & Heckman 1989; Willott et al. 1999).
Above [or ], the ‘quasar fraction’ – the fraction of objects with observed broad emission lines – is regardless of luminosity or redshift, a result which is consistent with a simple unified scheme in which each object has an obscuring torus with a half-opening angle (Willott et al. 2000b). In other words this appears to be a homogeneous ‘Eddington-tuned’ sub-population comprising objects whose black holes are accreting at some sizeable and roughly fixed fraction of their Eddington-limited rates, and whose nuclei have well-developed obscuring tori.
Below [or ], the quasar fraction drops abruptly, and a second sub-population dominates. The archetype of this sub-population is the nearby FRI radio galaxy M87 which seems certain to contain a super-massive black hole accreting at a tiny () fraction of its Eddington-limited rate (e.g. Ford et al. 1994). Chiaberge, Capetti & Celotti (1999) discuss how the seemingly clear view of optical synchrotron from the base of the M87 jet argues against the existence of an obscuring torus in this radio galaxy.
Because the break between these ‘starved quasar’ sources and the Eddington-tuned population lies about one dex higher in than the FRI/FRII division, there are starved quasars with both FRI and FRII radio structure, whereas the Eddington-tuned sources are almost exclusively FRIIs. The existence of FRIIs lacking an intrinsically bright quasar nucleus is supported by cases in which narrow emission lines are either weak or absent (Laing et al. 1994), and, as for M87, the detection of optical synchrotron from some FRII nuclei rules out some types of obscuring tori in some FRII objects (Chiaberge, Capetti & Celotti 2000).
Being based on accretion rate, the division proposed here is much more intimately tied to physical processes near the black hole than the FRI/FRII divide which is likely to be a larger-scale magnetohydrodynamical effect driven by the dependence of the stability of jets on jet power and environment (e.g. Kaiser & Alexander 1997). Since Eddington-tuned radio sources always contain powerful, and hence stable, jets it is no surprise that they almost exclusively develop FRII radio structures. The less powerful jets in ‘starved quasars’ can produce either FRI or FRII radio sources depending on their precise jet power and environment.
The accretion rate based division proposed here is undoubtedly too simplistic: as suggested by Rawlings & Saunders (1991), variations in accretion rate from object-to-object might be a far smoother affair than a clean dichotomy. Indeed, the possibility that the low quasar fraction at low luminosities is due to lower values of for weaker quasar nuclei, rather than the intrinsic lack of such nuclei, has received support from the recent evidence for accretion-disc excited broad lines in the pole-on low-luminosity radio source BL Lacertae (Corbett et al. 2000). However, as as we shall see in Sec. 3, the two sub-population hypothesis proposed here provides a simple luminosity-dependent density evolution (LDDE) model on which to base our first stabs at mapping and understanding the cosmic evolution of the radio source population.
3. Cosmic evolution between and


Willott et al. (2000c) have used the 3CRR, 6CE and 7CRS datasets illustrated in Fig. 1 (alongside other pertinent data like the low-frequency radio source counts) to constrain parametric models for the cosmic evolution of the RLF; these models were built on the assumption that the two sub-populations described in Sec. 2 undergo differential density evolution. They found that the integrated co-moving number density of the Eddington-tuned sources rises by about 2.5 dex between and , and that the of the starved quasar sub-population rises by about 1 dex between and . The superposition of these sub-populations produces an overall steep-spectrum RLF in fair agreement with a previous determination based on high-frequency (2.7 GHz) selected samples (Dunlop & Peacock 1990). The ‘break luminosity’ in the overall RLF is the swap-over point between the two sub-populations. Because these sub-populations undergo differential density evolution, the break point moves with redshift in a way which is similar to the ‘pure luminosity evolution’ (PLE) model fitted by Dunlop & Peacock to their data. The Willott et al. LDDE model is more attractive than a PLE model because it is hard to see how the latter can provide a physical description of evolution given that the ages of FRII radio sources are known (e.g. Blundell & Rawlings 2000) to be a tiny fraction of the Hubble time.
I have chosen to illustrate these results in a way (Fig. 2) which emphasises some remarkable similarities between the evolution of the radio population, and quasars in general. First, the shapes of the radio and X-ray luminosity functions are almost identical, and it is interesting in this regard that the most recent estimates of the X-ray luminosity function (Miyaji, Hasinger & Schmidt 2000) prefer LDDE to PLE models. Second, the evolutions with redshift are very similar. We may soon become persuaded of a third similarity related to the luminosity-dependent obscuration of the quasar population. Studies of the RLF (Willott et al. 2000b) show that the fraction of objects with observed broad lines rises from at (the Eddington-limit of a black hole) to at high luminosities. For the X-ray population at , the fraction of naked quasars can only be since the hard X-ray background is dominated by a photoelectrically-absorbed, but Compton-thin population (e.g. Wilman & Fabian 1999). Follow-up of Chandra surveys should confirm whether or not the fraction of naked quasars rises with luminosity, as is the case for the radio population, and as is predicted by the popular ‘receding-torus’ model (Lawrence 1991). First results from Chandra (e.g. Mushotzky et al. 2000; Crawford et al. 2000) suggest that it may well prove just as difficult to measure redshifts for the X-ray selected ‘quasar IIs’ as has proved the case for their radio-loud counterparts in the 7CRS (Willott, Rawlings & Blundell 2000a): nuclear obscuration means that quasar IIs can masquerade as extremely-red galaxies with only weak observable narrow emission lines in the near-IR, especially in the key redshift range.
One open question concerns the size of any Compton-thick population of AGN. High-energy X-ray studies of local AGN (e.g. Maiolino et al. 1995) suggest that, at least at low values of , most nuclei are obscured by Compton-thick material, so the normalisation of the quasar luminosity function in Fig. 2 is still strictly only a lower limit. Chandra follow-up of AGN selected at low radio frequencies might prove vital here since the large radio emitting lobes should be unobscured, allowing direct measurement of the distribution in obscuring column densities for a randomly-oriented population of quasars.
Fig. 2 also illustrates the key remaining challenge for understanding the quasar population: why are there seemingly times more radio-quiet quasars than radio-loud quasars222 This 100:1 ratio of radio-quiet to radio-loud objects is somewhat higher than most other estimates in the literature (e.g. Goldschmidt et al. 1999). The main reasons for this are associated with the effects of Doppler boosting. First, both the optical and (high-frequency) radio emissions from an intrinsically radio-loud object can be boosted such that more common (but intrinsically lower ) objects are preferentially promoted into an optically-selected sample of quasars if they have powerful relativistic jets. Second, low-power relativistic jets seem common amongst the radio-quiet population (e.g. Miller, Rawlings & Saunders 1993); when aligned with the line-of-sight, these jets produce sufficient radio emission that they can be designated as ‘radio-loud’ despite the absence of an intrinsically powerful jet. ? The most naïve explanation – that ‘radio-quiet’ phases of quasar activity last times longer than ‘radio-loud’ phases – is not really tenable. Since jet-fed powerful radio sources persist alongside nuclear optical/X-ray quasar activity for timescales of years (e.g. Blundell, Rawlings & Willott 1999; Blundell & Rawlings 2000), then any such radio-quiet phase would need to last Gyr, leading to just one generation of quasars and a well-known problem explaining the mass density of super-massive black holes in the local Universe (e.g. Richstone et al. 1998). The cosmic evolutions of the radio-loud and radio-quiet populations (Fig. 2) seem to be driven by a common cosmic cause, presumably -yr timescale variations in the trigger rate convolved with shorter-timescale ( yr) effects due to finite quasar lifetimes.
A more likely explanation for the large fraction of radio-quiet to radio-loud objects follows from the invocation of a minimum black hole mass for the development of powerful jets. Consider a toy model in which quasars divide cleanly between radio-quiet quasars and radio-loud quasars at a critical black hole mass : because of the steepness of the mass function for black holes (e.g. Salucci et al. 1999), for every radio-loud quasar there would be a factor -times more radio-quiet quasars with black hole masses in the range . Thus, a spread of only dex in the ratio of would cause the radio-quiet quasars to swamp radio-loud quasars even at the highest values of (see also McLure et al. 1999). There is some indirect support for the central idea here – that, compared to radio-quiet quasars, the distribution in for radio-loud quasars has a high mean and a low variance – from the normalisation and spread in the near-infrared Hubble diagram for radio galaxies (e.g. Eales et al. 1997). Although it seems hard to envisage a critical physical switch allowing powerful jet activity only at , it may appear to be present because of the special formation history of the most massive black holes. As explored by Wilson & Corbett (1995), the major merger of two massive dark haloes containing central black holes could result in the formation of a single super-massive spinning black hole — the preferred origin for powerful jets via the Blandford-Znajek mechanism (1977) — as well as the formation of the core of a luminous elliptical galaxy via heating associated with the orbital decay of the binary black hole system (Faber et al. 1997).
Whatever the underlying physics, the evolutionary consequence of the normalisations of the luminosity functions of Fig. 2 and quasar lifetimes is that every massive () galaxy was plausibly a quasar at high redshift (e.g. Richstone et al. 1998), and that in 100 of such galaxies spent time as a powerful radio source. The present-day (co-moving) space density of the sites of past Eddington-tuned jet activity is given roughly by the density at times the ratio of the duration of ‘the quasar epoch’ (see Sec. 4) to the duration of a radio source outburst, or which turns out to be precisely the space density of rich clusters (Dalton et al. 1994). Plausibly, therefore, every rich cluster of galaxies was once the site of extreme radio activity.
4. Cosmic evolution at : the redshift cut-off

The results of Sec. 3 beg the question of constraints on the evolution of the radio source population at high redshift, i.e. at . I will focus my attention on the Eddington-tuned population since, as is obvious from Fig. 1, the lower-luminosity population is not detectable at high redshifts in bright radio-selected samples. My contention here is that, even though many radio-luminous objects have now been observed in the Universe, constraints on their space density remain very loose. Since these points are discussed in detail elsewhere (Jarvis & Rawlings 2000; Jarvis et al. 2000; Willott et al. 2000c), I will simply summarise my view of the current situation.
-
•
Direct studies of the steep-spectrum population at based on redshift surveys of complete samples (Willott et al. 2000c) do not allow us to discriminate between models in which the of radio sources declines at high redshift from those in which it stays constant. This is a subtly different conclusion to that reached by Dunlop & Peacock (1990), and the possible reasons for this difference are discussed by Willott et al. (2000c).
-
•
Through finding steep-spectrum radio galaxies at (e.g. Rawlings et al. 1996), direct studies of the population using ‘filtered’333 A filtered sample is one in which optical spectroscopic follow-up is confined to a small fraction of the radio sources in a flux-density limited sample, where the filters used by current surveys are a (steep) spectral index criterion and/or a (small) angular size criterion (e.g. Blundell et al. 1998). samples suggest roughly constant from to , although gradual declines or even inclines cannot be ruled out (Jarvis et al. 2000).
-
•
Indirect444 Eddington-tuned jets pointed within a few degrees of the line-of-sight are Doppler-boosted to produce flat-spectrum radio quasars; these are thought to be the dominant flat-spectrum population in high-frequency selected radio samples [although see Jarvis & Rawlings (2000) for a discussion of the importance of GHz-Peaked sources]. The apparent space density of these flat-spectrum sources gives an indirect measure of the space density of the parent steep-spectrum population close to, but above, the break in the RLF (Jarvis & Rawlings 2000). evidence for a high- cut-off in from the study of luminous flat-spectrum radio quasars is more equivocal than received wisdom might suggest. Gradual declines in the space density of the most luminous flat-spectrum quasars, by a factor between and (Dunlop & Peacock 1990), are favoured by the data but the observable co-moving volume is too small to make definitive statements: both constant space density models and abrupt cut-offs, like those suggested by Shaver et al. (1996), are ruled out only at the level (Jarvis & Rawlings 2000).
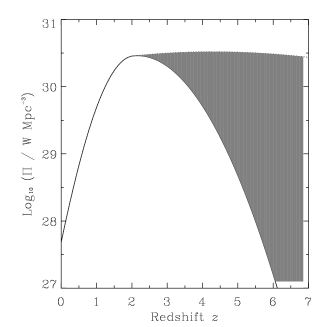
This state of ignorance concerning the high- evolution of radio sources is illustrated in Fig. 3. It is worth noting that it is not clear that any other published measures of the high- evolution of quasars are any better constrained, largely because of the difficulty of correcting for obscuration in optical/soft X-ray selected samples. In fact the abrupt cut-off found by optical quasar surveys (e.g. Warren, Hewett & Osmer 1994) and the roughly constant space densities found by X-ray surveys (e.g. Miyaji et al. 2000) are together suggestive of obscuration: as a spectrum becomes increasingly redshifted, attenuation of optical light becomes more effective due to the increased efficiency of dust obscuration at UV wavelengths, whereas the opposite is true for the effects of redshifting on the opacity at X-ray wavelengths (e.g. Wilman & Fabian 1999).
A large number of programmes are compromised by ignorance concerning the redshift cut-off, including basic questions like: (i) whether or not the onset of quasar activity re-ionized the Universe (e.g. Haiman & Loeb 1997); (ii) understanding the nature of the sub-mm source counts (e.g. Almaini, Lawrence & Boyle 1999); and (iii) using the density of high- objects to constrain the power spectrum of density fluctuations on Mpc scales (e.g. Efstathiou & Rees 1988).
I concentrate here, however, on an important physical parameter connected directly to the high- evolution in radio luminosity density — the contribution of Eddington-tuned radio sources to the entropy budget of the Universe. The results of a rough calculation are shown in Fig. 3. The key point is that although the radio source phenomenon is times rarer than the quasar phenomenon, the relativistic jets feeding radio sources have bulk powers which are of the same order as the Eddington luminosity of a black hole (Rawlings & Saunders 1991; Willott et al. 1999; Blundell & Rawlings 2000), and times more powerful than the relativistic jets in luminous radio-quiet quasars (Miller, Rawlings & Saunders 1993). So, provided that the power in quasar winds is (Silk & Rees 1998) and provided one can neglect photoionisation heating (Valageas & Silk 2000), it seems plausible that more power is available to heat the IGM as the result of radio source induced shocks, than is yielded by the more numerous radio-quiet quasar population. This heat, or entropy, input into the IGM will be concentrated in the clusters of galaxies which at one time hosted powerful radio sources. For the cut-off model in Fig. 3, the duration of the quasar epoch is and a crude estimate of the heat input into each rich cluster by Eddington-tuned radio sources is . This is a reasonable fraction of the total thermal energy () in a rich ( in baryons) cluster. For the no-cutoff model of Fig. 3, the quasar epoch lasts longer, and the heat input approaches per cent of the total thermal energy in rich clusters. Understanding Fig. 3 is therefore likely to be central to any understanding of the entropy budget of the Universe. At earlier cosmic times the heat input by radio sources was probably sufficient to overcome the gravitational binding energy of gas in the relatively shallow potential wells of forming clusters; this would provide an attractive alternative to supernova- and quasar-driven mechanisms invoked to explain the ‘excess’ entropy (over and above that due to shock heating during cluster collapse) identified by studies of the properties of rich clusters (e.g. Kaiser 1991). In essence I am suggesting a feedback mechanism similar to the quasar-driven wind model invoked for galaxy formation by Silk & Rees (1998) but applicable to more massive systems, i.e. rich clusters, and to more powerful outflows, i.e. radio source driven bow shocks.
5. The sub-mm view of the cosmic evolution of radio sources


The strong cosmic evolution of the Eddington-tuned quasar population discussed in Sec. 3 is most likely the simple and direct consequence of the standard hierarchical model for galaxy formation in which major mergers of galaxy-sized sub-clumps are more prevalent in the younger Universe. A prediction of this hypothesis is that the Eddington-tuned radio population is associated with sites of intense star formation since, at high , a large fraction of the baryons in the sub-clumps are likely to be in the form of gas rather than stars (e.g. Storrie-Lombardi, McMahon & Irwin 1996). The observed properties of high- radio sources should show signs of this. Although UV and optical observations have now provided at least one compelling example of a huge starburst associated with a high- radio galaxy (Dey et al. 1997), it has proved impossible to prove the ubiquity of the starburst phenomenon from UV/optical/near-IR, or indeed radio, observations because any starburst signature can be so easily swamped by emission intimately associated with the active nucleus, e.g. in the case of UV observations, scattered light from the quasar nucleus. A far cleaner diagnostic of large rates of star formation in radio galaxies is a huge rest-frame far-infrared luminosity555 Photometric measurements on the Rayleigh-Jeans side of a thermal spectrum can be used to confirm that the emission is due to dust (which for radio galaxies it almost always is) and provide good estimates of dust mass which, in well-studied objects, correlates closely with gas mass (e.g. Hughes, Dunlop & Rawlings 1997). Since it is often difficult to prove beyond doubt that the dust is heated by stars rather than an active nucleus (e.g. Willott, Rawlings & Jarvis 2000e), the correlation between dust/gas mass and star formation rate is more uncertain. , requiring a survey of high- radio galaxies in the sub-mm waveband. The advent of the SCUBA camera on the JCMT has recently made such a survey possible. Full details of this work are published elsewhere (Archibald et al. 2000), so I concentrate here on the major results and their implications.
Fig. 4 shows how the chances of making a sub-mm detection of a radio galaxy varies across the – plane. Considering and , we see that all the radio galaxies are detected by SCUBA, whereas at lower redshifts and the fraction of detections falls abruptly to per cent. Archibald et al. make a detailed study of the underlying correlations between rest-frame far-IR luminosity , and . They conclude that the major effect at work is an rise in for radio galaxies out to . The most straightforward interpretation of this result is that the characteristic star formation rate (SFR) of luminous radio galaxies rises from at to at , an interpretation which seems to fit in naturally with the arguments made in Sec. 3. If the strong cosmic evolution in for the Eddington-tuned radio population is indeed driven by systematic changes in the trigger rate with then the most viable trigger mechanisms, e.g. the formation of a rapidly spinning super-massive black hole in a major merger event, are likely to be far more prevalent at high ; provided, as seems likely, the progenitor galaxies are gas rich, intense associated starbursts seem inevitable.
In Fig.4 I take these arguments to their logical conclusion by deriving rough estimates of the star formation in the Universe associated directly with AGN. It seems that, as noted by Almaini et al. (1999), a large fraction ( per cent) of the star formation in the high- Universe is probably occurring directly alongside quasar activity in the cores of forming galaxies (see also Boyle & Terlovich 1998). Indeed, if we hypothesise that galaxies form in a series of short (less than or of the order of a quasar lifetime666 One of many caveats to my interpretation of Fig. 4 concerns the question of the relative timescales of AGN and star-formation activity. Blundell & Rawlings (1999) have pointed out that selection effects ensure that the known radio galaxies, e.g. those in the SCUBA survey of Archibald et al. (2000), are viewed within yr of the jet-triggering event. If the characteristic timescale of the starburst activity is shorter than the yr timescale of AGN activity, then the ‘youth-redshift degeneracy’ (Blundell & Rawlings 1999) may be an important contributor to the observed ‘cosmic evolution’ in the SFR of powerful radio galaxies (Fig. 4). It is interesting in this regard that one of the youngest 3CRR radio sources at , 3C318, is a SCUBA-detected quasar (Willott et al. 2000e). ), intense () starbursts across the entire quasar epoch (a process which perhaps culminates in the quasar phase) then the important star formation at high redshift goes hand-in-hand with the formation of black holes, and the epoch of major quasar activity. Of course if Compton-thick objects turn out to be the dominant AGN population at high-, then the link between AGN and star formation activity may prove closer still.
The results of this section concerning the history of star formation, and of Sec. 4 concerning the global entropy budget, should provide food for thought for the growing band of researchers using semi-analytic models to explain galaxy formation and evolution (e.g. Somerville & Primack 1999). At present these models take no account of feedback between quasars, their jets and their host galaxies. For observers of high- AGN it is obviously vital to tie down huge and basic uncertainties like the evolutionary behaviour of quasars at .
6. Future prospects: bigger redshift surveys and better modelling
In previous sections we have seen how cosmological studies using low-frequency selected radio sources are compromised by the limitations of the current generation of redshift surveys. With these considerations partly in mind Gary Hill (Texas) and I (Oxford) have begun a programme of TexOx redshift surveys. One aspect of this programme — the TexOx-1000 (or TOOT) survey — is to measure redshifts for a complete sample flux-limited at . The optical/radio/near-IR imaging part of this survey is now almost complete and spectroscopic follow-up began in earnest in January 2000. This programme aims to exploit the complementary capabilities of UK facilities like the ISIS spectrometer on the WHT – the instrumental back-bone of the 6CE and 7CRS programmes – and the LRS spectrometer on the new 9.2-m Hobby-Eberly Telescope. We are already about a quarter-way through the required spectroscopic follow-up, and we anticipate completion of the TOOT survey in mid 2002. As illustrated by Fig. 1, the TOOT survey will be the first to directly measure the space density of objects, and hence the luminosity density of the steep-spectrum population, at .
Still larger redshift surveys may be needed to settle the question of evolution at . A major difficulty of making such surveys is the lack of any multiplex capability at relatively bright flux-density limits. At the limit of the TOOT survey, the average separation of sources on the sky is arcmin so there is still no effective alternative to object-by-object spectroscopic follow-up, particularly as the largest field-of-view multi-object systems tend to compromise one or more of sensitivity and spectral coverage. In the medium-term future, progress can probably best be made by refining photometric-redshift techniques for the radio source population, although the requirement for wide-field capability at near-IR wavelengths means that substantial progress will probably require new initiatives like the planned surveys with VISTA (see Jarvis et al. 2000). In the long-term future, the hope is that redshifts will come for free as facilities like the Square Kilometre Array push radio sensitivities to the level where surveys can routinely detect HI and CO features superimposed on the radio continuum.
As we await the results of bigger redshifts surveys, a high priority is to build better models for the cosmic evolution of the radio source population. This splits into two categories of problem. First, we need to develop robust models for the physical evolution of radio sources: i.e. once a source of a given jet power has been triggered, how does its radio properties (e.g. luminosity, size and spectral index) develop as a function of time, and as a function of the radio source environment? Second, we need to understand systematic changes in radio source environments with , both because of their influence on radio properties, but more importantly so that we can understand how jet trigger rates reflect the build up of structure in the Universe. In the first area, the hiatus following the pioneering work of Scheuer (1974) is now well and truly over (e.g. Kaiser, Dennett-Thorpe & Alexander 1998; Blundell et al. 1999). In the second area, semi-analytic models could provide the way forward, so these must now be developed to incorporate the feedback between AGN, their jets and their environment.
7. Acknowledgments
The Pune meeting was excellent and I would like to thank all those involved in organising it. Much of the work discussed in this paper stems from collaborative research involving the following: Elese Archibald, Katherine Blundell, Steve Croft, Jim Dunlop, Steve Eales, Pamela Gay, Gary Hill, Dave Hughes, Rob Ivison, Matt Jarvis, Mark Lacy and last, but certainly not least, Chris Willott.
References
Almaini, O., Lawrence, A. & Boyle, B. J.,
1999, MNRAS, 305, 59
Archibald, E.N., Dunlop, J.S., Hughes, D.H., Rawlings, S., Eales, S.A. & Ivison R.J., 2000, MNRAS, submitted,
[astro-ph/0002083]
Baum, S.A. & Heckman, T.M., 1989, ApJ, 336, 702
Blandford, R. D. & Znajek, R. L., 1977, MNRAS, 179, 433
Blundell, K.M. & Rawlings, S., 1999, Nature, 399, 330
Blundell, K.M. & Rawlings, S., 2000, AJ, 119, 1111
Blundell, K.M., Rawlings, S., Eales. S.A.,
Taylor, G.B. & Bradley, A.D., 1998, MNRAS, 295, 265
Blundell, K.M., Rawlings, S., Riley J.M.,
Willott, C.J. & Laing, R.A., 2000, New. Astron., to be submitted
Blundell, K.M., Rawlings, S. & Willott, C.J., 1999, AJ,
117, 677
Boyle, B.J. & Terlevich, R.J., 1998, MNRAS, 293, L49
Chiaberge, M., Capetti, A. & Celotti, A., 1999, A&A, 349,
77
Chiaberge, M., Capetti, A. & Celotti, A., 2000, A&A, 355,
873
Corbett, E.A., Robinson, A., Axon, D.J. & Hough, J.H., 2000,
MNRAS, 311, 485
Crawford, C.S., Fabian, A.C., Gandhi, P., Wilman, R.J. &
Johnstone, R.M., 2000, MNRAS, submitted, [astro-ph/0005242]
Dalton G.B., Croft, R.A.C., Efstathiou, G., Sutherland, W.J.,
Maddox, S.J. & Davis, M., 1994, MNRAS, 271, L47
Dey, A., van Breugel, W., Vacca, W.D. &
Antonucci, R., 1997, ApJ, 490, 698
Dunlop, J.S. & Peacock, J.A., 1990, MNRAS, 247, 19
Eales, S., Rawlings, S., Law-Green, D., Cotter, G. &
Lacy, M., 1997, MNRAS, 291, 593
Efstathiou, G. & Rees, M.J., 1988, MNRAS, 230, 5
Elvis, M. et al., 1994, ApJS, 95, 1
Faber S.M. et al., 1997, AJ, 114, 1771
Fanaroff, B.L. & Riley, J.M., 1974, MNRAS, 167, 31P
Ford, H.C. et al., 1994, ApJ, 435L, 27
Gallego, J., Zamorano, J., Aragon-Salamanca, A. &
Rego, M., 1995, ApJ, 455, 1
Goldschmidt, P., Kukula, M. J., Miller, L. & Dunlop, J. S.,
1999, ApJ, 511, 612
Haiman, Z. & Loeb, A., 1997, ApJ, 483, 21
Hine, R.G. & Longair, M.S., 1979, MNRAS, 188, 111
Hughes, D.H., Dunlop, J.S. & Rawlings, S., 1997,
MNRAS, 289, 766
Hughes, D.H. et al., 1998, Nature, 394, 241
Jarvis, M. & Rawlings, S., 2000, MNRAS, in press,
[astro-ph/0006081]
Jarvis, M., Rawlings, S., Willott, C.J., Blundell, K.M.,
Eales, S.A., Lacy, M., 2000, MNRAS, submitted
Kaiser, C. R. & Alexander, P., 1997, MNRAS,
286, 215
Kaiser, C. R., Dennett-Thorpe, J. & Alexander, P.,
1997, MNRAS, 292, 723
Kaiser, N., ApJ, 1991, 383, 104
Kochanek, C.S., 1996, ApJ, 473, 595
Lacy, M., Rawlings, S., Hill, G.J., Bunker, A.J.,
Ridgway, S.E. & Stern, D., 1999, MNRAS, 308, 1096
Laing, R.A., Jenkins, C.R., Wall, J.V. & Unger, S.W., 1994,
in ‘Physics of Active Galactic Nuclei’, ed G. Bicknell,
Proceedings of the Stromlo Centenary Symposium,
Springer-Verlag, Berlin, p201
Laing, R.A., Riley, J.M., & Longair, M.S., 1983, MNRAS, 204, 151
Lawrence, A., 1991, MNRAS, 252, 586
Ledlow, M.J. & Owen, F.N., 1996, AJ, 112, 9
Longair, M.S., 1999, in ‘The Hy-Redshift Universe:
Galaxy Formation and Evolution at High Redshift, eds
A.J. Bunker and W.J.M. van Breugel, A.S.P. Conference Series Vol. 193,
p11
Magliocchetti, M., Maddox, S.J., Lahav, O. & Wall, J.V.,
1998, MNRAS, 300, 257
Maiolino, R., Salvati, M., Bassani, L., Dadina, M., della Ceca, R., Matt, G.,
Risaliti, G. & Zamorani, G., 1998, A&A, 338, 781
McGilchrist, M.M., Baldwin, J.E., Riley, J.M., Titterington,
D.J., Waldram, E.M. & Warner, P.J., 1990, MNRAS, 246, 110
McLure, R. J., Kukula, M. J., Dunlop, J. S., Baum, S. A., O’Dea, C. P. & Hughes, D. H., 1999, MNRAS, 308, 377
Miller, P., Rawlings, S. & Saunders, R., 1993,
MNRAS, 263, 425
Miyaji, T., Hasinger, G. & Schmidt, M.,
2000, A&A, 353, 25
Mushotzky, R. F., Cowie, L. L., Barger, A. J. &
Arnaud, K. A., 2000, Nature, 404, 459
Rawlings, S., Eales, S.A. & Lacy, M., 2000, MNRAS,
submitted
Rawlings, S., Lacy M., Blundell, K.M., Eales, S.A.,
Bunker, A.J. & Garrington, S.T., 1996,
Nature, 383, 502
Rawlings, S. & Saunders, R. 1991, Nature, 349, 138
Richstone, D., et al., 1998, Nature, 395, 14
Salucci, P., Szuszkiewicz, E., Monaco, P. & Danese, L., 1999,
MNRAS, 307, 637
Scheuer, P.A.G., 1974, MNRAS, 166, 513
Serjeant, S., Rawlings, S., Maddox, S.J., Baker, J.C.,
Clements, D., Lacy, M. & Lilje, P.B., 1998, MNRAS, 294, 494
Shaver, P.A., Wall, J.V., Kellermann, K.I., Jackson, C.A. &
Hawkins, M.R.S., 1996, Nature, 384, 439
Silk, J. & Rees, M.J., 1998, A&A, 331, 1
Somerville, R.S. & Primack, J.R., 1999,
MNRAS, 310, 1087
Storrie-Lombardi, L. J., McMahon, R. G. & Irwin, M. J., 1996,
MNRAS, 283, 79
Valageas, P. & Silk, J., 1999, A&A, 350, 725
Warren, S.J., Hewett, P.C. & Osmer, P.S.,
1994, ApJ, 421, 412
Willott, C.J., Rawlings, S. & Blundell, K.M., 2000a,
MNRAS, submitted
Willott, C.J., Rawlings, S., Blundell, K.M. & Lacy M., 1998,
MNRAS, 300, 625
Willott, C.J., Rawlings, S., Blundell, K.M. & Lacy M., 1999,
MNRAS, 309, 1017
Willott, C.J., Rawlings, S., Blundell, K.M. & Lacy M., 2000b,
MNRAS, in press, [astro-ph/0003461]
Willott, C.J., Rawlings, S., Blundell, K.M. & Lacy M., 2000c,
MNRAS, submitted
Willott, C.J., Rawlings, S., Blundell, K.M., Lacy, M., Hill G.J. &
Scott, S., 2000d, MNRAS, to be submitted
Willott, C.J., Rawlings, S. & Jarvis, M., 2000e,
MNRAS, 313, 237
Wilman, R. J. & Fabian, A. C., 1999,
MNRAS, 309, 862
Wilson, A. S. & Colbert, E. J. M., 1995,
ApJ, 438, 62