Convective cores in galactic cooling flows
Abstract
We use hydrodynamic simulations with adaptive grid refinement to study the dependence of hot gas flows in X-ray luminous giant elliptical galaxies on the efficiency of heat supply to the gas. We consider a number of potential heating mechanisms including Type Ia supernovae and sporadic nuclear activity of a central super-massive black hole. As a starting point for this research we use an equilibrium hydrostatic recycling model [1996]. We show that a compact cooling inflow develops, if the heating is slightly insufficient to counterbalance radiative cooling of the hot gas in the central few kiloparsecs. An excessive heating in the centre, instead, drives a convectively unstable outflow. We model the onset of the instability and a quasi-steady convective regime in the core of the galaxy in two-dimensions assuming axial symmetry.
Provided the power of net energy supply in the core is not too high, the convection remains subsonic. The convective pattern is dominated by buoyancy driven large-scale mushroom-like structures. Unlike in the case of a cooling inflow, the X-ray surface brightness of an (on average) isentropic convective core does not display a sharp maximum at the centre. A hybrid model, which combines a subsonic peripheral cooling inflow with an inner convective core, appears to be stable. We also discuss observational implications of these results.
keywords:
hydrodynamics – instabilities – cooling flows – galaxies: ISM – X-rays: ISM – dark matter1 Introduction
Extended thermal X-ray emission from the hot ( K) interstellar medium (ISM) in giant elliptical galaxies is usually interpreted in terms of a ‘cooling flow’ scenario [see Loewenstein [1997] for a recent review]. It implies that radiative cooling of optically thin hot plasma drives a subsonic inflow towards the centre of a potential well formed by the stellar component and a massive dark halo. Galactic cooling flows and cooling flows in clusters of galaxies are essentially different owing to a difference in the origin of the two media. The intracluster medium is mostly primordial, cools from its high virial temperature and is accreted by the central galaxy, which provides a focus for the flow. In contrast, the ISM in elliptical galaxies is constantly replenished by mass loss from evolved stars. This gas must be thermalized in the galaxy’s gravity field and heated to X-ray temperatures from which it may cool down again. Thus, in hydrodynamic terms, galactic cooling flows are defined as systems where the mass flux is dominated by source terms as opposed to ‘boundary terms’ as in cluster cooling flows [1997].
Several potential heat sources have been considered to counterbalance radiative cooling of the hot ISM in ellipticals. The energy supplied with normal stellar mass loss is limited by the value of the stellar velocity dispersion and may only provide temperatures a factor of lower than the ISM temperatures [1996]. In contrast, gravitational energy liberated in case of gas inflow would provide too much heat to the central regions [Thomas [1986] and references therein].
Heating by supernovae (SN) Type Ia remains a controversial issue. On the one hand, the SN rate is not very well constrained. Its value varies from SNu, suggested by van den Bergh & Tammann [1991], the uncertainty being a factor of the order of 1.5, to SNu derived by Cappellaro, Evans & Turatto [1999].111 is the Hubble constant in units of km s-1Mpc-1; 1 SNu = 1 supernova per century per solar bolometric luminosities.
On the other hand, the low iron content of the diffuse hot gas in ellipticals estimated from high-quality broad band X-ray spectra provided by ASCA for a single-temperature plasma model [1998] suggests a very low efficiency of ISM enrichment by Type Ia SNe. This implies either that the SN rate is lower than SNu [1998] or that SN ejecta do not mix with the hot ISM [1986, Fujita, Fukumoto & Okoshi 1997]. However, the multi-parametric analysis of X-ray spectra is a complex procedure based on iron L line diagnostic tools, and requires accurate atomic physics data [Arimoto et al. 1997]. The procedure is also model-dependent. Using two-temperature multi-phase plasma models Buote [1999] obtained substantially better spectral fits for the same data sets with iron abundances of solar and relative element abundances fixed at their solar values. His results are consistent with the Type Ia SN rate being up to a factor of lower than reported by Cappellaro et al. [1999]. Clearly, better quality data are required to determine the Type Ia SN heating rate more precisely.
All of the above mentioned energy sources may be described as being continuously distributed within a galaxy and their local rates depending on the stellar mass density and velocity dispersion, the gas inflow velocity profile, and the shape of the gravitational potential. There is a ‘global problem’ [1988] of balancing heating and cooling both in the centre and in the outer regions, since the source terms depend in different ways on physical characteristics which vary with radius. However, empirical scaling laws for ellipticals and the physics of radiative cooling and thermal instability imply certain restrictions on the radial dependences. One possible solution to this problem is a hydrostatic hot gas recycling model [1996] for hot coronae of elliptical galaxies. In the hydrostatic gas configuration all that remains of the gas dynamical equations are the algebraic source terms which balance to zero. In this model two equilibrium conditions are simultaneously satisfied: (1) the stellar mass loss rate exactly balances the rate that mass cools locally from the flow (dropout) and (2) the rate that thermal energy is radiated away is exactly balanced by the energy input from stars and supernovae. The recycling model can be used as a tool to distinguish between inflow and outflow regimes for a given set of galaxy parameters (Kritsuk, Böhringer & Müller 1998).
Periods of sporadic activity can drastically change the thermal state of the ISM in the inner ‘cooling flow’ region of a cluster or of an elliptical on a time scale of yr. There are numerous observations of an interaction between radio sources and the hot gas both in central cluster galaxies and other ellipticals [Harris et al. 1999, Koekemoer et al. 1999, McNamara et al. 2000]. It is this complex central region that is most sensitive to any imbalance in the energy budget of the ISM. Since the ‘thermal’ time scale is shorter there, the core of a few kpc in radius is the first to reach a new equilibrium state corresponding to the current status of heating. High spatial and spectral resolution X-ray observations of these central regions are critical to distinguish among the various heat sources and flow regimes in the core.
The response of a cooling flow to energy injection by the central black hole that is fed by the cooling flow was simulated by Binney & Tabor (1995). In their spherically symmetric numerical models the black hole heats the central kiloparsec of the ISM as soon as it begins to swallow gas from the ISM. The resulting expansion of the heated gas eliminates the cusped density profile and establishes a core that is roughly 2 kpc in radius. After the central heat source has switched off, the core again cools catastrophically within 0.5 Gyr. Among several limitations of the model (which include a peculiar feedback mechanism) the authors particularly note the restriction of spherical symmetry. Both the jet and the ensuing convective instabilities cannot be properly modelled due to this symmetry restriction.
In this paper we analyze the hot gas flow regimes, which develop in elliptical galaxies in response to a small imbalance in the energy budget caused by a global instability of the equilibrium recycling model [1998]. We use multi-dimensional numerical simulations to investigate compact cooling inflows and subsonic convection – two alternative saturated nonlinear regimes for a slightly disturbed thermal equilibrium in the core. Here, we restrict ourselves to spherically symmetric (on the average) convective flows, which have not been studied before. The symmetry restriction will be relaxed in a subsequent paper which more closely addresses the astrophysical aspects of the problem. The analysis presented here provides a basis for a better understanding of more complex convective flows and allows for a direct comparison with one-dimensional models.
A short description of our basic model is given in Section 2. Section 3 describes the numerical method. The results of numerical experiments are presented in Section 4 together with the detailed properties of the inner convective cores. In Section 5 we summarize the results and discuss effects to be expected for the dynamical state of the hot gas in ellipticals from a larger imbalance between cooling and heating.
2 The model
Our numerical experiments are based on a physical model, which has been described in Kritsuk et al. [1998]. We refer the reader to that paper and references therein for a more detailed description than given below.
We assume that the local mass budget of the hot ISM inside the galaxy is determined exclusively by mass supply from the old stellar population of the galaxy [in the form of stellar winds, planetary nebulae, supernova explosions, etc.; a detailed discussion can be found in Mathews [1990] and Mathews & Brighenti [1999]], and by gas condensation to a warm phase due to thermal instabilities. Our motivation for including mass dropout is based on the fact that the assumed mass supply mechanisms inevitably cause nonlinear small scale perturbations in the hot phase, which can trigger thermal instabilities. The rate of mass dropout is assumed to be a function of local conditions in the hot ISM, and given by the expression , where is the density of the hot phase. The spectrum of the initial small-scale perturbations in the gas and, in particular, its modification by heat conduction are described by a single parameter . The Heaviside function and the linear instability growth rate are defined as
| (1) |
| (2) |
Here is the hot gas temperature, is the nonequilibrium zero field radiative cooling function for solar composition and complete ionization of the plasma [1993], and is the specific heat at constant pressure. The first term in the rhs of equation (2) coincides with Field’s instability criterion, and the second one describes stabilization due to stellar mass loss [1992], is the specific stellar mass loss rate, and is the local stellar mass density. Here we assume [1996]. Since we are interested in relatively short evolutionary time scales ( Gyr), we assume to be a constant.
The local energy budget of the hot ISM is determined by radiative losses and energy supply from stars (via SN Type Ia explosions and via thermalization of the kinetic energy of orbital motion for the gas shed by stars). Radiative cooling comprises two energy sinks due to (i) direct radiative cooling of the hot phase and (ii) due to radiative losses by the condensing material.
Finally, the hydrodynamic description for the hot phase is based upon the assumption that the sources are homogeneously distributed. Note that this assumption is fulfilled as long as the numerical resolution is not excessively high. The set of conservation laws for mass, momentum, and energy of the hot phase can then be written as follows:
| (3) |
| (4) |
| (5) | |||||
Here is the velocity vector, is the pressure, is the adiabatic index, is the specific internal energy, and is the characteristic specific energy of the heat source of temperature . The energy density .
We define a spherically symmetric gravitational potential to be that of a two-component isothermal sphere, which includes stars and a massive dark halo [1997]. The galaxy model is characterized by four parameters: the stellar velocity dispersion , the characteristic radius of the stellar mass distribution
| (6) |
the ratio of the stellar and dark matter (DM) velocity dispersions
| (7) |
and the ratio of the dark matter mass density and the stellar mass density at the centre of the galaxy
| (8) |
For the prototype galaxy NGC 4472, we set km s-1, kpc, , , which allows us to reproduce its surface brightness profiles both in the optical and in X-rays with a reasonable accuracy. In this case sinks and sources of mass and energy for the hot phase are locally compensated everywhere in the galaxy if the parameters , , and are constant. Hydrostatic equilibrium requires an adjustment of the temperature of the hot gas and of the stellar velocity dispersion . This is achieved by additional restrictions applied to the values of and coupled by
| (9) |
where is the gas constant and the mean molecular weight [see [1998] for more detail]. For a specific stellar mass loss rate s-1 [1976, 1987], hydrostatic equilibrium is achieved with a reasonable mass deposition efficiency of and a characteristic temperature of the heat source of K. This temperature is lower than the K corresponding to a SN Type Ia rate of SNu [1991], but it is higher than the K obtained for a supernova rate of SNu [1999].
Note, that we do not claim NGC 4472 to be a perfect galaxy with an isothermal hot ISM, an isothermal stellar system and an isothermal dark halo. Rather we construct a simple model whose physical properties are based on observations of NGC 4472. The use of a restricted set of control parameters allows us to investigate in which way(s) our model differs from the real object.
3 Numerical method
The evolutionary equations are solved by means of the AMRA code [2000], which is based on the direct Eulerian version of the PPM method of Colella & Woodward [1984] on an adaptively refined hierarchical system of completely nested grids [1989]. For the present 1D and 2D axisymmetric simulations we use spherical coordinates. The computational domain extends from pc ( pc in 1-D simulations) to kpc in radius and covers (in 2D simulations) the wedge . Periodic boundary conditions are imposed in the angular direction.222Unlike reflecting, periodic boundary conditions allow for a free gas flow across the sides of the computational volume, which is closer to the 3-D case. Switching from periodic to reflecting conditions in the steady convective regime does only modify the extreme values of the velocities. The main flow remains basically unchanged. In the radial direction hydrostatic equilibrium is assumed at and at , i.e. the radial (and theta) velocity is set to zero and the boundary pressure is defined in such a way that the pressure gradient at the boundary is equal to the hydrostatic one. We allow for up to 4 levels of refinement with density and pressure jumps of 10 per cent used as refinement criteria. With refinement ratios of 4 and 2 in radius and angle, respectively, the resolution of our 2-D models is equivalent to that of a uniform grid run with zones ( pc and ). The source terms are calculated explicitly [1993] using the operator split approach.
4 Results

4.1 Spherically symmetric solutions
In the presence of heat conduction the equilibrium recycling model for the hot gas in giant ellipticals is meta-stable [1998]. It means that, while arbitrary infinitesimal perturbations do not grow, perturbations of a finite amplitude can switch the system to a different equilibrium state or to a nonequilibrium catastrophic evolutionary regime.
Since we are mostly interested in studying thermal effects and since the characteristic thermal time scale is usually longer than the dynamical time, it is quite natural to examine the response of the system to a class of perturbations, which do not disturb the hydrostatic equilibrium. In general, the system can be perturbed in a number of different ways. However, the approximation of spherical symmetry, which allows us to reduce the problem to 1-D, is rather restrictive.
The simplest perturbation of this class is a global density perturbation which, at first sight, may seem to be unphysical because of its global nature. However, due to stratification of the hot gas, the thermal time scale depends strongly on radius, i.e. for a time scale of a few yr the perturbation only affects the inner region because the rest of the hot gas has not enough time to react. Hence, for a sufficiently short time interval the global perturbation is equivalent to a more local one.
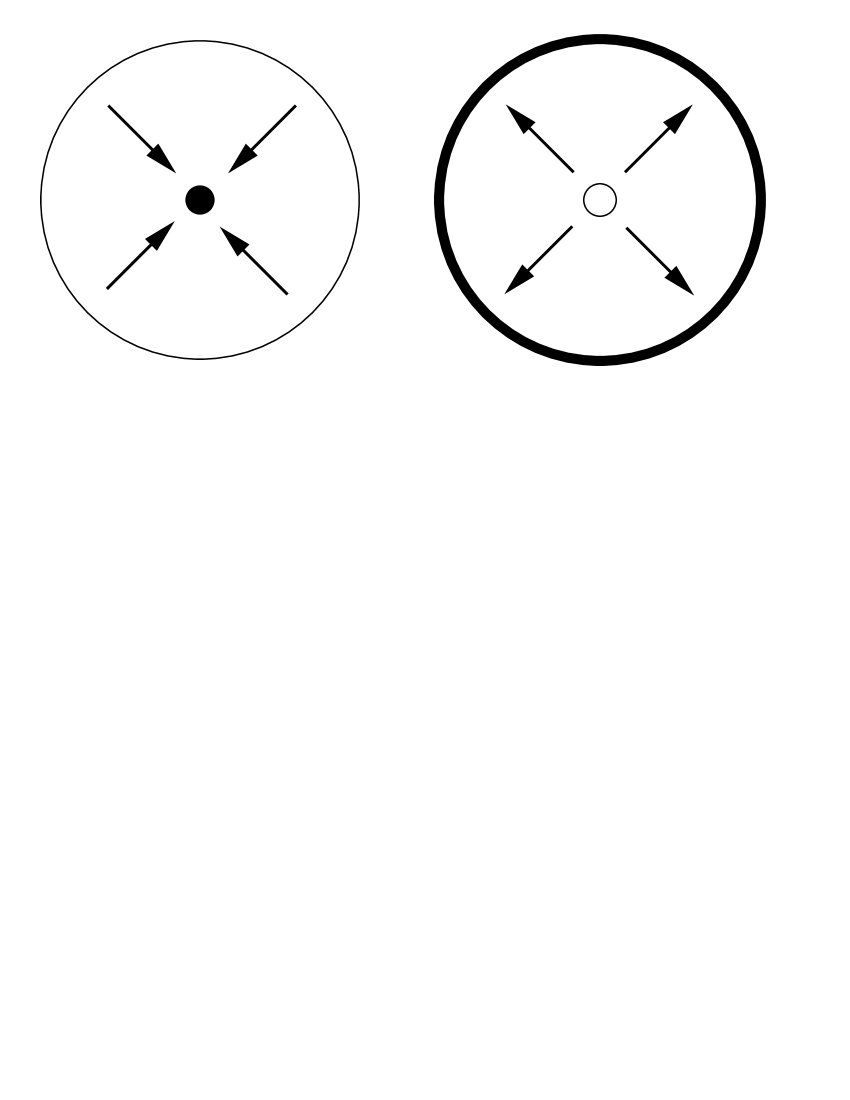
4.1.1 Cooling inflows
We have computed a series of spherically symmetric solutions with initial global density perturbation amplitudes and 0.2, and compared the results obtained with different spatial resolution in the central cooling region. Left and right panels of Fig. 1 illustrate our results for . The left panel shows distributions of density temperature and velocity at , 50, 100, 150, 200, 250, and 300 Myr for our intermediate resolution run with a radial spacing of 12 pc. The heavy lines indicate the initial conditions. The quasi-steady regime is already established at Myr after having passed through the linear growth regime which covers most of the earlier epochs. Then, for a very short time, a transient dynamic inflow occurs. Afterwards the flow remains quasi-steady. The gas temperature in the cooling core drops below the equilibrium value by a factor of . The density distribution shows a central cusp with a power index . Hence, this model predicts a compact central peak in the X-ray surface brightness. This peak can be observed if the instrument has sufficient angular resolution, and if finite optical depth effects in the inflowing dense core will not render the approximation of an optically thin plasma invalid. Note, that heat conduction and/or magnetic pressure support can modify the stability of the initial equilibrium model and even suppress the formation of the cooling core [1998].
The right panel shows the flow variables at Myr soon after a compact cooling inflow has been established in the core region of kpc in radius. The effects of the finite grid resolution are most evident in the velocity plot. Changes in the grid resolution effectively modify the position of the inner boundary thus determining the lowest velocity and temperature, and the highest density values attained on the grid.
At the coarsest grid spacing of 48 pc the compact inflow region ( pc) is covered by less than 10 grid zones and hence remains unresolved. Steep gradients of dependent variables introduce interpolation errors, and errors due to explicit calculation of the source terms. These errors caused by the finite difference scheme are amplified by the physical thermal instability and, as a result, for the numerical solution displays high frequency noise in the temperature distribution for Myr. Using the same spatial resolution but doubling the size of the initial perturbation () makes the inflow even more dynamic and the noise amplitude becomes so large that the numerical solution eventually switches from the inflow to the outflow regime (see Fig. 2).
Grid resolution determines the amount of numerical dissipation of PPM. Although PPM does not utilize artificial viscosity explicitely, its interpolation scheme introduces some amount of dissipation, which depends on grid resolution. When increasing the resolution by a factor of 16 to pc the decreased numerical dissipation is found to be too small to prevent the development of small scale condensations due to the physical thermal instability inherent to flows with radiative cooling [see, e.g., Hunter [1970], Binney & Tabor [1995]]. As a result, a quasi-steady inflow solution is obtained (solid lines in the right panel of Fig. 1), which becomes unstable soon after Myr causing the breakup of the central density enhancement into multiple spherical condensation fronts.
At an intermediate spatial resolution of 12 pc (left panels and dashed lines in the right panels of Fig. 1) the cooling inflow region is well resolved by grid zones. The numerical solution remains stable for at least 500 Myr beyond the initial relaxation to a steady state inflow at Myr. Note that at higher spatial resolution (solid lines; right panels) the profiles are smoother than at lower grid resolution (left panels). The ’ripples’ present at lower resolution can be eliminated, for instance, by including a small phenomenological diffusion term in the equations, as in Binney & Tabor [1995], or by taking into account thermal conductivity [Kritsuk et al. [1998]].
The numerical experiments discussed below are all performed with a minimum radial grid spacing of 12 pc. At a much coarser grid important hydrodynamic scales remain unresolved, whereas a much finer grid is no longer consistent with our basic assumption that the sinks and sources of mass and energy are distributed continuously.
Preliminary results obtained in two dimensions assuming axial symmetry indicate that cooling inflows are stable against random small velocity perturbations. The stability is maintained due to advection of linear perturbations towards the inner boundary by the accelerating gas inflow.
4.1.2 Subsonic outflows

As an alternative to quasi-steady cooling inflows we have studied a class of subsonic outflow solutions, which can be obtained through negative global perturbations added to the equilibrium density. In such a case heating and mass supply from evolved stars in the galaxy overtake cooling and mass dropout, and instead of a compact cooling core a hot bubble develops in the centre (Fig. 2).
Fig. 3 shows an example of a subsonic outflow solution at , 100, 200, and 300 Myr for . In addition to the density, temperature, and velocity distributions we also show the entropy, which is defined here as
| (10) |
Numerical values for the entropy are given assuming .
As the gas in the hot bubble expands it compresses the ambient medium and thus creates a leading spherical quasi-isobaric condensation wave. The wave front is clearly seen as a peak in density and as a sharp minimum in the temperature profiles. The gas temperature in the bubble is a factor of higher than the equilibrium temperature . It eventaully saturates at a value of about K which is fixed by the heating rate at the centre. Typical expansion velocities in the bubble are about 10 km s-1. The maximum velocity continuously grows as the bubble expands while less and less dense outer layers of the hydrostatic corona start to feel the energy imbalance due to the initial global density perturbation. The bubble will expand beyond 300 Myr (the state shown in Fig. 3) because of the special form of the initial perturbation. Thus, the solution will not tend towards a steady galactic wind. Since on a timescale of a few Gyrs the heating rate and stellar mass loss vary, such steady wind solutions are unrealistic, anyway. Negative velocities observed at kpc are related to a sound wave, which is triggered at the beginning of the simulation by small deviations of the initial model from an exact hydrostatic state.
The outflow solution is Rayleigh-Taylor unstable since the initially stable entropy stratification is modified by the expanding bubble. In particular, one may expect that the unstable local entropy inversion associated with the forming condensation front will be smeared out by convective motion, if the restriction of spherical symmetry of the flow is relaxed, and, thus, such a sharp front will never form in reality.
4.2 Unstable axisymmetric outflows
In order to initialize the flow in the axisymmetric case we impose besides a global density perturbation also a small random velocity perturbation with an amplitude of of the adiabatic sound speed. This additional axisymmetric perturbation helps us to initiate two-dimensional flow. In the central region, kpc, the grid resolution is zones. The evolution has been followed for 300 Myr.
4.2.1 Flow structure and evolution
Convection starts to develop after Myr from the beginning of the simulation in the form of small-scale vertical finger-like structures. The fingers originate the central region of unstable entropy inversion. High entropy material flows upwards and low entropy material – downwards, restoring a marginally stable stratification with an adiabatic temperature gradient
| (11) |
As the fingers flowing in opposite directions accelerate, Kelvin-Helmholtz roll-up transforms them into mushroom-like structures typical for the developing convective pattern [1999, Section 6].
By Myr a convective core with a radius of kpc forms and large scale structures become dominant. At that time the radial velocities of the convective motion reach km s-1, and convection approaches a quasi-stationary regime. Still later, when the outer gas layers start to feel the imbalance of mass and energy gains and losses due to the global initial density perturbation, these layers become involved into the convective motion, too. As the temperature in the hot bubble grows and the convective core expands, large scale convective structures with higher flow velocities appear.
At Myr the linear size of the largest mushroom is about 3 kpc and typical flow velocities are km s-1. A little bit earlier, at Myr, the maximum Mach number of 0.54 is recorded for a stream of upflowing hot gas. Thus, the convection driven by initially small333Note, that a negative perturbation of 10 per cent in the gas density implies an about 20 per cent lower luminosity than in equilibrium, i.e. 20 per cent ‘extra’ heating. This corresponds to a net continuous supply of heat with a power of ergs s-1. A conservative estimate of ergs s-1 for the typical power supplied by AGNs in the form of mechanical energy of jets is much larger than this value (see, e.g., Owen, Eilek & Kassim [2000]). The typical power required to sustain radio core sources in elliptical galaxies is about ergs s-1. Our simulations show that a smaller () initial density perturbation develops a convective core with a radius of kpc by 300 Myr. () deviations from local thermodynamic equilibrium remains subsonic. In a realistic 3-D situation one could expect even lower convective velocities due to the extra dimension available for a redistribution of the kinetic energy.
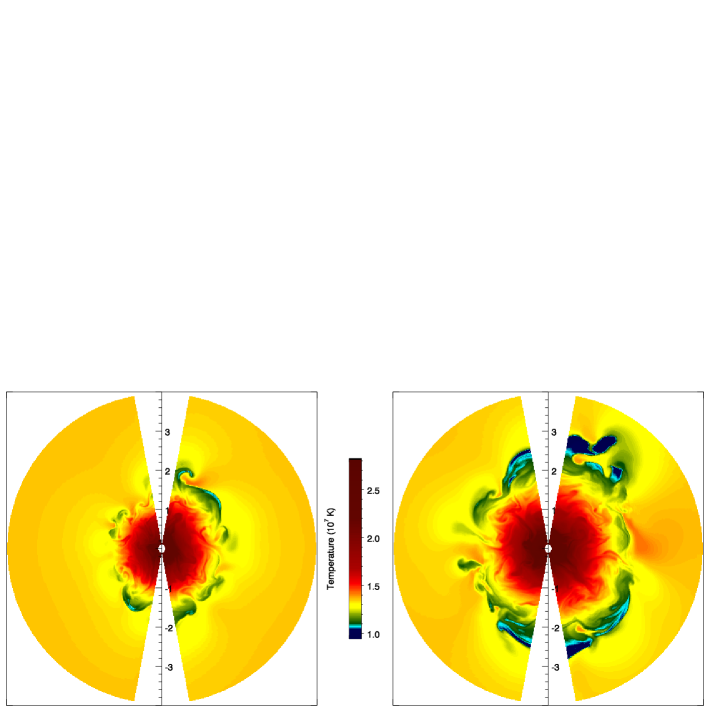
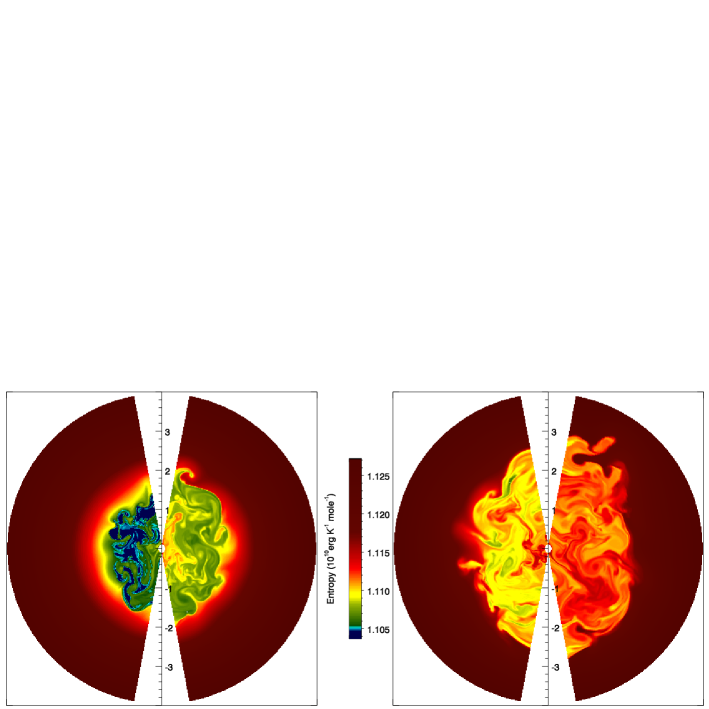
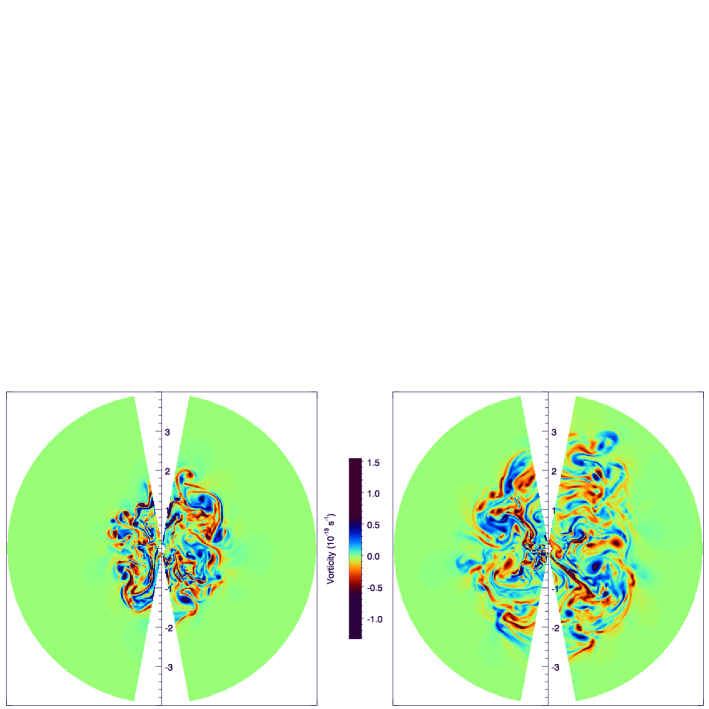
Snapshots of the temperature, entropy and vorticity distributions for the inner 4 kpc are shown in Figs 4–6. The temperature maps clearly exhibit the expansion of the hot bubble and the distorted analogue of the spherically symmetric leading condensation front, which is formed by the uppermost parts of the mushroom caps. The mushrooms are best seen in the entropy maps owing to the formation of an entropy ‘plateau’ in the core. The mean value of the entropy in the core steadily grows. Consequently, the convective pattern changes from blue via green and yellow to red. The vorticity maps highlight small scale structures in the velocity field and help in tracing the mushroom clouds as counter-rotating eddies forming the caps (Fig. 6). The convective core as a whole has a well defined sharp outer boundary defined by the largest mushroom caps. The global maximum of the hot gas density is typically slightly off centre.
For further details on the flow evolution we refer to a set of computer animations available at http://www.mpa-garching.mpg.de/Hydro.
4.2.2 Statistical properties: angular averages

Analysis of the angular averages of the hydrodynamic variables allows one to compare the properties of the new equilibrium444 We refer to the term ‘equilibrium’ here in a statistical sense, implying that the mean convective flow is quasi-steady on time scales of a few 10 Myr. According to Fig. 12, the flow evolves slowly on a time scale of hundreds of Myrs which is longer than the typical life span of a convective element (See Sections 4.2.3, 4.2.5). established in the convective core with those of the hydrostatic recycling model, and those of the outflow solution.
Fig. 7 shows angular averages at 300 Myr for the central 4 kpc region. Convection has smeared out the condensation front, which forms in the spherically symmetric case. As a result, the averaged convective solution falls in between the equilibrium model and the 1-D outflow.
The gas density near the very centre is by a factor of smaller than in the equilibrium, but still larger by a factor of than in the 1-D case. Unlike in a compact inflow, there will be no sharp peak in the X-ray brightness in the central 1 kpc in this case (see also the emissivity distribution in the upper panel of Fig. 8). An observation with sub-arcsec resolution of a nearby elliptical galaxy, like NGC 4472, would be a critical experiment to distinguish between the compact inflow and convective outflow realizations in the core. The relatively small density fluctuations about the mean indicate that compressibility is not very important, which is consistent with a subsonic convection regime.
The average temperature grows by a factor of in the central 1 kpc and has a shallow minimum at the position of the condensation front. Local relative temperature variations in the convective flow are about , mainly at the interface between the convective core and the ambient hydrostatic gas. The average pressure profile shows clear deviations from the hydrostatic stratification. Local pressure fluctuations are per cent, and hence imply a quasi-isobaric regime of convection. The angular averaged entropy distribution is almost flat within a 2 kpc core and rises further outwards. There is no entropy inversion as in the 1-D case, i.e. the system has settled to a new equilibrium state via nonlinear saturation of the convective instability.
Both vertical and horizontal gas velocities are quite high compared to typical cooling flow values of about km s-1. However, the mean radial velocity at Myr lies in the range km s-1, which is similar to the 1-D case, where km s-1. Thus, there is no considerable mass flux in the radial direction.
In order to assess the efficiency of radiative cooling in the turbulent core, we define the volume emissivity as
| (12) |
The two terms on the rhs in the above equation describe radiative losses from the cooling condensations and direct radiative cooling of the hot gas phase, respectively. The upper panel in Fig. 8 shows the distribution of the emissivity with radius for the inner 4 kpc. The peak central emissivity in the convective core is an order of magnitude lower than in hydrostatic equilibrium. For kpc the emissivity distribution roughly follows the one of the recycling model. Local variations of the emissivity by a factor of are detected in the condensation front region between 2 and 3.5 kpc.
The lower panel in Fig. 8 shows the relative rates of mass supply from stellar winds and mass deposition due to local thermal instabilities. Notice that for kpc the mass sink is switched off due to a stabilization by intensive SN-heating (see equation 2). Mass dropout dominates on average at radii from 2 to 3 kpc. The oscillations of the mass dropout rate are rather intense between 2 and 3.5 kpc, where the convective flow turns over.
All of the best X-ray observations of elliptical galaxy X-ray halos show positive temperature gradients in the central 10 kpc [1997]. XMM-Newton observations of M87 and its X-ray halo report keV in the central circle of ( kpc) in radius, a ‘steep’ temperature rise to keV at ( kpc), and a shallow rise to keV in the range from to [2001]. Yet the measured temperature gradients do not give us much information about the temperature distribution within the central kpc. Only the latter would help us to verify the model assumptions concerning the thermal balance of the hot gas near the centre. The measured gradients can rather point to a slight non-isothermality of the underlying gravitational potential, which traces the transition from the dark matter halo/cluster dominated outer region to the stellar core of M87 [1995, 1998].

At the same time, the flat (on the average) entropy distribution in the core region of our model is supported by the assumed spherical symmetry of the underlying gravitational potential, average gas density distribution, and the net heat source. As we mention in the introduction, this assumption is restrictive. Even a small asymmetry, e.g., in the central heating efficiency would create a hybrid in/out-flow with a more stable (on the average) entropy stratification, i.e. with a mild positive average temperature gradient. As soon as the asymmetric heating is sufficient and, still, centrally concentrated (as in the case of AGN heating), such a flow would not necessarily display a central density/X-ray brightness cusp.
Observationally, one can expect to see convection in the form of uprising hot bubbles interacting with a background flow of cooling gas. It is possible, that flows of this kind are observed in X-rays by Chandra and in radio on VLA in NGC 1275 [2000] and in M87 [2000]. Such flows seem to be largely subsonic, and the interface of a hot bubble with the background flow does not imply shock waves unlike in the model of Heinz, Reynolds & Begelman [1998]. Rather, it would be physically similar to the interface of our convective core with the surrounding hydrostatic corona, displaying lower temperatures, larger mass deposition rates and a higher X-ray surface brightness. We shall consider such flows in detail elsewhere.
4.2.3 Statistical properties: power spectra

A spectral decomposition of a flow helps to reveal information which is not apparent otherwise, like the distribution of energy over length scales and effects of the finite grid resolution. In order to reveal this information we have computed one-dimensional Fourier transforms along the -coordinate direction at various radii. Strong gravitational stratification of the gas density and the lack of periodicity in the radial direction would dominate the spectrum in the radial direction, and thus would complicate the analysis.
For a scalar quantity of interest, , we define the horizontal Fourier transform to be
| (13) |
which is a function of time, radius, and the horizontal wavenumber . Here is the horizontal periodic length. The power spectrum is the square of the modulus of its complex Fourier transform, namely . We have used simple periodograms [see, e.g., Press, Teukolsky, Vetterling & Flannery [1992]] as the power spectra estimates for discrete data sets given on the finest level grid covering the inner convective region of the computational domain.
For the spectral analysis we have used the velocity field. When the density is constant, the power spectrum of the velocity field is similar to a kinetic energy spectrum. As the gas density varies only slightly about its mean value with angle at a given radius (see and envelopes in Fig. 7), the density factor is always negligible. However, since radial modes are ignored in our 1D analysis, the sum of the power spectra of the velocity components is not expected to be a measure of the total kinetic energy.
Since instantaneous power spectra are noisy and since they fluctuate considerably in time, we use temporal averages to estimate the typical power distribution with wavenumber. The convective core expands as the source terms associated with the stellar system drive the hot bubble at the centre. Hence, we had to take averages over a period of time shorter than the expansion time scale ( yr) but longer than the lifetime of the largest mushroom-like structures in our convective flow ( Myr, see Section 4.2.5). Averaging over a time interval 25 Myr sufficiently suppresses the oscillations in the mean spectra at small wavenumbers. We use angle brackets in the following to denote the computed temporal averages.
Fig. 9 shows the power spectra of the two velocity components at radii of 0.71, 1.32, 1.93, 2.54, and 3.15 kpc, respectively. Obviously, the power is concentrated towards the large scales, as already mentioned in section 4.2.1 when discussing the settling of the convective regime. The spectra do not show any significant radial dependence. The mean slope of the spectra is . Following the work of Porter & Woodward [1994], who investigated the numerical dissipation of the PPM scheme, we estimate that in our simulations numerical dissipation starts to become important for , i.e. for structures smaller than about 16 angular zones.
Batchelor (1969) in his paper on two-dimensional isotropic turbulence derived an analogue of the Kolmogorov energy spectrum. For 2D flows the spectrum of vorticity is universal. If is the vorticity spectrum, then is the analogue of Kolmogorov’s power law. For the energy spectrum of 2D flows one has . From our Fourier analysis we obtain as expected and in the interval . This explains the transition from small scale to large scale mushrooms when convection sets in.
4.2.4 Average transport properties
The characteristics of the convective flow in the inner region can also be examined by calculating the angular averaged energy and a set of energy fluxes, which we define below following Hurlburt, Toomre & Massaguer [1986].
The angular integrated total energy equation (5) can be expressed as
| (14) |
with
| (15) |
where is the heat flux due to a spherically symmetric expansion or contraction of the model, is the ‘enthalpy’ or convective heat flux, is the kinetic heat flux, and is the net energy source term. These fluxes and the source term are defined as
| (16) |
| (17) |
| (18) |
| (19) |
The above definitions involve spatially fluctuating variables , where is the angular mean value and is the fluctuation about that mean value. They allow us to discuss correlations between the radial velocity and a number of fluctuating quantities. Such correlations provide useful insights into energy generation and energy transport mechanisms in the convective interior of the hot ISM.
We further define a total energy flux . In a steady state with the total flux does not depend on radius . If a convective flow achieves a statistically steady state, then for sufficiently long time averages the average total energy flux
| (20) |
does not dependent on radius as well, while the individual contributing fluxes may vary considerably with .

Before turning to the fluctuations let us consider the inner 4 kpc region where convective motion occurs in a mean ‘background’ flow after the onset of the instability. Fig. 10 shows the radial dependence of the total energy flux and net source at four representative moments of time before and shortly after the instability sets in. At these times the total flux is directed outwards and increases from zero at to values around erg/s at kpc mainly due to a slow overall expansion of the gas. This expansion is stimulated partly by an outgoing weak sound wave generated by the initially imperfect hydrostatic equilibrium, and also by the increasing source terms blowing a hot bubble at the centre. Since the flow is spherically symmetric for Myr, the major contribution to the total flux is due to gas expansion in an external gravity field, i.e. . The small wrinkles visible at kpc in the flux diagram at Myr hint towards a contribution from fluctuations of the developing convective flow, but still .

By Myr, when the convective flow already covers the whole inner region ( kpc), the global expansion driven by the action of the source terms remains the dominant contributor to the total energy flux (Fig. 11). Note that the mean energy flux carried away from the inner region at Myr amounts to about 7 per cent of the luminosity of the hot gas in the whole computational domain kpc (see Fig. 12).
Our analysis indicates that the fluctuations play only a secondary role for the energy transport. The mean angular integrated convective flux, , is positive everywhere except for the region around kpc, where the mean source attains its minimum, yielding an upward convective transport of thermal energy. Like in case of an incompressible fluid a positive flux value corresponds to motions where hot fluid parcels rise and cold ones sink. The depression in at kpc spans the same range in radius as the condensation front smeared by convection. In this region mass dropout due to thermal instabilities dominates over mass supply from stellar winds, and the enthalpy flux, carried by fluctuations from the inner region, decreases.
The mean kinetic flux steadily grows in absolute value, as the convective core becomes more extended giving rise to larger convective structures with higher velocities. The kinetic flux is positive (i.e. directed outwards) at kpc and weakly negative further out in the region where convective motions overshoot through the condensation front. The sign of is related to differences in strength and filling factor between upward and downward directed motions. In our two-dimensional simulations upflows are considerably faster than downflows in the interior of the convective core and there is no apparent asymmetry in the filling factors (see the angular velocity diagram in Fig. 7).
4.2.5 Integral characteristics

In order to follow the evolution of global characteristics of the flow we computed the total hot gas luminosity and the net mass deposition rate as integrals over the whole computational domain (Fig. 12). The computed total luminosity is close to the X-ray luminosity erg s-1 of NGC 4472 at a distance of 17 Mpc. There is a mild tendency for the luminosity to grow with time as the gas shed by stars in the galaxy slowly accumulates in the convective core. Low amplitude oscillations in the luminosity on a time scale of Myr correspond to a life cycle of the largest convective structures. Assuming a linear scale of kpc and Myr, one can estimate a characteristic velocity km s-1. This value is typical for the convective core which developed in the simulations by Myr (see Fig. 7). A time scale of 25 Myr is also a reasonable choice for the time averaging interval to be used when computing mean power spectra.
The net mass deposition rate , given by the volume integral
| (21) |
is initially positive, since a negative global density perturbation breaks the balance between the mass supply to the hot phase from stellar winds and mass loss from the hot phase due to local thermal instabilities. The mass supply from stars always dominates, and grows from 0.5 to 0.75 M⊙ yr-1 (Fig. 12) since the system evolves further away from hydrostatic equilibrium. For our model galaxy with a stellar mass M⊙ the rate of steady supply of gas from stars, M⊙ yr-1, implies that the gas condensation rate varies from 0.7 at to M⊙ yr-1 at 300 Myr. As one can see in Fig. 12, slightly oscillates in phase with the X-ray luminosity. Maxima of record moments when streams of rising hot material form new large scale mushroom-like structures.
5 Discussion and Conclusions
In this paper we have studied hot gas flows originating in the central few kpc of hot galactic coronae in response to a slight energy supply imbalance in a model initially in equilibrium. It is shown that a negative energy budget drives a quasi-steady compact cooling inflow, which is stable to small perturbations. Excessive heating creates an isentropic (on average) convective core in the vicinity of the galaxy centre. Provided the net energy gain in the core is not too high, the convection remains subsonic with typical flow velocities (both, radial and angular) of the order of km s-1. The characteristic convective pattern consists of a manifold of mushroom-like structures of different scales. The power spectra of the velocity components are dominated by the largest-scale mushrooms. The emission weighted gas temperature in the core is slightly rising towards the centre. Unlike in the case of a cooling inflow, the X-ray surface brightness of a convective core does not display a sharp maximum at the centre. The inner parts of the convective core are dominated by mass supply from evolved stars, while in the colder outer shell mass drop out dominates the mass budget. Large-scale mushrooms (mainly their caps) can probably be marginally detected by high resolution X-ray images with good photon statistics, as their volume emissivity is about a factor of 2 higher than that of the surrounding gas.
We have considered an idealized case with a spherically symmetric heat source and small deviations from ‘thermal’ equilibrium near the centre. However, we can extrapolate our results to a more realistic hydrodynamic picture. First, stronger heating in the vicinity of the centre can drive a supersonic convection with velocities in excess of 400 km s-1 and produce a much larger (here 3-4 kpc) convective region. Second, a Type Ia SN heating rate which is lower all over the galaxy, and an excessive heating by an AGN in the central region will create a hybrid flow with an inner convective core and an outer ‘cooling flow’, which will vanish in convection when the inflow velocity is very subsonic. Our preliminary results indicate that such a hybrid dynamic flow can be stable and can last as long as the central source is active. Third, a low Type Ia SN heating rate without extra energy supply near the centre will drive a more extended massive cooling inflow with an even more pronounced central surface brightness peak. It would be harder to turn such a dynamic inflow into an outflow by a strong perturbation (e.g., a burst of AGN activity, or a merger) than a weaker compact inflow. Finally, we expect that an asymmetric central heat source in excess of the equilibrium value would create bubble(s) filled with a (mean) isentropic convective flow with properties similar to the ones described above.
Chandra, Newton and future X-ray missions will teach us more about the hydrodynamics of ‘cooling flows’.
Acknowledgments
AK was partly supported by the Russian Foundation for Basic Research (project 98-02-19670) and by the Federal Targeted Programme Integration (project A 0145). TP was partly supported by grant 2P03D.014.19 from the Polish Committee for Scientific Research. The simulations were performed on the RISC cluster of the MPA, and on the SGI Power Challenge at the Interdisciplinary Centre for Computational Modelling in Warsaw.
References
- [Arimoto et al. 1997] Arimoto N., Matsushita K., Ishimaru Y., Ohashi T. & Renzini A., 1997, ApJ, 477, 128
- [1969] Batchelor G. K., 1969, Phys. Fluids Suppl. II, 233
- [1989] Berger M. J., Colella P., 1989, J. Comput. Phys., 82, 64
- [1995] Binney J., Tabor G., 1995, MNRAS, 276, 663
- [2001] Böhringer H., Belsole E., Kennea J., Matsushita K., Molendi S., Worrall D. M., Mushotzky R. F., Ehle M., Guainazzi M., Sakelliou I., Stewart G., Vestrand W. T., Dos Santos S., 2001, A&A, 365, L187
- [1997] Brighenti F., Mathews W. G., 1997, ApJ, 486, L83
- [1999] Buote D. A., 1999, MNRAS, 309, 685
- [1999] Cappellaro E., Evans R., Turatto M., 1999, A&A, 351, 459
- [1984] Colella P., Woodward P. R., 1984, J. Comput. Phys., 59, 264
- [1996] Davis D.S., White R.E., III, 1996, ApJ, 470, L35
- [1976] Faber S. M., Gallagher J. S., 1976, ApJ, 204, 365
- [2000] Fabian A. C., Sanders J. S., Ettori S., Taylor G. B., Allen S. W., Crawford C. S., Iwasawa K., Johnstone R. M., Ogle P. M., 2000, MNRAS, 318, L65
- [Fujita, Fukumoto & Okoshi 1997] Fujita Y., Fukumoto J. & Okoshi K., 1997, ApJ, 488, 585
- [Harris et al. 1999] Harris D.E., Owen F.N., Biretta J.A. & Junor W., 1999, in H. Böhringer, L. Feretti & P. Shuecker (eds), Diffuse Thermal and Relativistic Plasma, MPE Report 271, 111
- [1998] Heinz S., Reynolds C. S., Begelman M. C., 1998, ApJ, 501, 126
- [1970] Hunter J. H., Jr., 1970, ApJ, 161, 451
- [1986] Hurlburt N. E., Toomre J. & Massaguer J. M., 1986, ApJ, 311, 563
- [1999] Inogamov N.A., 1999, Astrophys. & Space Phys. Rev., 10-2, 1
- [1992] Kritsuk A. G., 1992, A&A, 261, 78
- [1996] Kritsuk A. G., 1996, MNRAS, 280, 319
- [1997] Kritsuk A. G., 1997, MNRAS, 284, 327
- [1998] Kritsuk A. G., Böhringer H., Müller E., 1998, MNRAS, 301, 343
- [Koekemoer et al. 1999] Koekemoer A. M., O’Dea C. P., Sarazin C. L., McNamara B. R., Donahue M., Voit G. M., Baum S. A. & Gallimore J. F., 1999, ApJ, 525, 621
- [1997] Loewenstein M., 1997, in N. Soker (ed.), Galactic and Cluster Cooling Flows, ASP Conf. Ser. 115, 100
- [ 1998] Loewenstein M. & Mushotzky R. F., 1998, IAU Symp. 188: The Hot Universe, 188, 53
- [McNamara et al. 2000] McNamara B. R. et al., 2000, ApJ, 534, L135
- [1990] Mathews W.G., 1990, ApJ, 354, 468
- [1999] Mathews W.G., Brighenti, F., 1999, ApJ, 526, 114
- [1998] Nulsen P.E.J., MNRAS, 1998, 297, 1109
- [1995] Nulsen P.E.J., Böhringer H., MNRAS, 1995, 274, 1093
- [2000] Owen F. N., Eilek J. A., Kassim N. E., 2000, ApJ, 543, 611
- [1993] Plewa T., 1993, Acta Astr., 43, 235
- [2000] Plewa T., Müller E., 2001, Comp. Phys. Comm., in press
- [1994] Porter D.H, Woodward P.R., 1994, ApJS, 93, 309
- [1992] Press W. H., Teukolsky S. A., Vetterling W. T. & Flannery B. P., 1992, Numerical recipes in C. The art of scientific computing, Cambridge: University Press
- [1987] Sarazin C. L., White R. E., III, 1987, ApJ, 320, 32
- [1993] Sutherland R. S., Dopita M. A., 1993, ApJS, 88, 253
- [1986] Thomas P. A., 1986, MNRAS, 220, 949
- [1988] Thomas, P. A. 1988, in A.C.Fabian (ed.), Cooling Flows in Clusters and Galaxies, 235
- [1991] van den Bergh S., Tammann G. A., 1991, ARA&A, 29, 363