Optical Spectroscopy of GX 3394 during the High-Soft and Low-Hard States II: Line Ionisation and Emission Region
Abstract
We have carried out observations of the X-ray transient GX 3394 during its high-soft and low-hard X-ray spectral states. Our high-resolution spectroscopic observation in 1999 April suggests that the H line has a single-peaked profile in the low-hard state as speculated in our previous paper. The He II 4686 line, however, has a double-peaked profile in both the high-soft and low-hard states. This suggests that the line-emission mechanism is different in the two states. Our interpretation is that double-peaked lines are emitted from a temperature-inversion layer on the accretion-disk surface when it is irradiatively heated by soft X-rays. Single-peaked lines may be emitted from outflow/wind matter driven by hard X-ray heating. We have constructed a simple plane-parallel model and we use it to illustrate that a temperature-inversion layer can be formed at the disk surface under X-ray illumination. We also discuss the conditions required for the formation of temperature inversion and line emission. Based on the velocity separations measured for the double-peaked lines in the high-soft state, we propose that GX 3394 is a low-inclination binary system. The orbital inclination is about if the orbital period is 14.8 hours.
keywords:
binaries: spectroscopic — stars individuals (GX 3394) — black hole physics — accretion: accretion disks1 Introduction
GX 3394 is an X-ray transient (Markert et al. 1973; Harmon et al. 1994), and is classified as a black hole candidate (BHC) because of its short-term X-ray and optical variability (Makishima et al. 1986), its transitions between high-soft and low-hard X-ray spectral states (Markert et al. 1973), and the extended high-energy power-law tail in its X-ray spectrum (Rubin et al. 1998). It is one of the few BHCs that has shown all four X-ray spectral states: off, low-hard, high-soft and ultra-high. During the off state, GX 3394 has very weak and hard X-ray emission. Its optical counterpart is faint, with . In the low-hard state, it emits very strong hard X-rays. The spectrum is an extended power-law with a photon index . The 210 keV X-ray flux is, however, weak (). The optical brightness of the system is . In the high-soft state, the X-ray spectrum is characterised by a soft, thermal component. The 210 keV X-ray flux is about 20 times higher than in the low-hard state. The power-law tail is weak, with a photon index . The optical brightness is similar to that in the low-hard state, with . In the ultra-high state, both the thermal and the power-law components in the X-ray spectrum are strong. The 210 keV X-ray flux is about 50 times the X-ray flux in the low state, and the photon index of the power law is . On one occasion Mendez & van der Klis (1997) reported that the source was in a state intermediate between the low-hard and the high-soft state. The 210 keV X-ray flux was about a factor of 5 below the X-ray flux in the high state.
GX 3394 is also a radio source (e.g. Hannikainen et al. 1998). It has a flat spectrum, and its image has shown jet-like features (Fender et al. 1997). The radio emission was found to be correlated with the hard (20—100 keV) X-ray flux, and was quenched during a high-soft state (Fender et al. 1999).
Despite the fact that GX 3394 is optically bright () when it is X-ray active, it is not well studied in the optical bands. The mass function of the system has not yet been determined, and so the black hole candidacy is not verified in terms of the orbital dynamics. In a photometric observation during the off state, Callanan et al. (1992) detected a periodicity of 14.8 hr, and attributed it to the orbital period. A 14.8-hr orbital period would imply that the system has a late-type companion star with a mass M⊙. The 14.8-hr period, however, was not seen in the photometric data that we collected in 1998 (Soria 2000; Soria, Wu & Johnston 2000).
In our previous paper (Soria, Wu & Johnston 1999, hereafter Paper I) we reported part of the findings from our 1997 and 1998 spectroscopic observations. The system was in a low-hard state during the 1997 observation and was in a high-soft state during the 1998 observations. We found that the emission lines generally show double-peaked profiles in the high-soft state. The H line did not show resolved peaks in the medium-resolution (3 Å) spectra that we obtained in the low-hard state. Because of the limited spectral coverage in our 1997 observation, we were unable to determine the properties of the H, He II 4686 and Bowen N III 4641,4642 lines in the low-hard state. We therefore restricted our discussion to the profiles of the H line and did not compare the properties of the high-ionisation lines in the two X-ray spectral states.
GX 3394 was in its low-hard state again in early 1999, but it entered an X-ray quiescent phase in mid-April, with its hard X-ray flux below the detection limit of BATSE (from BATSE bright source reports) and its RXTE/ASM count rate consistent with zero (from quick-look results of the RXTE/ASM team). Its radio flux density in late June, measured by the ATCA, was more than 10 times weaker than that measured in an observation on April 14 (S. Corbel, private communication). Our optical spectroscopic observation was carried out on April 12, about 5 days before it became undetectable by BATSE. High-resolution ( Å) spectra at the H and the H/He II regions were obtained. In this paper we report the results of the 1999 observation and compare them with those of our 1997 and 1998 observations. We discuss the profiles of the high- and low-ionisation lines in different X-ray spectral states and the implications for the line-formation mechanisms and the line-emission region in BHCs.
2 Optical Spectroscopy
Our spectroscopic observations were carried out with the 3.9-m Anglo-Australian Telescope (AAT) in 1997 May and 1999 April and with the ANU 2.3-m Telescope at Siding Spring Observatory in 1998 April and August. The observations covered two X-ray spectral states of the source: the low-hard state in 1997 and 1999, and the high-soft state in 1998.
The observations are listed in Table 1. The technical details of the 1997 and 1998 observations were presented in Paper I. For the 1999 April observations, we used a Tektronix 1k1k CCD on the RGO spectrograph and a 1200V grating; the seeing was arcsec. The spectra were centred at 6563 Å (H region) and at 4770 Å (H/He II region), and the spectral resolution was 1.3 Å FWHM for both the H and the H/He II spectra. The total exposure time for the H spectrum was 1200 s, and that for the H/He II spectrum 600 s. Standard data reduction procedures were followed, using IRAF tasks, and wavelengths were calibrated using the Cu-Ar lamp spectra.
| UT date | epoch of observations | Wavelength range | Resolution | Telescope |
|---|---|---|---|---|
| (HJD - 2450000) | (Å) | (Å FWHM) | ||
| low-hard X-ray spectral state | ||||
| 1997 May 6 | 574.966–575.226 | 5355–6950 | 3 | AAT |
| 1997 May 8 | 576.974–577.042 | 5355–6950 | 3 | AAT |
| 1999 April 12 | 1281.287–1281.313 | 4455–5072 | 1.3 | AAT |
| 6282–6828 | 1.3 | |||
| high-soft X-ray spectral state | ||||
| 1998 April 28 | 931.953–932.318 | 4150–5115 | 1.3 | ANU 2.3 m |
| 6200–7150 | 1.3 | |||
| 1998 April 29 | 932.943–933.268 | 4150–5115 | 1.3 | ANU 2.3 m |
| 6200–7150 | 1.3 | |||
| 1998 April 30 | 934.106–934.233 | 4150–5115 | 1.3 | ANU 2.3 m |
| 6200–7150 | 1.3 | |||
| 1998 August 20 | 1045.864–1046.140 | 4150–5115 | 1.3 | ANU 2.3 m |
| 6200–7150 | 1.3 | |||
| 1998 August 23 | 1048.860–1049.103 | 4150–5115 | 2 | ANU 2.3 m |
| 6200–7150 | 2 | |||
 |
 |
 |
 |
 |
 |
3 Line peak-separation in the high-soft state
In Paper I we showed the H and H/He II spectra of GX 3394 in 1998 April and August. The strong emission lines in the spectra are H I Balmer, He I 6678, He I 7065, He II 4686 and Bowen N III 4641,4642. Other detectable emission lines are He I 4922, He I 5876 and N II 6505. The spectra are very similar to those of other BHCs (e.g. GRO J165540, see Soria, Wu & Hunstead 2000) in their high-soft states. The spectra of these systems all show high-ionisation lines, and the emission lines are double-peaked.
We show in Figure 1 the high-resolution profiles of the double-peaked H, H, He I 6678, He I 7065, He II 4686 and N III 4641,4642 lines. The velocity separations of the peaks are km for H, km for H, km for He I 6678, km for He I 7065, km for He II 4686 and km for N III 4641,4642. The velocity separations of H and H are the same within the uncertainties of the measurements, and so are those of He I 6678 and He I 7065. The similarity of the velocity separations for He II 4686 and N III 4641,4642 implies that these lines are emitted at a similar distance from the compact object, consistent with the theory of Bowen fluorescence, which requires He II for the pumping mechanism (see McClintock, Canizares & Tarter 1975; Kallman & McCray 1980; Schachter, Filippenko & Kahn 1989). Thus, we have observed a clear trend in which the velocity separations of the double-peaked lines increase with line ionisation, from the neutral hydrogen lines ( km ), to the neutral helium lines ( km ) and finally to the higher-ionisation (i.e. ionised helium and Bowen N III) lines ( km ).
The optical continuum of GX 3394 was bright during our 1998 observations, suggesting the presence of an active, bright accretion disk. If the double-peaked lines are emitted from the accretion disk, as commonly interpreted, we can use the peak separations to infer the radial distance of the emission regions from the compact object. Moreover, as higher-ionisation lines are emitted from hotter gases, we can also use the peak separations to map the surface temperature distribution of the accretion disk.
Assuming that the lines are emitted from a geometrically thin, Keplerian accretion disk, we can use the line velocities to constrain the system parameters. In Figure 2 we plot the expected velocity separation as a function of distance from the compact object for systems with a compact object of mass 4.0, 7.0 and 10.0 M⊙ and for various orbital inclinations. We also mark in the figure the expected orbital separation of the systems for various orbital periods, assuming that the companion star is a Roche-lobe-filling main-sequence star. As the size of the accretion disk cannot exceed the Roche lobe of the compact star, which is smaller than the orbital separation, we can easily see that the orbital inclination of GX 3394 is well below 30∘ if the orbital period is 14.8 hr (Callanan et al. 1992). Moreover, the mass of the compact object is unlikely to exceed 10 M⊙. However, the orbital inclination and the mass of the compact object may be higher if the orbital period is longer. If we adopt the BHC average mass of 7 M⊙ (see e.g. McClintock 1998) as the mass of the compact object in GX 3394 and assume that the Balmer lines are emitted near the rim of the accretion disk and that the orbital period is 14.8 hr, then we deduce an orbital inclination of about 15∘ for the system.
We note that no large velocity variations of the centres of the disk lines were detected in our 1998 April and August observations. This may be further evidence of a low orbital inclination. Additional evidence is provided by the flat radio spectrum (Fender et al. 1997), which we interpret as optically thick emission from jets oriented close to the line of sight.
 |
 |
 |
4 Spectrum in the Low-hard state
4.1 General features
Figure 3 shows the high-resolution (1.3 Å) spectra that we obtained on 1999 April 12. For comparison we also show the lower-resolution (3 Å) summed spectrum from the 1997 May observations, when the system was in a previous low-hard state. In the 1999 spectra both the H and the H lines are prominent, with equivalent widths (EWs) of and Å respectively. The H line appears to be single-peaked, in contrast to the more clearly double-peaked profile observed in the high-soft state. For H, the signal-to-noise of the spectrum does not allow us to determine the line profile. However, we do not see strong evidence of two peaks.
The other prominent line is He II 4686 (EW = Å). It shows two clearly resolved peaks, unlike the Balmer lines. The N III 4641,4642 lines are detected (with a limit to the EW Å) but are much weaker than in 1998 April and August (EW Å) during the high-soft state. Other lines that can be identified are weak He I 4922, and He I 6678 emission. In the 1997 May spectrum, the He I 6678 line is also found, and the N II 6505 line is visible.


4.2 Are the emission lines single-peaked or double-peaked during the low-hard state?
Medium-resolution ( Å) spectra obtained by Smith, Filippenko & Leonard (1999) during the low-hard state in 1996 May showed a broad, flat-topped H line. The profile resembles a line with two unresolved peaks, and Smith, Filippenko & Leonard (1999) interpreted the H line as being double-peaked. However, our 1997 May observations, when GX 3394 was still in its low-hard state, did not show a double-peaked H line. Because of the low resolution (3 Å) of our spectra, we were unable to verify whether the H line was single- or doubled-peaked. The higher-resolution (1.3 Å) spectrum that we obtained on 1999 April 12 allows us to carry out a more quantitative analysis.
The profiles of the H and the He II 4686 lines in the high-soft and low-hard states are shown in Figure 4. The H profiles of GRO J165540 obtained during its high-soft state in 1996 June and the hard X-ray outburst in 1994 September are also shown for comparison.
We have used the normalised difference spectra to examine the differences in the flux distribution in the line profiles from each observing epoch. For each spectrum, we removed the continuum by fitting and subtracting a low-order polynomial in the velocity range between km and km . The residual line flux was then normalised to unity. Finally, the line spectrum obtained in the low-hard state was subtracted from the spectrum obtained in the 1998 high-soft state.
In the left panel of Figure 5, we show the difference profile of the H lines for the 1998/1999 observations. The two peaks in the 1998 observations are clearly seen above the noise level. The peaks are also visible, though less prominently, in the H difference profile for the 1997/1998 observations (Fig. 5, middle panel). This suggests that the H profiles are different in the high-soft and the low-hard states. While the high-soft state is characterised by a double-peaked profile, the line probably has a single-peaked profile in the low-hard state.
The He II 4686 line is double-peaked in both our 1998 and 1999 spectra, making the difference profile (Fig. 5, right panel) less straightforward to interpret. The overall shape results from the difference between the widths of the lines.
Our observations show that both the H and the He II 4686 lines are double-peaked in the high-soft state. In the low-hard state, the He II 4686 line clearly shows two peaks, but the profile of the H line is better described as single-peaked. This indicates (i) different emission regions for H in the high-soft and the low-hard states, (ii) different line-formation mechanisms in the two states, and (iii) different response of the outer accretion disk under irradiation by soft and hard X-rays. These issues will be discussed in more detail in the later sections.
 |
 |
 |
 |
4.3 Comments on the line profiles and line widths
4.3.1 He II 4686 and N III 4641,4642
In spite of the similar double-peaked profiles of He II 4686 in the two X-ray spectral states, the peak separations are clearly different: 49066 km for the high-soft state and 60050 km for the low-hard state (Fig. 4, top-right panel). The line widths are also different in the two states (Fig. 5, right panel). The larger separation implies that the emission region is at a smaller radial distance from the compact object. The larger peak separation in the low-hard state may be due to the fact that the soft X-ray component was weak and unable to set up the temperature-inversion layer (see §5) in the outer disk regions.
We note that the N III 4641,4642 lines in 1999 April (Fig. 3) were much weaker than in 1998 (see Fig. 3 in Paper I). The N III 4641,4642 lines are due to Bowen fluorescence, which is pumped by the O III 374 multiplet resulting from the cascade O III 2p3d (3P) 2p3p (3S,3P,3D) 2p3s (3P0) 2p2 (3P2) transitions primarily pumped by the UV He II 303.78 (Lyman-) line (see e.g. Deguchi 1985; Schachter, Filippenko & Kahn 1989). The He II Lyman- line can be produced by the photoionisation-recombination process, and is therefore associated with the He II 4686 line. Hence, one might expect to observe strong N III 4641,4642 emission when He II 4686 is prominent. This is what we have observed in GX 3394 and other BHCs (e.g. GRO J165540 and RXTE J1550564) during the high-soft states. The situation is different during the low-hard state of GX 3394 in 1999 April: the N III 4641,4642 lines are weak, yet the He II 4686 remains prominent. A similar phenomenon was also observed in the BHC GRO J042232 during a hard X-ray outburst (Casares et al. 1995).
It was suggested that the absence of N III 4641,4642 lines in GRO J042232 was due to insufficient X-ray irradiation (Casares et al. 1995). One would therefore expect both the He II 4686 and the N III 4641,4642 lines to be weak. Here (and in various other systems), our observations show a strong He II 4686 line both in the high-soft and low-hard states, but significantly weaker N III 4641,4642 lines in the low-hard state. Clearly, there must also be other factors. We propose that the weakening of the N III 4641,4642 emission from BHCs in the low-hard state is due to optical depth effects. When the He II region becomes optically thick to UV continuum, the He II Lyman- and O III 374 photons are quenched. If it is still relatively transparent to the optical continuum, He II 4686 photons can escape. Without efficient pumping by He II Lyman- and O III 374 photons, the N III 4641,4642 lines are suppressed. If this is the situation in GX 3394, the photoionisation-recombination processes which produce the He II 4686 lines may be different during the high-soft and low-hard X-ray states (cf. Case A, Case B and Case C recombination processes, see Osterbrock 1989; Xu et al. 1992).
 |
 |
 |
4.3.2 Line width of the H emission line
The profiles of the H and the He II 4686 lines observed from GX 3394 in the high-soft and low-hard states are shown in the first three panels of Figure 4. The width of H is similar in the two states, in contrast to He II 4686, in which case the line width increases with the hardness of the X-rays.
We interpret the double-peaked lines in the high-soft state of GX 3394 (and in the high-soft state of other BHCs, like GRO J165540) as originating from the temperature-inversion layer created by soft X-ray irradiation on the accretion disk surface. The single-peaked (flat-topped or round-topped) Balmer lines observed in the low-hard states of GX 3394 are probably emitted from an outflow, possibly a dense wind from the evaporating atmosphere of the accretion disk. Theoretical studies (Murray et al. 1995; Murray & Chiang 1998) have shown that if the outflow/wind has a substantial velocity component parallel to the disk plane, single-peaked lines with widths similar to the Keplerian disk velocities can be produced. The profiles will appear to be round-topped or flat-topped, depending on the outflow velocity and density profiles (see Chapter 14 in Mihalas 1978), as in the case of emission lines from windy massive stars.
Single-peaked Balmer emission lines were also observed from GRO J165540 in 1994 August – September, in between strong hard X-ray flares. (Soria, Wu & Hunstead 2000). On that occasion, the lines were much narrower than the double-peaked lines observed during the high-soft state of the system (Fig. 4, bottom-right panel). The narrow, single-peaked lines from GRO J165540 are probably emission from an extended, optically thin cocoon above the disk plane, with lower rotational velocity than the disk or the disk wind. In the high-inclination system GRO J165540 (), most of this extended, optically-thin envelope was seen projected onto the sky and was therefore a source of emission lines. Narrow emission lines have not been observed in the low-inclination system GX 3394, where the accretion disk is seen almost face-on and any thin cocoon would be seen projected onto the disk surface.
5 Line emission region
5.1 A plane-parallel model
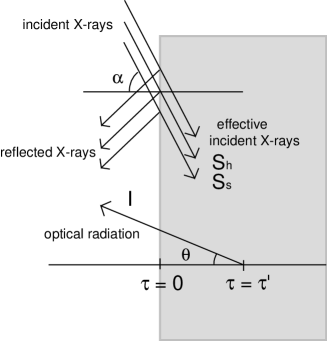
We consider a simple plane-parallel model (Fig. 6) to illustrate that a temperature-inversion layer can be set up at the surface of an accretion disk under strong soft X-ray illumination but not under hard X-ray illumination. The model is a modification of the model constructed by Milne (1926) for the illumination of a star by its companion in a close binary system. In Milne’s original formulation the incident radiation is at optical wavelengths, and the cooling is via emission of optical radiation. In BHCs, the incident radiation on the accretion disk consists of soft and hard X-rays emitted from regions close to the central compact object. We therefore need to take this difference into account.
In our model, we consider that the incident radiation has soft and hard X-ray components, for which the opacities are respectively larger and smaller than for the optical radiation. This modification is essential in the study of accretion disks irradiatively heated by X-rays, as soft X-rays are easily absorbed by neutral and weakly ionised matter (via bound-free transitions) at the disk surface, while hard X-rays are attenuated only at large depths where the matter density is sufficiently high. The other assumptions are the same as those in the Milne (1926) model, namely (i) the emission region has a plane-parallel geometry, (ii) the system is in radiative equilibrium, and (iii) the principle of superposition is applicable.
As the radiative-transfer equations are linear, the local temperature stratification is given by
| (1) | |||||
(see Milne 1926), where is the component of the radiation due to irradiative heating, is the component due to viscous heating in the disk in the absence of X-ray irradiation, is the optical depth, and is the Stefan-Boltzmann constant. We assume that the disk is cooled by emission of optical radiation, and therefore, refers to the optical depth in the optical band, along the direction normal to the disk surface. The disk component is given by
| (2) |
(e.g. Dubus et al. 1999), where the viscous energy flux of the disk and is the total opacity of the accretion disk in the vertical direction. The effective temperature , which is determined by balancing the energy generated by viscous heating and by radiative loss (see e.g. Smak 1984), is given roughly by
| (3) |
where is the viscosity coefficient, is the surface density of the accretion disk, and is the Keplerian angular frequency.
Suppose the incident radiation consists of parallel beams of soft and hard X-rays, with effective fluxes and per unit area normal to the beams, and making an angle with the normal to the disk plane. The beams are absorbed exponentially. We denote the absorption coefficient of the soft X-rays by , and that of the hard X-rays by , where is the absorption coefficient of the optical radiation.
At the optical depth , the soft and hard X-ray fluxes are attenuated to and respectively. The absorbed flux of X-rays in depth is therefore . Radiative equilibrium requires
| (4) |
where is the intensity of the optical radiation from the irradiatively heated disk at the depth in the direction .
Recall the radiative-transfer equation
| (5) |
Multiplying the above equation by a differential solid angle , integrating with respect to and using the condition of radiative equilibrium, we have
| (6) |
With appropriate boundary conditions, the radiative-transfer and radiative-equilibrium equations can be solved by the method of successive approximations (Milne 1921, 1926). In the limit of a semi-infinite plane the first-approximation solution is
| (7) | |||||
The derivation of the above equation will be presented elsewhere (Wu & Soria, in preparation).
In the second approximation, is assumed to have the same functional form as that of the first-approximation solution, i.e.
| (8) |
where , and are constants to be determined by the boundary conditions. For a semi-infinite slab opaque at optical wavelengths, the emergent radiation is the Laplace transform of , i.e.
| (9) | |||||
The condition of no inward component of at the boundary () implies
| (10) |
and
| (11) |
With these boundary conditions, we obtain from the radiative-equilibrium condition
| (12) |
Similarly, the radiative-transfer equation is integrated, yielding
| (13) |
Using the trivial conditions when and when , we can solve the radiative-equilibrium and radiative-transfer equations (12) and (13) for the constants , and , and obtain
| (14) |
| (15) |
and
| (16) |
where the two functions and are given by
| (17) |
and
| (18) |
We now define a hardness parameter and a total X-ray flux . Then, we have
| (19) |
 |
 |
 |
 |
 |
 |
5.2 The temperature-inversion layer
Using the plane-parallel model, we first investigate the temperature profile, as a function of optical depth , in the absence of radiation due to viscous dissipation in the accretion disk. In this case the temperature profile is determined purely by the soft and hard X-ray irradiation. Cold disk matter has a larger opacity for soft X-rays than for optical radiation because of bound-free absorption. Hard X-rays are not easily absorbed, and electron scattering is the main source of hard X-ray opacity. We assume a simplified situation in which the an average opacity is assigned for each waveband, and consider the parameters and for the soft and hard components respectively.
We have found that a strong temperature-inversion layer can be set up at the accretion-disk surface when the incident angle of the X-rays approaches grazing incidence (i.e. ). For normal incidence, the temperature inversion is weak and unimportant (Fig. 7a). The temperature inversion is caused mainly by soft X-ray irradiation, but the more penetrating hard X-rays tend to heat up deeper layers (Fig. 7b).
Next we investigate the situation where viscous dissipation is also present, i.e. the temperature profile is determined jointly by viscous heating in the accretion disk () and by X-ray irradiation (). We consider a particular situation in which the total flux resulting from the two processes is constant but the relative strength of the two processes varies. We show in Figure 7c the temperature profile for irradiation from a very soft X-ray source (with a hardness parameter ) at an incident angle . When the X-ray component dominates (i.e. ), a temperature-inversion layer is set up. When the X-rays are weak the temperature profile is determined by viscous heating. Figure 7d shows the corresponding temperature profile for the case in which the X-rays are hard (denoted by a hardness parameter ). The temperature profiles are similar in spite of the different relative strength of the viscous heating and irradiation heating. When the incident angle is smaller (say , see Fig. 7e), the effects due to irradiation become even less important. Although hard X-ray irradiation cannot significantly alter the overall temperature profile, it does increase the temperature uniformly at all optical depths — a direct consequence of the small opacity for hard X-rays () and of our approximation that is depth independent. It is worth noting that the apparent effects at very large optical depths (, see Fig. 7e) when the hard X-ray flux is much stronger than the viscous dissipation flux arise from the assumptions of a semi-infinite plane and single-sided illumination. The situation would be different for a finite slab with both the top and the bottom surfaces being illuminated; this model will be discussed elsewhere (Wu & Soria, in preparation).
We finally consider a situation in which the total X-ray flux is fixed at 10 times the viscous dissipation flux but its hardness is allowed to vary. This corresponds to strong X-ray irradiation with a constant bolometric X-ray luminosity and with spectral evolution. Our model shows that the temperature-inversion layer becomes more prominent as the X-ray hardness parameter decreases (Fig. 7f). Also, while the temperature at small optical depths (near the accretion-disk surface) has changed substantially, the temperature at large optical depths (in the mid-disk plane) is only modified slightly.
In summary, the vertical temperature profile of an accretion disk is sensitive to soft X-ray irradiation if the X-ray flux is stronger than the viscous dissipation flux, but it is not significantly altered by hard X-ray irradiation. Soft X-ray irradiation results in the formation of a temperature-inversion layer on the accretion-disk surface; hard X-rays tend to provide uniform heating at all depths in the disk.
5.3 Line formation
The transfer equation for non-polarised radiation in a semi-infinite plane-parallel atmosphere, with complete redistribution and consideration of non-LTE, is
| (20) |
(see Mihalas 1978). The subscripts “C” and “L” denote the continuum and the line-centre respectively. and are therefore the opacities of the continuum and line respectively. Similarly, and are the continuum and line-centre source functions. is the line profile function, and is the intensity at frequency .
Without loss of generality, we simply let (). As an approximation we can rewrite the transfer equation at the line-centre frequency as
| (21) |
where the emissivities and are related to the corresponding source functions as usual. In the neighbourhood of the line, , and therefore we have the transfer equation for the continuum
| (22) |
(e.g. Tucker 1976). It follows
| (23) |
where is the background intensity, and the total optical depth is the sum of the optical depths of the line and the continuum, i.e. . Generally, . Hence, . A line appears in emission if , and in absorption if . In a homogeneous medium, this is equivalent to a criterion for line emission and for line absorption, where
| (24) |
For systems not far away from LTE, the criterion above can be approximated by for line emission, and for line absorption. (Here, is the thermal temperature of the region where the line originates, and is the local Planck function.) An inhomogeneous medium can be considered as a stack of homogeneous strata, and the criterion above is still applicable.
As a qualitative illustration, we may consider a simple model in which the accretion disk consists of two strata: a central disk plane and a surface layer. Now, the source function of the line from the surface layer is denoted by , and the intensity of the continuum emission by . The Planck function of the surface layer is . The emission from the disk beneath can be considered as the background . For emission lines to be observed, the line-formation region is either an extended atmosphere/corona transparent to the continuum or a temperature-inversion layer above the surface of a geometrically thin and opaque accretion disk.
A corona can be considered as a geometrically extended surface layer. For certain viewing geometries (e.g. when the disk is viewed edge-on), the background disk emission is unimportant. As the corona is transparent to the continuum emission, its intensity is smaller than the local Planck function . The line emission is, however, opaque, implying that . Hence, the line-emission criterion is satisfied.
If the surface layer is geometrically thin and the disk is opaque, then cannot be neglected. Since the temperature-inversion layer has higher temperatures than the disk, . Moreover, as the temperature-inversion layer is optically thin to the continuum, . For LTE, , and the criterion is therefore satisfied, provided that the temperature of the surface layer is significantly higher than the temperature of the disk. For non-LTE, the line centre has a brightness temperature much higher than the local thermal temperature of the surface layer, and hence .
 |
 |
We now consider the temperature profiles of a region on a disk under moderate and strong irradiation of soft X-rays with various incident angles, and make use of them to investigate whether or not emission lines will be formed. In the case of moderate irradiation, we set to be 0.42 (Fig. 8, left panel). Temperature inversion is insignificant in this case, especially when the X-ray incident angle , and the temperatures at the disk mid-plane are higher than the temperatures of the surface layers. For LTE the intensity of the lines from the surface layer is roughly the local Planck function of the layer. As the intensity of the emission from the disk is roughly given by the effective temperature of the disk, there will not be emission lines in this case. If the line emission process is non-LTE, then the brightness temperature of the line is higher than the thermal temperatures of the surface layer and the disk, and hence it is possible to form emission lines.
In the case of strong X-ray irradiation () the surface layer is significantly hotter than the disk (Fig. 8, right panel). Temperature inversion is stronger for larger incident angles. As the Planck function of the temperature-inversion layer is greater than the Planck function of the disk where the optical depth is equal to unity, the lines are in emission.
5.4 Line-emission region of GX 3394
In our simple plane-parallel model we have assumed parametric X-ray opacities that scale with the optical opacity, and considered a particular case, in which and . We now examine whether or not these values are appropriate for GX 3394. The effective X-ray opacity is given by (Rybicki & Lightman 1979). The X-ray opacity is for and for (e.g. Sincell & Krolik 1997). The opacity due to electron scattering is . At – the optical opacity is mainly due to atomic bound-bound transitions. An exact treatment requires the details of atomic processes and also the chemical composition of the accreting matter (see e.g. Collin-Souffrin & Dumont 1990; Alexander, Johnson & Rypma 1983). As an approximation, we consider the Rosseland mean opacity given in Frank, King & Raine (1992), and assume that it can be used to describe the opacity of the optical/UV radiation from the accretion disk. The soft component of the X-rays from GX 3394 is a thermal black body with –. If we take , we obtain a soft X-ray opacity . The hard component is a power law extending between –. If we take a value , we have a hard X-ray opacity . The optical opacity is . Our choices of and are therefore appropriate.
 |
 |
 |
In a previous section, we have proposed that the double-peaked lines seen in GX 3394 during the high-soft state originate from a temperature-inversion layer above an irradiatively heated, Keplerian-like accretion disk. Now, we are going to use the plane-parallel model to test whether this scenario is consistent with our 1998 observations.
For black-hole binaries, most of the X-rays are emitted from a small region within 1000 Schwarzschild radii from the central black hole. The linear size of the X-ray emission region is therefore . For a system with a period greater than 12 hr, the radius of the accretion disk would extend beyond , and hence the incident angle of the X-rays on the accretion disk is close to .
In our calculation, we consider a standard Shakura-Sunyaev disk around a 7-M⊙ black hole under irradiation of X-rays at an incident angle of 87∘. We assume a viscosity parameter of for the accretion disk, and the X-ray luminosity from the central (point) source given by , where is the mass-accretion rate and the speed of light. We adopt an efficiency parameter following Frank, King & Raine (1992), and a mass-accretion rate of . Taking into account that most of the soft X-rays are reflected at grazing incidence, a reflective efficiency of 99% (see de Jong, van Paradijs & Augusteijn 1996) is assumed.
In the left panel of Figure 9 we show the temperature structure of the accretion disk illuminated by soft X-rays with a hardness ratio . Strong temperature inversion occurs at radii cm, with surface temperatures (at ) about K at cm. The effective temperature (evaluated at ) is about a factor of lower. We also show the locations of the line-emission regions deduced from the peak separations of the lines during the 1998 high-soft state, for an assumed orbital inclination of (cf. Fig. 2). The temperature distribution resulted from our model calculation is in agreement with the temperatures of the formation regions of double-peaked hydrogen and helium lines.
The middle panel of Figure 9 shows the same accretion disk but under hard X-ray irradiation. The hardness ratio is . The soft component of the X-rays is weak, and is insufficient to create a prominent temperature inversion. For LTE processes, the lines emitted from the disk should be suppressed. It is worth noting that although the composition of the X-rays is very different in the two cases, the effective temperature of the disk is similar. While the emission lines are formed in the temperature-inversion layer, the continuum emission is characterised by the effective temperature. One therefore expects that the optical brightness in the two cases will not differ significantly. Thus, our model shows that the optical continuum is relatively insensitive to the X-ray hardness, as observed in GX 3394, provided that other factors do not alter significantly when the X-ray hardness varies.
For comparison we also consider an accretion disk irradiated by moderately hard () X-rays and assume that only 50% of the X-rays are reflected (Fig. 9, right panel). As shown, the entire accretion disk is severely heated, because the energy flux deposited by the X-rays is larger than the energy flux generated by viscous heating in the disk. There is a temperature inversion at the disk surface because of a non-negligible soft component, but it is not as strong as the case where the X-rays have an overwhelmingly strong soft component. Under such severe irradiative heating by the hard X-rays, the structure of the accretion disk should deviate significantly from the structures deduced from the Shakura-Sunyaev prescription. The radiative-transfer and hydrodynamics equations must be solved simultaneously in order to obtain a self-consistent temperature structure of the accretion disk. (This is beyond the scope of the present paper.) Nevertheless, we have shown here that the accretion disk responds very differently to X-ray irradiation of different hardness.
We suspect that a prolonged low-hard state causes parts of the accretion disk in GX 3394 to be heated up. The outer disk inflates to become an extended isothermal atmosphere/corona, and the temperature-inversion layer is quenched in this region. The X-ray heating may also drive a disk wind. The Balmer lines, which are emitted from the extended atmosphere/corona or wind, lose their Keplerian-disk signature and become single-peaked (cf. Murray et al. 1995). The He II 4686 line is emitted at a smaller radial distance from the compact object, where the accreting material is still relatively confined to the disk plane, and the residual soft component of the X-rays causes a local temperature inversion. He II 4686 may therefore retain its double-peaked profile.
Although the plane-parallel model considered here produces results consistent with our spectroscopic observations of GX 3394 in the 1998 high-soft state, we are aware of its limitations. In particular, non-LTE effects are not considered. Moreover, we have assumed a “semi-grey” approach, and the atomic processes that determine the radiative equilibrium and govern the radiative transfer are not treated explicitly. The plane-parallel model is sufficient for the purpose of a qualitative illustration, but a proper study should treat all these effects in more detail.
Double-peaked lines are also observed from some black-hole candidates in quiescence, for example A0620-00. However, we suspect that the mechanism of emission is very different in the two states. We showed in §5.3 that line emission can occur in two physical conditions: either from a temperature-inversion layer on the surface of optically thick gas, or from optically thin gas; in the former case, the lines are superimposed on the continuum emission. In the case of GX339-4 in outburst, the double-peaked optical emission lines come from the irradiated surface of an optically thick disk. In the case of A062000 and similar systems in quiescence (or more generally at very low accretion rate and X-ray luminosity), the accretion disk is probably optically thin, hence it is hot. In this case, emission lines do not require a temperature-inversion layer to be formed, hence they are not caused by soft X-ray irradiation. It is worth noting that GX 3394 in quiescence (Orosz 2000, private communication) also shows Balmer emission while the brightness is at least five magnitudes lower than in the soft and hard X-ray states, suggesting that the accretion disk is optically thin in the continuum.
6 Conclusions
Our observations have shown that the profiles of the emission lines from GX 3394 are different in the high-soft and low-hard X-ray spectral states. In particular, the hydrogen Balmer lines have single-peaked profiles in the low-hard state but double-peaked profiles in the high-soft state. The He II 4686 line is doubled-peaked in both states. Our interpretation is that soft and hard X-rays have different heating effects on the accretion disk and, as a result, the line-formation mechanisms in the two X-ray states are different. We have constructed a simple plane-parallel model to illustrate the differences in the two cases. Our model has shown that a strong temperature-inversion layer can be formed when the X-rays are soft and they illuminate the disk at an angle approaching grazing incidence. If the double-peaked lines that we observed during the high-soft state are emitted from the temperature-inversion layer on a geometrically thin, opaque, Keplerian accretion disk, we deduce that GX 3394 is a low-inclination system. The orbital inclination will be about 15∘, for an orbital period of 14.8 hours.
7 Acknowledgements
We thank the referee for directing our attention to the importance of the effects of X-ray reflection. KW acknowledges the support from the Australian Research Council (ARC) through an Australian Research Fellowship and an ARC grant. RS acknowledges the support of the Research School of Astronomy and Astrophysics, Australian National University, and of the Research Centre for Theoretical Astrophysics, University of Sydney. RWH acknowledges the support from the ARC through a research grant.
References
- [1] Alexander, D. R., Johnson, H. R., Rypma, R. L., 1983, ApJ, 272, 773
- [2] Callanan, P. J., Charles, P. A., Honey, W. B., Thorstensen, J. R., 1992, MNRAS, 259, 395
- [3] Casares, J., Marsh, T. R., Charles, P. A., Martin, A. C., Martin, E. L., Harlaftis, E. T., Pavlenko, E. P., Wagner, R. M., 1995, MNRAS, 274, 565
- [4] Collin-Souffrin S., Dumont, A. M., 1990, A&A, 229, 292
- [5] Cox, D. P., Tucker, W. H., 1969, ApJ, 157, 1157
- [6] Deguchi, S., 1985, ApJ, 291, 492
- [7] de Jong, J. A., van Paradijs, J., Augusteijn, T., 1996, A&A, 314, 484
- [8] Dopita, M. A., Sutherland, R. S., 1996, ApJS, 102, 61
- [9] Dubus, G., Lasota J.-P., Hameury, J.-M., Charles, P., 1999, MNRAS, 303, 139
- [10] Fender, R. P., Spencer, R. E., Newell, S. J., Tzioumis, A. K., 1997, MNRAS, 286, L29
- [11] Fender, R. P., et al., 1999, ApJ, 519, L165
- [12] Frank, J., King, A., Raine, D., 1992, Accretion Power in Astrophysic, 2nd Edition, Cambridge University Press, Cambridge
- [13] Hannikainen, D. C., Hunstead, R. W., Campbell-Wilson, D., Sood, R. K., 1998, A&A, 337, 460
- [14] Harmon, B. A., et al., 1994, ApJ, 425, L17
- [15] Kallman, T., McCray, R., 1980, ApJ, 242, 615
- [16] Makishima, K., et al., 1986, ApJ, 308, 635
- [17] Markert, T. H., Canizares, C. R., Clark, G. W., Lewin, W. H. G., Schnopper, H. W., Sprott, G. F., 1973, ApJ, 184, L67
- [18] McClintock, J. E., 1998, in Accretion Processes in Astrophysical Systems: Some Like it Hot, eds. S. S. Holt, T. R. Kallman, AIP Conference Proceedings, 431, 290
- [19] McClintock, J. E., Canizares, C. R., Tarter, C. B., 1975, ApJ, 198, 641
- [20] Mendez, M., van der Klis, M., 1997, ApJ, 479, 926
- [21] Mihalas, D., 1978, Stellar Atmosphere, 2nd Edition, Freeman, San Francisco
- [22] Milne, E. A., 1921, MNRAS, 81, 361
- [23] Milne, E. A., 1926, MNRAS, 87, 43
- [24] Murray, N., Chiang, J., 1998, ApJ, 474, 91
- [25] Murray, N., Chiang, J., Grossman, S. A., Voit, G. M., 1995, ApJ, 451, 498
- [26] Osterbrock, D. E., 1989, Astrophysics of Gaseous Nebulae and Active Galactic Nuclei, University Science Books, Mill Valley
- [27] Rubin, B. C., Harmon, B. A., Paciesas, W. S., Robinson, C. R., Zhang, S. N., Fishman, G. J., 1998, ApJ, 492, L67
- [28] Rybicki, G. B., Lightman, A. P., 1979, Radiative Processes in Astrophysics, Wiley, New York
- [29] Schachter, J., Filippenko, A. V., Kahn, S. M., 1989, ApJ, 340, 1049. See also Erratum: Schachter, J., Filippenko, A. V. & Kahn, S. M. 1990, ApJ, 362, 379
- [30] Sincell, M. W., Krolik, J. H., 1997, ApJ, 476, 605
- [31] Smak, J., 1984, Acta Astron., 34, 161
- [32] Smith, I. A., Filippenko, A. V., Leonard, D. C., 1999, ApJ, 519, 779
- [33] Soria, R., 2000, PhD Thesis, Australian National University, Australia
- [34] Soria, R., Wu, K., Hunstead, R. W., 2000, ApJ, in press (astro-ph/9911318)
- [35] Soria, R., Wu, K., Johnston, H. M., 1999, MNRAS, 310, 71 (Paper I)
- [36] Soria, R., Wu, K., Johnston, H. M., 2000, in “19th Texas Symposium on Relativistic Astrophysics and Cosmology”, Proceeedings on CD-ROM (in press)
- [37] Tucker, W., 1976, Radiation Processes in Astrophysics, MIT Press, Cambridge
- [38] Xu, Y., McCray, R., Oliva, E., Randich, S., 1992, ApJ, 386, 181