Phase Diagram for Spinning and Accreting Neutron Stars
Phase Diagram for Spinning and Accreting Neutron Stars
Abstract
Neutron star configurations are considered as thermodynamical systems for which a phase diagram in the angular velocity () - baryon number () plane is obtained with a dividing line for quark core configurations. Trajectories of neutron star evolution in this diagram are studied for different scenarios defined by the external torque acting on the star due to radiation and/or mass accretion. They show a characteristic change in the rotational kinematics when the star enters the quark core regime. For isolated pulsars the braking index signal for deconfinement has been studied in its dependence on the mass of the star. Model calculations of the spin evolution of accreting low-mass X-ray binaries in the phase diagram have been performed for different values of the initial magnetic field, its decay time as well as initial mass and mass accretion rate. Population clustering of these objects at the line in the phase diagram is suggested as an observable signal for the deconfinement phase transition if it exists for spinnning and accreting neutron stars.
1 Neutron stars as thermodynamical systems
Quantum Chromodynamics (QCD) as the fundamental theory for strongly interacting matter predicts a deconfined state of quarks and gluons under conditions of sufficiently high temperatures and/or densities which occur, e.g., in heavy-ion collisions, a few microseconds after the Big Bang or in the cores of pulsars. The unambiguous detection of the phase transition from hadronic to quark matter (or vice-versa) has been a challenge to particle and astrophysics over the past two decades qm99 ; bkr . While the diagnostics of a phase transition in experiments with heavy-ion beams faces the problems of strong nonequilibrium and finite size, the dense matter in a compact star forms a macroscopic system in thermal and chemical equilibrium for which signals of a phase transition shall be more pronounced.
Such signals have been suggested in the form of characteristic changes of observables such as the surface temperature cool , brightness magnetar , pulse timing frido and rotational mode instabilities madsen during the evolution of the compact object. In particular the pulse timing signal has attracted much interest since it is due to changes in the kinematics of rotation. Thus it could be used not only to detect the occurrence but also to determine the size of the quark core from the magnitude of the braking index deviation from the magnetic dipole value cgpb . Besides of the isolated pulsars, one can consider also the accreting compact stars in low-mass X-ray binaries (LMXBs) as objects from which we can expect signals of a deconfinement transition in their interior cgpb ; fridonew ; accmag . The observation of quasiperiodic brightness oscillations (QPOs) klis for some LMXBs has lead to very stringent constraints for masses and radii MLP which according to strange ; bombachi could even favour strange quark matter interiors over hadronic ones for these objects. Due to the mass accretion flow these systems are candidates for the formation of the most massive compact stars from which we expect to observe signals of the transition to either quark core stars, to a third family of stars twins or to black holes. Each compact star configuratrion can be identified with a thermodynamical system characterized by the total baryon number (or mass), temperature, spin frequency and magnetic field as thermodynamical variables.
Since the evolutionary processes for the compact objects accompanying the structural changes are slow enough we will consider here the case of rigid rotation only and restrict ourselves to the degenerate systems at . The magnetic and thermal evolution of the neutron stars we will consider as decoupled from the mechanical evolution.
In this approximation we can introduce a classification of isolated and accreting compact stars in the plane of their angular frequency and mass (baryon number ) which we will call phase diagram, see Fig. 1.
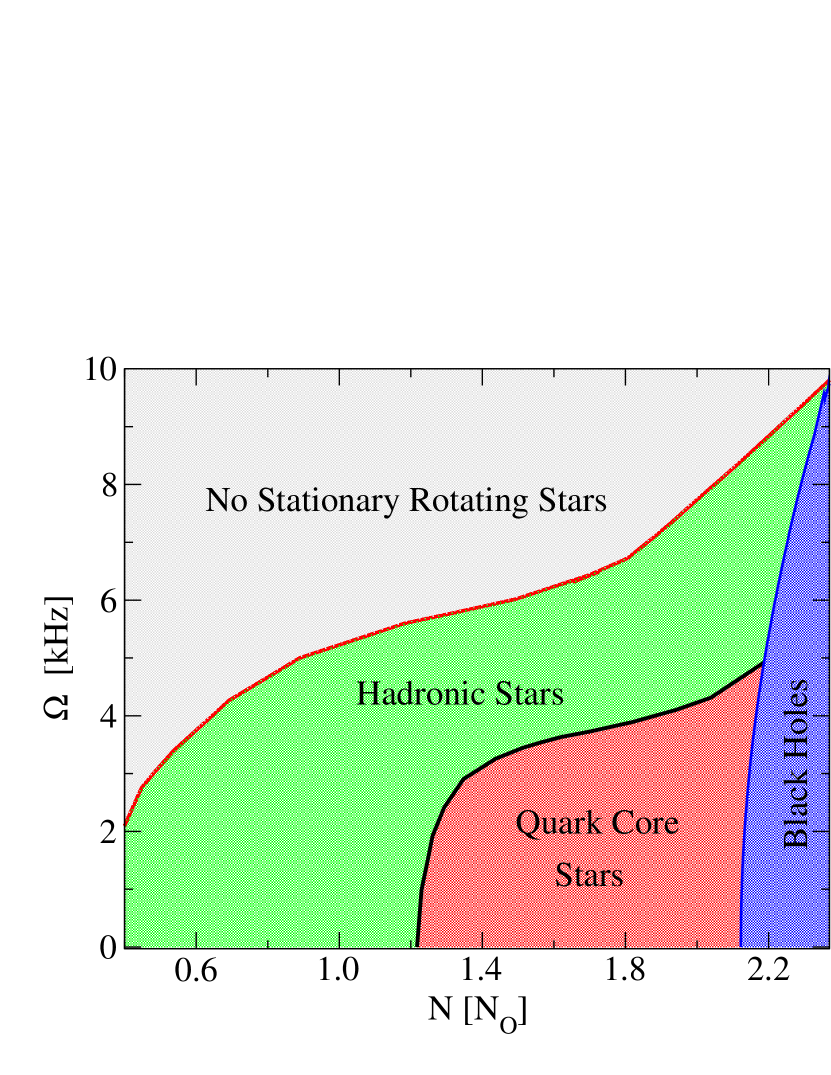
Each point in this phase diagram corresponds to a mechanical state of a neutron star. Mechanical equilibrium of thermal pressure with gravitational and centrifugal forces leads to a stationary distribution of matter inside the configuration. This distribution is determined by the central density and rotational frequency. Thermal and chemical equilibrium are described by an equation of state which determines the structure and composition of the compact star configuration.
The requirements of stability restrict the region of stability of the quasistationary rotating star configurations. From the right hand side of the phase diagram there is a line which separates a region of stars which are collapsed to black holes (BH) from the stable ones. At high baryon numbers beyond this line gravitational forces dominate over pressure and centrifugal forces of matter.
From the top of the diagram the region of stable star configurations is separated by the Keplerian frequencies from that where mass shedding under the centrifugal forces does not allow stationary rotating objects.
Inside the region of stationary rotators one can distinguish two types of stationary rotating stars: those with quark matter cores (QCSs) and hadronic stars (HS) phdiag . The region of the QCSs is expected to be located at the bottom right of the phase diagram in the region of the most massive and slowly rotating compact stars. The critical line which separates the QCS region from that of HSs is correlated with the local maxima of the moment of inertia with respect to changes of the baryon number at given angular velocity due to the change of the internal structure of the compact object at the deconfinement transition .
Using the analogy with the phase diagram of a conventional thermodynamical system we can consider trajectories in this diagram as quasistationary evolutionary processes.
Since these processes for neutron stars have characteristic time scales ( yr) much longer than those of typical observers it is almost impossible to trace these trajectories directly. A possible strategy for measuring evolutionary tracks will be to perform a statistics of the population of the different regions in the phase diagram.
Our aim is to investigate the conditions under which the passage of the phase border leads to observable significant clustering in the populations.
We will provide criteria under which a particular astrophysical scenario with spin evolution could be qualified to signal a deconfinement transition.
2 Phase diagram for a stationary rotating star model
2.1 Equation of state with deconfinement transition
Since our focus is on the elucidation of qualitative features of signals from the deconfinement transition in the pulsar timing we will use a generic form of an equation of state (EoS) with such a transition cgpb which is not excluded by the mass and radius constraints derived from QPOs. In our case as well as in most of the approaches to quark deconfinement in neutron star matter a standard two-phase description of the equation of state is applied where the hadronic phase and the quark matter phase are modelled separately. The ambiguity in the choice of the bag constant for the description of the quark matter phase can be removed by a derivation of this quantity b+99 ; bt00 from a dynamical confining approach bbkr . The resulting EoS is obtained by imposing Gibbs’ conditions for phase equilibrium with the constraints of globally conserved baryon number and electric charge glenv ; gbook ; fwbook .
Since nuclear forces are not fundamental, our knowledge about the equation of state for nuclear and neutron star matter at high densities is not very precise. There is not yet a description of the equation of state for strongly interacting matter on the fundamental level in terms of quark and gluon degrees of freedom where nucleons and mesons appear as composite structures. It is one of the goals of nuclear astrophysics and of neutron star physics to use pulsars and other compact objects as laboratories for studies of the nuclear forces and the phases of nuclear matter gbook ; fwbook . The existence of several models for the equation of state for dense stellar matter allows a variability in the phase structure of neutron stars baldo ; prakashv , therefore the phase diagram (Fig. 1) remains robust only qualitativly.
For the detailed introduction of the phase diagram and a quantitative analysis using thermodynamical methods, we will employ a particular EoS model cgpb which is characterized by a relatively hard hadronic matter part.
2.2 Configurations of rotating stars
In our model calculations we assume quasistationary evolution with negligible convection and without differential rotation which is justified when both the mass load onto the star and the transfer of the angular momentum are sufficiently slow processes.
For our treatment of rotation within general relativity we employ a perturbation expansion with respect to the ratio of the rotational and gravitational energies for the homogeneous Newtonian spherical rotator with the mass density equal to the central density, , where . This ratio is a small parameter, less than one up to the mass shedding limit cgpb .
The general form of the expansion allows us to describe the metric coefficients and the distributions of pressure, energy density and hydrodynamical enthalpy in the following form
| (1) |
where stands for one of the above mentioned quantities cgpb . The series expansion allows one to transform the Einstein equations into a coupled set of differential equations for the coefficient functions defined in (1), which can be solved by recursion. The static solutions, obeying the Oppenheimer-Volkoff equations, are contained in this expansion for the case when only the functions with superscript () remain. The other terms are corrections due to the rotation. We truncate higher order terms in this expansion and neglect the change of the frame dragging frequency, which appears at . For a more detailed description of the method and analytic results in the integral representation of the moment of inertia we refer to cgpb and to works of Hartle and Thornehartle ; thorne , Sedrakian and Chubarian chubarian ; sedrakian .

In Fig. 2 we show the critical regions of the phase transition in the inner structure of the star configuration as well as the equatorial and polar radii in the plane of angular velocity versus distance from the center of the star . It is obvious that with the increase of the angular velocity the star is deformating its shape. The maximal excentricities of the configurations with , and are , and , respectively. Due to the changes of the central density the quark core could disappear above a critical angular velocity.
It is the aim of the present paper to investigate the conditions for a verification of the existence of the critical line by observation. We will show evidence that in principle such a measurement is possible since this deconfinement transition line corresponds to a maximum of the moment of inertia, which is the key quantity for the rotational behavior of compact objects, see Fig. 3.
In the case of rigid rotation the moment of inertia is defined by
| (2) |
where the angular momentum of the star can be expressed in invariant form as
| (3) |
with being the nondiagonal element of the energy momentum tensor, the invariant volume and the determinant of the metric tensor. We assume that the superdense compact object rotates stationary as a rigid body, so that for a given time-interval both the angular velocity as well as the baryon number can be considered as global parameters of the theory. The result of our calculations for the moment of inertia (2) can be cast into the form
| (4) |
where is the moment of inertia of the static configuration with the same central density and stands for contributions to the moment of inertia from different rotational effects which are labeled by : matter redistribution, shape deformation, and changes in the centrifugal forces and the gravitational field cgpb .
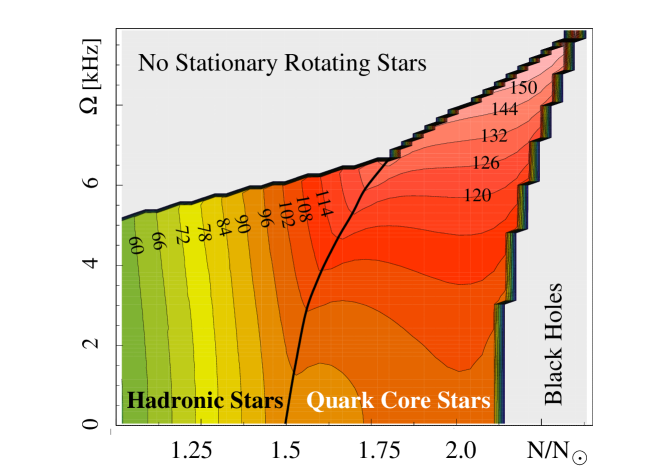
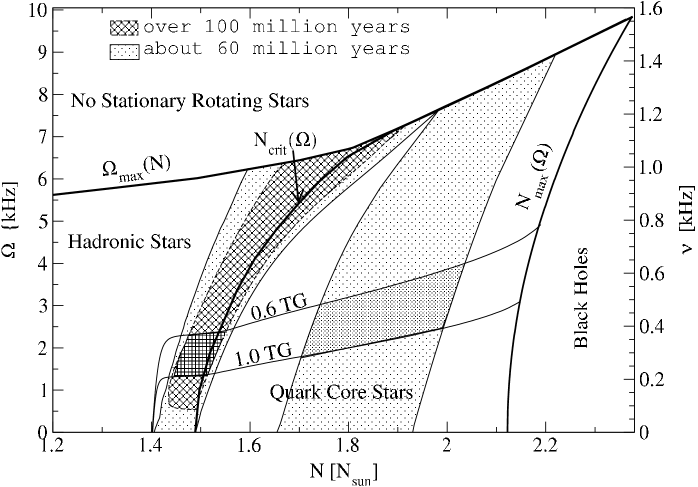
In Fig. 3 we show the resulting phase diagram for compact star configurations which exhibits four regions: (i) the region above the maximum frequency where no stationary rotating configurations are found, (ii) the region of black holes for baryon numbers exceeding the maximum value , and the region of stable compact stars which is subdivided by the critical line into a region of (iii) quark core stars and another one of (iv) hadronic stars, respectively. The numerical values for the critical lines are model dependent. For this particular model EoS due to the hardness of the hadronic branch (linear Walecka model gbook ) there is a maximum value of the baryonic mass on the critical line , such that for stars more massive than that one all stable rotating configurations have to have a quark core. This property can be seen from the dependence of the phase structure of the star on angular velocity in Fig. 2. For the whole interval of possible frequencies in the case of the quark core radius remains approximately unchanged: km.
3 Evolution scenarios with phase transitions
We want to explain why the occurence of a sharply peaked maximum for the moment of inertia in the plane entails observational consequences for the angular velocity evolution of rotating compact objects. The basic formula which governs the rotational dynamics is
| (5) |
where is the net torque acting on the star due to internal and external forces. The internal torque is given by , the external one can be subdivided into an accretion and a radiation term . The first one is due to all processes which change the baryon number, and the second one contains all processes which do not. For the example of magnetic dipole and/or gravitational wave radiation it can be described by a power law , see ghoshlamb ; shapirov .
3.1 Spin-down scenario for isolated pulsars
The simple case of the spindown evolution of isolated (non-accreting, ) pulsars due to magnetic dipole radiation would be described by vertical lines in Fig. 1. These objects can undergo a deconfinement transition if the baryon number lies within the interval , where for our model EoS the endpoints of are and . As it has been shown in cgpb , the braking index changes its value from in the region (iii) to in (iv). This is the braking index signal for a deconfinement transition introduced by frido .
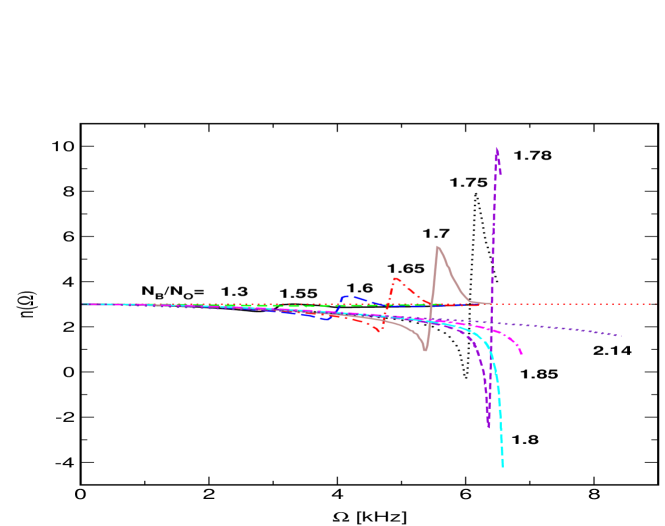
In Fig. 4 we display the result for the braking index for a set of configurations with fixed total baryon numbers ranging from up to , the region where during the spin-down evolution a quark matter core could occur for our model EOS. We observe that only for configurations within the interval of total baryon numbers a quark matter core occurs during the spin-down as a consequence of the increasing central density, see also Fig. 2, and the braking index shows variations. The critical angular velocity for the appearance of a quark matter core can be found from the minimum of the braking index . As can be seen from Fig. 4, all configurations with a quark matter core have braking indices and braking indices significantly larger than 3 can be considered as precursors of the deconfinement transition. The magnitude of the jump in during the transition to the quark core regime is a measure for the size of the quark core. It would be even sufficient to observe the maximum of the braking index in order to infer not only the onset of deconfinement () but also the size of the quark core to be developed during further spin-down from the maximum deviation of the braking index. For the model EOS we used a significant enhancement of the braking index does only occur for pulsars with periods ms (corresponding to kHz) which have not yet been observed in nature. Thus the signal seems to be a weak one for most of the possible candidate pulsars. However, this statement is model dependent since, e.g., for the model EOS used by frido , which includes the strangeness degree of freedom, a more dramatic signal at lower spin frequencies has been reported. Therefore, a more complete investigation of the braking index for a set of realistic EOS should be performed.
3.2 Scenarios with mass accretion
All other possible trajectories correspond to processes with variable baryon number (accretion). In the phase of hadronic stars, first decreases as long as the moment of inertia monotonously increases with . When passing the critical line for the deconfinement transition, the moment of inertia starts decreasing and the internal torque term changes sign. This leads to a narrow dip for in the vicinity of this line. As a result, the phase diagram gets populated for and depopulated for up to the second maximum of close to the black-hole line . The resulting population clustering of compact stars at the deconfinement transition line is suggested to emerge as a signal for the occurence of stars with quark matter cores. In contrast to this scenario, in the case without a deconfinement transition, the moment of inertia could at best saturate before the transition to the black hole region and consequently would also saturate. This would entail a smooth population of the phase diagram without a pronounced structure.
The clearest scenario could be the evolution along lines of constant in the phase diagram. These trajectories are associated with processes where the external and internal torques are balanced. A situation like this has been described, e.g. by bildsten for accreting binaries emitting gravitational waves.
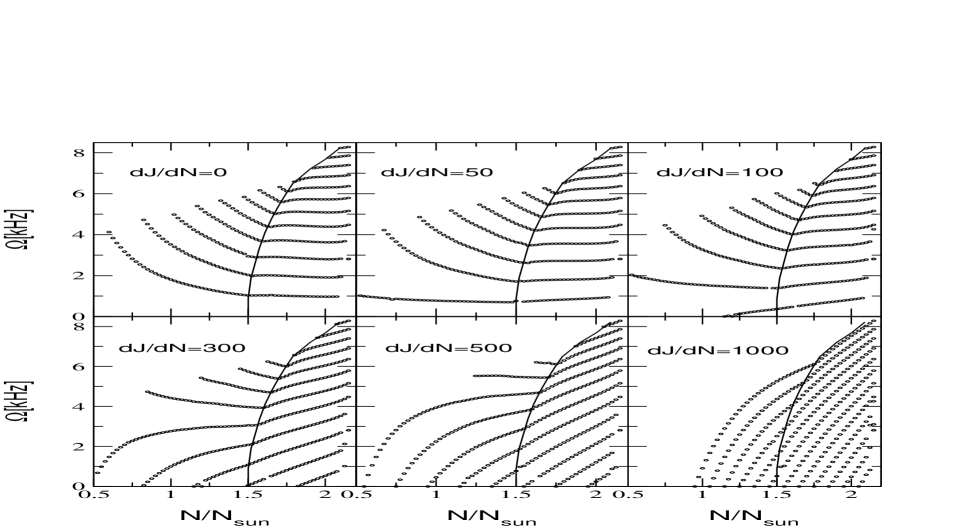
In the following we would like to explore which influence the magnitude of the external torque has on the pronouncedness of the quark matter signal. In Fig. 5 we show evolutionary tracks (dotted) of configurations in the phase diagram of Fig. 1 for different parameter values of the accretion torque and different initial values of the angular momentum.
As we have discussed above, the narrow dip for as a quark core signal occurs when configurations cross the critical line during a spin-down phase. We can quantify this criterion by introducing a minimal frequency above which spin-down occurs. It can be found as a solution of the equation for the torque balance at the phase border
| (6) |
The dependence of on shown in Fig. 6 can be used to sample accreting compact objects from the region in which the suggested quark matter signal should be most pronounced before making a population statistics.
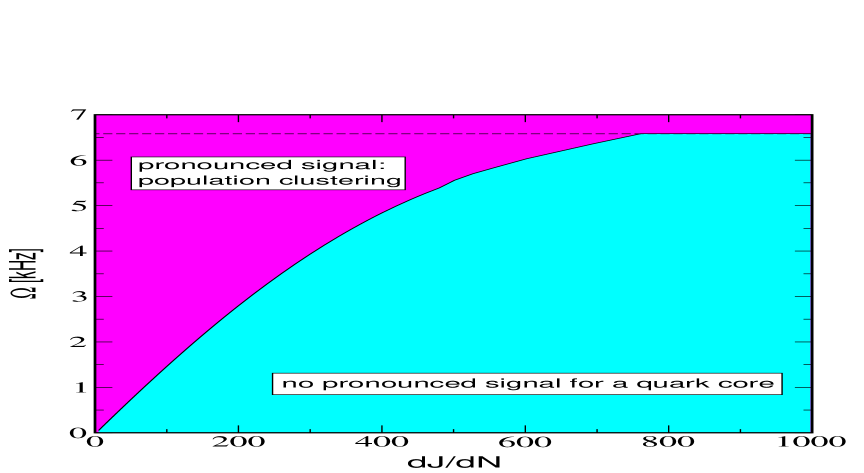
The ideal candidates for such a search program are LMXBs for which the discovery of strong and remarkably coherent high-frequency QPOs with the Rossi X-ray Timing Explorer has provided new information about the masses and rotation frequencies of the central compact object klis ; MLP . As a strategy for the quark matter search in compact stars one should perform a population statistics among those LMXBs exhibiting the QPO phenomenon which have a small and a sufficiently large angular velocity, see Fig. 6. If, e.g., the recently discussed period clustering for Atoll- and Z-sources fridonew ; bildsten will correspond to objects in a narrow region of masses, this could be interpreted as a signal for the deconfinement transition to be associated with a fragment of the critical line in the phase diagram for rotating compact stars accmag .
4 Signal for deconfinement in LMXBs
4.1 Spin-up trajectories for accretors
We consider the spin evolution of a compact star under mass accretion from a low-mass companion star as a sequence of stationary states of configurations (points) in the phase diagram spanned by and . The process is governed by the change in angular momentum of the star
| (7) |
where
| (8) |
is the external torque due to both the specific angular momentum transfered by the accreting plasma and the magnetic plus viscous stress given by , lipunov . For a star with radius and magnetic field strength , the magnetic moment is given by . The co-rotating radius is very large () for slow rotators. The inner radius of the accretion disc is
where is that value of the magnetic moment of the star for which the disc would touch the star surface. The characteristic Alfvén radius for spherical accretion with the rate is . Since we are interested in the case of fast rotation for which the spin-up torque due to the accreting plasma in Eq. (8) is partly compensated by , eventually leading to a saturation of the spin-up, we neglect the spin-up torque in which can be important only for slow rotators gl ,
From Eqs. (7), (8) one can obtain the first order differential equation for the evolution of angular velocity
| (9) |
where
| (10) |
Solutions of (9) are trajectories in the plane describing the spin evolution of accreting compact stars, see Fig. 7. Since exhibits characteristic functional dependences phdiag at the deconfinement phase transition line we expect observable consequences in the plane when this line is crossed.
In our model calculations we assume that both the mass accretion and the angular momentum transfer processes are slow enough to justify the assumption of quasistationary rigid rotation without convection. The moment of inertia of the rotating star can be defined as , where is the angular momentum of the star. For a more detailed description of the method and analytic results we refer to cgpb and the works of hartle ; thorne , as well as chubarian ; sedrakian .
The time dependence of the baryon number for the constant accreting rate is given by
| (11) |
For the magnetic field of the accretors we consider the exponential decay heuvel
| (12) |
We solve the equation for the spin-up evolution (9) of the accreting star for decay times and initial magnetic fields in the range . The remnant magnetic field is chosen to be TG1111 TG= G page .
At high rotation frequency, both the angular momentum transfer from accreting matter and the influence of magnetic fields can be small enough to let the evolution of angular velocity be determined by the dependence of the moment of inertia on the baryon number, i.e. on the total mass. This case is similar to the one with negligible magnetic field considered in cgpb ; shapirov ; colpi ; colpiv where in Eq. (9), so that only the so called internal torque term (10) remains.

In Fig. 7 we show evolutionary tracks of accretors in phase diagrams (left panels) and show the corresponding spin evolution (right panels). In the lower panels, the paths for possible spin-up evolution are shown for accretor models initially having a quark matter core ( Hz). The upper panels show evolution of a hybrid star without a quark matter core in the initial state ( Hz), containing quarks only in mixed phase. We assume a value of corresponding to observations made on LMXBs, which are divided into Z sources with yr and A(toll) sources accreting at rates yr klis ; heuvel ; gw00 .
For the case of a small magnetic field decay time yr (solid and dotted lines in Fig.7) the spin-up evolution of the star cannot be stopped by the magnetic braking term so that the maximal frequency consistent with stationary rotation can be reached regardless whether the star did initially have a pure quark matter core or not.
For long lived magnetic fields ( yr, dashed and dot-dashed lines in Fig. 7) the spin-up evolution deviates from the monotonous behaviour of the previous case and shows a tendency to saturate. At a high accretion rate (dot-dashed lines) the mass load onto the star can be sufficient to transform it to a black hole before the maximum frequency could be reached whereas at low accretion (dashed lines) the star spins up to the Kepler frequency limit.
4.2 Waiting time and population clustering
The question arises whether there is any characteristic feature in the spin evolution which distinguishes trajectories that traverse the critical phase transition line from those remaining within the initial phase.
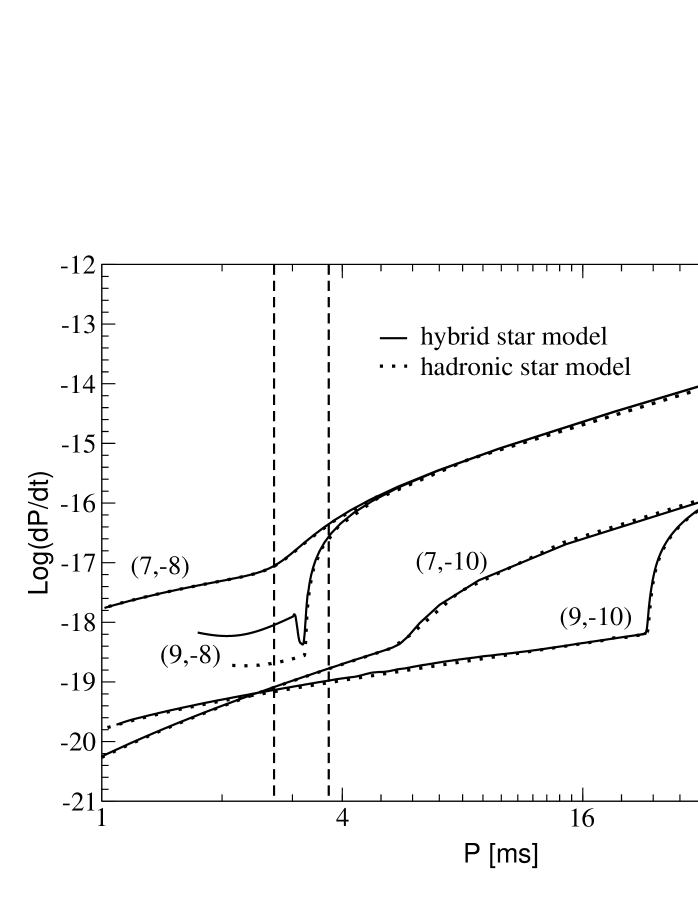
For an accretion rate as high as yr the evolution of the spin frequency in Fig. 7 shows a plateau where the angular velocity remains within the narrow region between for the decay time yr and between when yr. This plateau occurs for stars evolving into the QCS region (upper panels) as well as for stars remaining within the QCS region (lower panels). This saturation of spin frequencies is mainly related to the compensation of spin-up and spin-down torques at a level determined by the strength of the magnetic field. In order to perform a more quantitative discussion of possible signals of the deconfinement phase transition we present in Fig. 8 trajectories of the spin-up evolution in the plane for stars with and Hz in the initial state; the four sets of accretion rates and magnetic field decay times coincide with those in Fig. 7.
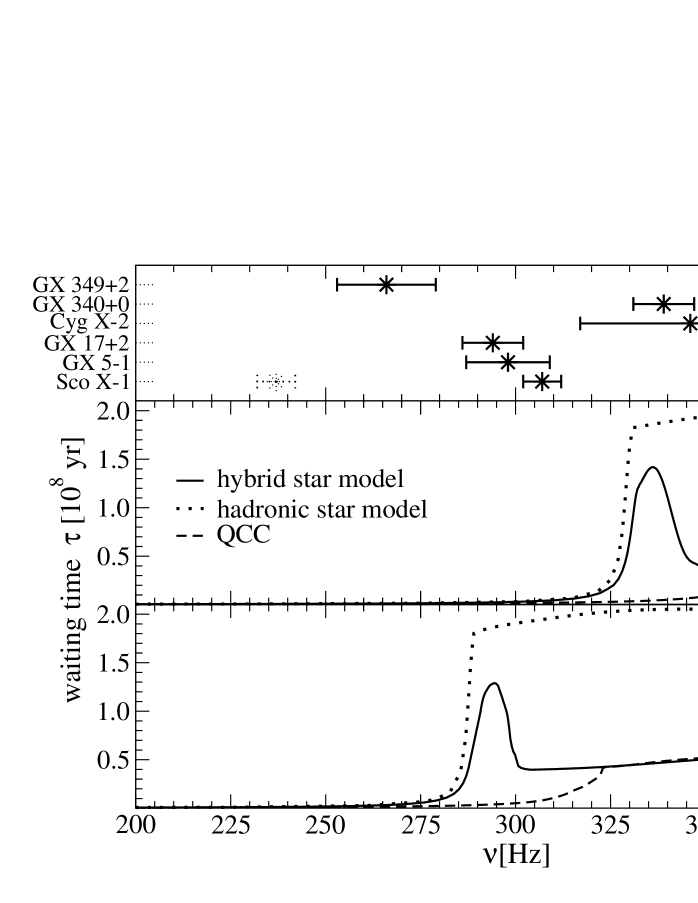
When we compare the results for the above hybrid star model (solid lines) with those of a hadronic star model (quark matter part of the hybrid model omitted; dotted lines) we observe that only in the case of high accretion rate (/yr, e.g. for Z sources) and long-lived magnetic field (yr) there is a significant difference in the behaviour of the period derivatives. The evolution of a star with deconfinement phase transition shows a dip in the period derivative in a narrow region of spin periods. This feature corresponds to a plateau in the spin evolution which can be quantified by the waiting time . In Fig. 9 (lower and middle panels) we present this waiting time in dependence on the rotation frequencies for the relevant case labeled (9,-8) in Figs. 7,8. The comparison of the trajectory for a hybrid star surviving the phase trasition during the evolution (solid line) with those of a star evolving within the hadronic and the QCS domains (dotted line and dashed lines, respectively), demonstrates that an enhancement of the waiting time in a narrow region of frequencies is a characteristic indicator for a deconfinement transition in the accreting compact star.
The position of this peak in the waiting time depends on the initial value of magnetic field, see Fig. 9. In the middle and lower panels of that Figure, we show the waiting time distribution for TG and TG, respectively. Maxima of the waiting time in a certain frequency region have the consequence that the probability to observe objects there is increased (population clustering). In the upper panel of this Figure the spin frequencies for observed Z sources in LMXBs with QPOs klis are shown for comparison. In order to interprete the clustering of objects in the frequency interval as a phenomenon related to the increase in the waiting time, we have to chose initial magnetic field values in the range for the scenario labeled (9,-8), see also the dashed lines in Fig.8.
The results of the previous section show that the waiting time for accreting stars along their evolution trajectory is larger in a hadronic configuration than in a QCS, after a time scale when the mass load onto the star becomes significant. This suggests that if a hadronic star enters the QCS region, its spin evolution gets enhanced thus depopulating the higher frequency branch of its trajectory in the plane.
In Fig. 10 we show contours of waiting time regions in the phase diagram. The initial baryon number is and the initial magnetic field is taken from the interval .
The region of longest waiting times is located in a narrow branch around the phase transition border and does not depend on the evolution scenario after the passage of the border, when the depopulation occurs and the probability to find an accreting compact star is reduced. Another smaller increase of the waiting time and thus a population clustering could occur in a region where the accretor is already a QCS. For an estimate of a population statistics we show the region of evolutionary tracks when the values of initial magnetic field are within as suggested by the observation of frequency clustering in the narrow interval , see Fig. 9.
As a strategy of search for QCSs we suggest to select from the LMXBs exhibiting the QPO phenomenon those accreting close to the Eddington limit heuvel and to determine simultaneously the spin frequency and the mass LM00 for sufficiently many of these objects. The emerging statistics of accreting compact stars should then exhibit the population clustering shown in Fig. 10 when a deconfinement transition is possible. If a structureless distribution of objects in the plane will be observed, then no firm conclusion about quark core formation in compact stars can be made.
For the model equation of state on which the results of our present work are based, we expect a baryon number clustering rather than a frequency clustering to be a signal of the deconfinement transition in the compact stars of LMXBs. The model independent result of our study is that a population clustering in the phase diagram for accreting compact stars shall measure the critical line which separates hadronic stars from QCSs where the shape of this curve can discriminate between different models of the nuclear EoS at high densities.
5 Summary and Outlook
On the example of the deconfinement transition from hadronic to quark matter we have demonstrated that the rotational frequency of accreting neutron stars is sensitive to changes of their inner structure. Overclustering of the population of Z-sources of LMXBs in the frequency-mass plane ( plane) is suggested as a direct measurement of the critical line for the deconfinement phase transition since it is correlated to a maximum in the moment of inertia of the compact star.
A generalization of the phase diagram method to other thermodynamical observables like thermal and electromagnetic processes is possible and will provide a systematical tool for the study of observable consequences of the deconfinement phase transition. A population statistics in the space of the appropriate thermodynamic degrees of freedom allows a direct measurement of the shape of hypersurfaces representing the phase border which is characteristic for the equation of state of superdense stellar matter.
In the present contribution we have considered the quasistationary evolution of accreting objects where the timescale for accreting about one solar mass and thus completing the deconfinement phase transition processes is set by the Eddington rate to be about yr. Therefore this analysis concerns rather old objects. For the cooling process, however, a characteristic timescale is the begin of the photon cooling era determined mainly by the relation of neutrino and photon emission rates. It occurs typically after yr, i.e. for much younger objects. Phase transition effects, changing the emission rates, modify cooling curves for the neutron star surface temperature typically in this time interval, see Voskresensky’s contribution to this book voskresensky .
We have focussed here on the deconfinement phase transition only. The phase diagram method for developing strategies to investigate changes in the neutron star interiors is more general and can be applied to other phase transitions too, as e.g. the transition to superfluid nuclear matter hjo , a kaon condensate schaffner or color superconducting quark matter krishnav ; schaefer ; craig with typical consequences for cooling and magnetic field evolution of the neutron star.
In order to consider the problem of magnetic field evolution in case of color superconductivity and diquark condensation one can use the phase diagram method to classify the magneto-hydrodynamical effects in the superfluid and superconducting phases, e.g. the creation of vortices in the quark core and their influence on the postglitch relaxation processes can be discussed blsed .
One can also modify the phase diagram approach to the case of self bound rotating quark stars (strange stars) bombachi . The application of our method could visualize the evolution of quark stars from normal to strange stars.
The present approach opens new perspectives for the search for an understanding of the occurence and properties of superdense stellar matter in neutron star interiors.
Acknowledgement This work of H.G. and G.P. has been supported by DFG under grant Nos. ARM 436 17/1/00 and ARM 436 17/7/00, respectively. D.B. and G.P. acknowledge a visiting Fellowship granted by the ECT* Trento. The authors thank the participants of the workshop “Physics of Neutron Star Interiors” at the ECT* Trento for many stimulating discussions.
References
- (1) Quark Matter ’99, edited by L. Riccati, M. Masera and E. Vercellin (Elsevier, Amsterdam, 1999).
- (2) Understanding Deconfinement in QCD, edited by D. Blaschke, F. Karsch and C.D. Roberts (World Scientific, Singapore, 2000).
- (3) Ch. Schaab, B. Hermann, F. Weber, and M.K. Weigel, Astrophys. J. 480, L111 (1997).
- (4) A. Dar and A. DeRújula, SGRs and AXPs - Magnetars or Young Quark Stars?, [astro-ph/0002014].
- (5) N.K. Glendenning, S. Pei and F. Weber, Phys. Rev. Lett. 79, 1603 (1997).
- (6) J. Madsen, Phys. Rev. Lett. 85, 10 (2000).
- (7) E. Chubarian, H. Grigorian, G. Poghosyan and D. Blaschke, Astron.& Astrophys. 357, 968 (2000).
- (8) N.K. Glendenning, F. Weber, “Signal of Quark Deconfinement in Millisecond Pulsars and Reconfinement in Accreting X-ray Neutron Stars”, this volume.
- (9) G. Poghosyan, H. Grigorian, D. Blaschke, Astrophys. J. Lett. 551, L73 (2001).
- (10) M. Van der Klis, Ann. Rev. Astron. Astrophys. 38, 717 (2000).
- (11) M. C. Miller, F. K. Lamb, D. Psaltis, Astrophys. J. 508, 791 (1998).
- (12) X.-D. Li, I. Bombaci, M. Dey, J. Dey, E. P. J. van der Heuvel, Phys. Rev. Lett. 83, 3776 (1999).
- (13) I. Bombaci, “Strange Quark Stars: structural properties and possible signatures for their existence”, this volume.
- (14) N.K. Glendenning, Ch. Kettner, Astron.& Astrophys. 353, L9 (1999).
- (15) D. Blaschke, H. Grigorian, G. Poghosyan, Conditions for deconfinement transition signals from compact star rotation, [astro-ph/0008005 v1].
- (16) D. Blaschke, H. Grigorian, G. Poghosian, C.D. Roberts, S. Schmidt, Phys. Lett. B 450, 207 (1999).
- (17) D. Blaschke, P.C. Tandy, in bkr , p. 218.
- (18) A. Bender, D. Blaschke, Yu. Kalinovsky, C.D. Roberts, Phys. Rev. Lett. 77, 3724 (1996).
- (19) N.K. Glendenning, Phys. Rev. D 46, 1274 (1992).
- (20) N.K. Glendenning, Compact Stars, (Springer, New York, 1997).
- (21) F. Weber, Pulsars as Astrophysical Laboratories for Nuclear and Particle Physics, (IoP Publishing, Bristol, 1999).
- (22) M. Baldo, F. Burgio, “Microscopic Theory of the Nuclear Equation of State and Neutron Star Structure”, this volume.
- (23) M. Prakash, J. M. Lattimer, J. A. Pons, A. W. Steiner, “Evolution of a Neutron Star From its Birth to Old Age,” this volume.
- (24) J.B. Hartle, Astrophys. J. 150, 1005 (1967).
- (25) J.B. Hartle, K.S. Thorne, Astrophys. J. 153, 807 (1967).
- (26) D.M. Sedrakian, E.V. Chubarian, Astrofizika 4, 239 (1968).
- (27) D.M. Sedrakian, E.V. Chubarian, Astrofizika 4, 551 (1968).
- (28) P. Ghosh, F.K. Lamb, Astrophys. J. 234, 296 (1979).
- (29) S.L. Shapiro, S.A. Teukolsky, Black Holes, White Dwarfs, and Neutron Stars, (Wiley, New York 1983).
- (30) L. Bildsten, Astrophys. J. 501, L89 (1998).
- (31) V.M. Lipunov, Astrophysics of Neutron Stars, (Springer, Berlin, 1992).
- (32) P. Ghosh, F.K. Lamb, Astrophys. J. 234, 296 (1979).
- (33) D. Bhattacharya and E.P.J. van den Heuvel, Phys. Rep. 203, 1 (1991).
- (34) D. Page, U. Geppert, T. Zannias, Astron. & Astrophys. 360, 1052 (2000).
- (35) L. Burderi, A. Possenti, M. Colpi, T. Di Salvo, N. D’Amico, Astrophys. J. 519, 285 (1999).
- (36) M. Colpi, A. Possenti, S. Popov, F. Pizzolato “Spin and Magnetism in Old Neutron Stars”, this volume.
- (37) N.K. Glendenning and F. Weber, Possible evidence of quark matter in neutron star X-ray binaries, [astro-ph/0003426].
- (38) F.K. Lamb, M.C. Miller, HEAD 32, 2401L, (2000).
- (39) D.Voskresensky, “Neutrino cooling and neutron stars medium effects”, this volume.
- (40) U. Lombardo, H.-J. Schulze, “Superfluidity in Neutron Star Matter”, this volume.
- (41) A. Ramos, J. Schaffner-Bielich, J. Wambach, “Kaon Condensation in Neutron Stars”, this volume.
- (42) M. Alford, J. A. Bowers, K. Rajagopal, “Color Superconductivity in Compact Stars”, this volume.
- (43) T. Schäfer, E. Shuryak, “Phases of QCD at High Baryon Density”, this volume.
- (44) M.B. Hecht, C.D. Roberts, S.M. Schmidt, “Diquarks in Dense Matter”, this volume.
- (45) D. Blaschke, D. Sedrakian, “Ginzburg-Landau equations for superconducting quark matter in neutron stars”, [nucl-th/0006038].