X-ray Source Populations in the Region of the Open Clusters NGC 6633 and IC 4756
Abstract
Using deep exposures ( s) with the ROSAT HRI, we have performed flux-limited surveys for X-ray sources in the vicinity of the Hyades-age open stellar clusters NGC 6633 and IC 4756, detecting 31 and 13 sources respectively. Our primary aim is to search for so-far unrecognised cluster members. We propose identifications or classifications (cluster member, field star, extragalactic field object) for the X-ray sources, based on published membership lists, and on X-ray:optical flux ratios and optical colour–magnitude diagrams. Results of simulating the expected X-ray-emitting source populations are compared with the ROSAT measurements and with the expected capabilities of the XMM mission. The simulations provide a novel method of comparing the activity levels of NGC 6633 and IC 4756 with that of the Hyades. The measurements and simulations confirm that cluster members are the major class of X-ray emitter in these fields at flux levels (0.1–2.4 keV), contributing per cent of the total X-ray sources. We find 6 possible new members in NGC 6633, and 4 candidates in IC 4756; all require further observation to establish membership probability.
keywords:
stars: X-rays – stars: late-type – open clusters and associations: individual: NGC 6633, IC 4756 – surveys1 Introduction
Open star clusters are central to the study of the evolution of stellar activity. A stellar cluster provides a coherent sample of stars in terms of age and chemical-element composition, with a range of masses and rotational velocities. Comparison between clusters allows the investigation of stellar properties with age, rotation rate, composition, and evolutionary environment. The Hyades has long served as one of the small number of ‘standard-candle’ clusters for much of the detailed study of the evolution of stellar activity, as representing stars at an age of Myr. However it is not yet established how representative is any specific cluster of a given age (see e.g. the reviews by Randich 1997; Jeffries 1999). In particular, Randich & Schmitt (1995) reported a substantial difference in the X-ray luminosity function of cool stars in Praesepe compared with the Hyades. Apart from the Hyades and Praesepe, there are only two other well-defined, reasonably compact (angular diameter ) open clusters within pc, and with ages in the range – yr (c.f. Lyngå 1987), namely NGC 6633 and IC 4756. Physical data for all four clusters can be found in Table 1. Fortuitously, NGC 6633 and IC 4756 lie within a few degrees of each other in the sky, and at comparable distances from the Sun.
| Cluster | (age) | Dist. | Ang. Diam. | Metallicity | ||||
| Name | (yr) | (pc) | (’) | [Fe/H] | () | |||
| (1) | (2) | (3) | (4) | (5) | (6) | (7) | (8) | (9) |
| NGC 6633 | 8.82 | 320 | 27 | 36.1 | 0.0 – | 0.17 | 10 | |
| IC 4756 | 8.76 | 400 | 52 | 36.4 | +0.04 | 0.19 | 10 | |
| Praesepe | 8.82 | 180 | 95 | 205.9 | +0.04 – +0.13 | 0.01 | ||
| Hyades | 8.82 | 48 | 330 | 180.1 | +0.08 – +0.13 | 0.00 |
The present work focuses on an X-ray observation of NGC 6633 from the ROSAT High Resolution Imager (HRI, Trümper et al. 1991; David et al. 1998). Our primary aim has been to survey and classify X-ray sources in the region of NGC 6633, which may be potential unrecognised cluster members, in a complementary study to the work of Harmer et al. (2000) who started from an optically-selected catalogue of likely members and searched for X-ray emission from those stars. We have performed a uniform, flux-limited survey of the X-ray sources in the HRI field containing NGC 6633, and then, using the X-ray fluxes and two-colour optical photometry, have attempted to classify each X-ray source as a likely or possible cluster member, galactic field star or extragalactic object. We have also compared the observations and proposed empirical classifications with simulations of the three main expected X-ray-emitting source populations. For cluster stars, the simulation is based on a suitably scaled model of the Hyades, thus allowing a direct, and novel, comparison of activity levels between clusters.
| ROSAT Observation | Target Name | Nominal Field Centre | Exposure | Start Date | End Date | Original | |
|---|---|---|---|---|---|---|---|
| Sequence (ROR) | RA (J2000) | Dec (J2000) | (ks) | Observer | |||
| (h m s) | (d m s) | ||||||
| rh202056a01 | NGC 6633 | 18 27 31.2 | +06 34 12 | 119 | 13 Sep 1995 | 26 Sep 1995 | J.P. Pye |
| rh202064n00 | IC 4756 | 18 38 31.2 | +05 29 24 | 88 | 16 Sep 1996 | 27 Sep 1996 | K. Singh |
We have performed a similar analysis for IC 4756, albeit with a somewhat lower exposure in the X-ray image, and with far less optical data. (This ROSAT observation has been previously analysed by Randich et al. (1998).)
The paper is organized as follows. In Section 2 we describe the X-ray observations of NGC 6633 and IC 4756, and their analysis. Section 3 discusses the methods adopted for optical identification and classification, and presents the results. The simulation of clusters (and field objects) is described in Section 4, while Section 5 extends the simulations in order to examine the potential of ESA’s XMM observatory (launched in 1999 December) for open-cluster studies. Section 6 summarizes the main points of the paper.
2 X-Ray Observations and Data Analysis
Table 2 provides a log of the ROSAT observations used in this paper. Table 3 details the sensitivity of these observations. They are among the deepest HRI exposures within ten degrees of the Galactic Plane.
2.1 NGC 6633
The ROSAT HRI photon-event list was sorted into an image of approximately arcmin2 with arcsec2 pixels, using pulse-height channels 3–8 inclusive (c.f. David et al. 1998). This image was searched for point-like sources using the PSS (Point Source Search) program from the Starlink asterix package (Allan 1992). PSS uses a maximum-likelihood statistic based on the method of Cash (1979) to determine the probability that a spatial distribution of counts arises from a fluctuation in the background, or is indicative of a real source, and to estimate source parameters (in this case, position and strength). PSS takes into account the spatial variation (off-axis broadening) of the HRI point spread function (c.f. David et al. 1998).
We modelled the image background initially by smoothing the ‘raw data’ image using a Gaussian function with full width at half maximum (FWHM) of 165 arcsec. PSS was run, and detected sources with significance 4.0 were removed from the ‘raw’ image. This source-subtracted image was Gaussian smoothed in the same way to generate the background for a second PSS run. Further iterations did not significantly change the number, significance or counts of the detected sources, so this second run was the basis for our source detections.
| Fraction of | NGC 6633 | IC 4756 | ||||
|---|---|---|---|---|---|---|
| field covered | ||||||
| 0.13 | 0.15 | 0.45 | 1.0 | 0.19 | 0.57 | 1.9 |
| 0.28 | 0.17 | 0.51 | 1.1 | 0.23 | 0.69 | 2.3 |
| 0.50 | 0.25 | 0.75 | 1.6 | 0.33 | 0.99 | 3.4 |
| 0.78 | 0.45 | 1.35 | 2.9 | 0.60 | 1.80 | 6.1 |
| 0.90 | 0.82 | 2.46 | 5.3 | 1.11 | 3.33 | 11.2 |
| 1.00 | 0.93 | 2.79 | 6.0 | 1.25 | 3.75 | 12.7 |
We generated multiple Poisson random-noise images from our second-run background map and established from PSS searches of these images that a significance threshold of 4.5 would yield less than one spurious detection within 17 arcmin of the field centre.
PSS found 32 significant detections within 17 arcmin of the centre of the image and returned a source list containing the parameterised position, 99.5 per cent positional error, significance, counts, and 1 count error for each source. A visual inspection of the image, smoothed with a 10 arcsec FWHM gaussian mask, and of the PSS significance map indicated source 28 to be spurious, part of the extended PSF of the far-offaxis bright source 29. In order to verify the PSS-computed parameters and errors, sources of known position and counts were added to random-noise background maps111 We used the asterix IMSIM program. , and PSS was used to find and parameterise the sources in these simulated fields. We found that the input count was within the computed 1 confidence interval for 80 per cent of the sources, while the input position was within the PSS-computed symmetric 99.5 per cent confidence region for only 85 per cent of the sources. An extra 3-arcsec term added in quadrature to the PSS-computed 99.5 per cent confidence region was required to correct this. We henceforth refer to this adjusted 99.5 per cent confidence region as the (positional) error circle. Effective on-axis count rates were calculated from the counts, accounting for detector dead-time, telescope vignetting and spatially-varying quantum efficiency of the detector. These count rates were converted to observed fluxes in the 0.1–2.4 keV energy band using a conversion factor () of 3.010-11 erg cm-2s-1 per HRI count s-1, as acceptable spectral fits have been found for active coronae using single-temperature Raymond-Smith models with in the range 0.5–1.5 keV, and the PIMMS program (provided by NASA’s GSFC/HEASARC) computed conversion factors of 2.810-11 and 3.110-11 erg cm-2s-1 per HRI count s-1 for Raymond-Smith models with and keV respectively (with absorption column density ). Assuming a power-law spectrum with photon-index in the range 1.8–2.2, and/or increasing to 2 changes by a factor 1.3.
The X-ray characteristics of the 32 sources detected in the NGC 6633 field are given in Table 4.
Franciosini, Randich & Pallavicini (2000) have also studied this observation, but find only 24 sources above a significance threshold of . An examination of their Figure 1 indicates that 20 of these are common to our sourcelist. The lower source count may be due to the larger pixel sizes (5” 5”) and greater range of PHA channels (3–15) they have taken to form their image. When we produced an image using their binning and PHA range and ran PSS in the manner described above, we detected only 18 sources above our 4.5 significance threshold.
| Nr | RA (J2000) | Dec (J2000) | Ecirc | Offax | Signif | C |
|---|---|---|---|---|---|---|
| (1) | (2) | (3) | (4) | (5) | (6) | (7) |
| 1 | 18 26 50.89 | + 6 41 49.0 | 9.72 | 12.58 | 4.65 | 0.39 0.10 |
| 2 | 18 26 54.70 | + 6 33 29.5 | 6.66 | 9.09 | 4.59 | 0.20 0.06 |
| 3 | 18 26 55.29 | + 6 43 04.3 | 6.24 | 12.58 | 5.13 | 0.40 0.10 |
| 4 | 18 26 59.44 | + 6 39 10.1 | 4.86 | 9.32 | 4.68 | 0.20 0.06 |
| 5 | 18 27 00.56 | + 6 28 41.7 | 4.80 | 9.39 | 6.33 | 0.30 0.07 |
| 6 | 18 27 00.64 | + 6 33 39.5 | 4.50 | 7.61 | 7.13 | 0.29 0.06 |
| 7 | 18 27 03.27 | + 6 39 52.1 | 4.62 | 8.96 | 5.95 | 0.22 0.06 |
| 8 | 18 27 07.29 | + 6 27 55.3 | 5.52 | 8.64 | 5.02 | 0.17 0.05 |
| 9 | 18 27 08.07 | + 6 35 18.0 | 5.88 | 5.85 | 5.26 | 0.18 0.05 |
| 10 | 18 27 11.57 | + 6 31 04.1 | 5.52 | 5.80 | 4.88 | 0.15 0.05 |
| 11 | 18 27 15.86 | + 6 34 04.6 | 5.40 | 3.81 | 4.74 | 0.15 0.05 |
| 12 | 18 27 18.65 | + 6 35 39.4 | 4.92 | 3.44 | 4.78 | 0.14 0.04 |
| 13 | 18 27 20.22 | + 6 38 55.2 | 5.10 | 5.45 | 4.71 | 0.15 0.05 |
| 14 | 18 27 26.26 | + 6 34 18.3 | 3.78 | 1.23 | 9.36 | 0.36 0.07 |
| 15 | 18 27 28.13 | + 6 40 32.7 | 4.14 | 6.39 | 9.39 | 0.44 0.08 |
| 16 | 18 27 35.66 | + 6 38 10.4 | 5.40 | 4.13 | 4.56 | 0.15 0.05 |
| 17 | 18 27 39.35 | + 6 25 58.1 | 4.20 | 8.48 | 8.72 | 0.38 0.07 |
| 18 | 18 27 43.36 | + 6 41 14.6 | 5.88 | 7.66 | 5.17 | 0.21 0.06 |
| 19 | 18 27 44.39 | + 6 38 53.0 | 5.10 | 5.72 | 4.75 | 0.15 0.05 |
| 20 | 18 27 45.09 | + 6 37 20.6 | 4.98 | 4.67 | 5.18 | 0.17 0.05 |
| 21 | 18 27 45.44 | + 6 29 22.0 | 3.30 | 5.99 | 20.43 | 1.14 0.11 |
| 22 | 18 27 46.72 | + 6 45 39.0 | 6.96 | 12.08 | 4.84 | 0.41 0.11 |
| 23 | 18 27 52.14 | + 6 35 11.4 | 4.98 | 5.29 | 4.71 | 0.15 0.05 |
| 24 | 18 27 52.92 | + 6 32 52.7 | 5.28 | 5.55 | 6.15 | 0.21 0.05 |
| 25 | 18 28 00.52 | + 6 31 46.9 | 5.64 | 7.67 | 5.04 | 0.18 0.05 |
| 26 | 18 28 00.96 | + 6 20 59.4 | 8.94 | 15.14 | 5.54 | 0.76 0.17 |
| 27 | 18 28 01.70 | + 6 25 46.0 | 4.68 | 11.34 | 8.45 | 0.45 0.08 |
| 28 | 18 28 17.33 | + 6 45 34.9 | 6.24 | 16.15 | 5.87 | 0.84 0.18 |
| 29 | 18 28 17.43 | + 6 46 05.4 | 5.16 | 16.53 | 10.45 | 1.64 0.20 |
| 30 | 18 28 19.59 | + 6 35 10.5 | 5.94 | 12.06 | 4.76 | 0.36 0.10 |
| 31 | 18 28 22.72 | + 6 42 31.5 | 5.28 | 15.26 | 4.90 | 0.70 0.17 |
| 32 | 18 28 24.43 | + 6 30 46.8 | 4.92 | 13.66 | 10.00 | 0.88 0.12 |
2.2 IC 4756
Randich et al. (1998) (henceforth R98) found 10 X-ray sources in the HRI image of IC 4756.
Our analysis of the ROSAT data for the IC 4756 field proceeded in a similar manner to that for NGC 6633, and we only point out the differences here. Again, a of 3.0 erg cm-2s-1 per HRI count s-1 was used to calculate absorbed fluxes. PSS found 13 sources with significance within 17 arcmin of the field centre. Their characteristics are listed in Table 5. 9 of these were detected by R98, whose numbering system appears in column 2 of Table 5. The count rates calculated by PSS average 16 per cent smaller than those quoted by R98, with a standard deviation of 13 per cent. We detected R98’s source 2 at a significance of 4.4, i.e. marginally below our threshold level of 4.5, so it is not included here.
3 Optical Identification and Classification of Sources
3.1 NGC 6633
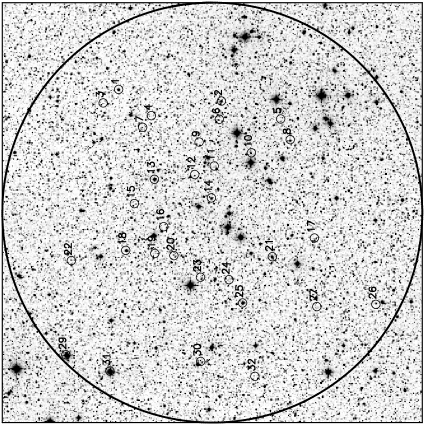
Initially a catalogue of stars in the region of NGC 6633 was compiled from the CDS SIMBAD database and a variety of previous surveys of the cluster (Kopff 1943; Hiltner, Iriarte & Johnson 1958; Vasilevskis, Klemola & Preston 1958; Sanders 1973; Jeffries 1997). This catalogue was very incomplete for , but was sufficient for an initial assessment, and in particular to check for any systematic position errors in the X-ray image. The catalogue was searched for matches within 12 arcsec of the X-ray source positions. Ten matches were found, of which 7 were known proper-motion members of the cluster, 1 was a proper-motion non-member and 2 were G-type giants (Kopff 1943) which had been assigned low probabilities of membership (Sanders 1973). Two of the proper-motion members, J25 and S359 (matched with sources 18 and 21 respectively) are recognised spectroscopic binaries (SBs) (Harmer et al. 2000). The two-dimensional difference between the X-ray-source and optical-catalogue positions was 3.5 arcsec, and any systematic offset was 0.7 arcsec, so no boresight correction was applied. Fig. 1 shows the relative positions of the detected X-ray sources, overlaid on a Digitized Sky Survey (DSS) image of the NGC 6633 HRI field, highlighting that many of the optically-brightest members of the cluster are not significant X-ray sources.
| Nr | R98 | RA (J2000) | Dec (J2000) | Ecirc | Offax | Signif | |
|---|---|---|---|---|---|---|---|
| (1) | (2) | (3) | (4) | (5) | (6) | (7) | (8) |
| 1 | 1 | 18 38 20.02 | + 5 24 59.0 | 3.93 | 5.22 | 7.85 | 0.37 0.08 |
| 2 | 3 | 18 38 31.89 | + 5 31 51.8 | 4.16 | 2.47 | 7.20 | 0.34 0.08 |
| 3 | 4 | 18 38 35.63 | + 5 34 52.4 | 3.79 | 5.58 | 10.56 | 0.62 0.10 |
| 4 | 5 | 18 38 36.94 | + 5 35 45.2 | 5.07 | 6.51 | 5.69 | 0.28 0.07 |
| 5 | 6 | 18 38 37.81 | + 5 33 59.5 | 4.03 | 4.88 | 7.79 | 0.39 0.08 |
| 6 | 18 38 40.91 | + 5 29 47.5 | 4.93 | 2.45 | 4.59 | 0.18 0.06 | |
| 7 | 18 38 47.73 | + 5 41 00.6 | 5.73 | 12.32 | 4.73 | 0.49 0.13 | |
| 8 | 7 | 18 38 50.94 | + 5 31 54.8 | 3.34 | 5.52 | 14.94 | 0.90 0.11 |
| 9 | 8 | 18 39 04.67 | + 5 19 35.0 | 5.30 | 12.88 | 8.90 | 1.01 0.16 |
| 10 | 9 | 18 39 05.55 | + 5 34 59.8 | 4.60 | 10.22 | 8.28 | 0.65 0.12 |
| 11 | 10 | 18 39 05.57 | + 5 34 24.1 | 3.80 | 9.91 | 13.85 | 1.24 0.15 |
| 12 | 18 39 16.06 | + 5 39 29.5 | 5.03 | 15.05 | 4.84 | 1.00 0.25 | |
| 13 | 18 39 21.69 | + 5 22 48.1 | 6.70 | 14.19 | 4.76 | 0.48 0.13 |
Totten, Jeffries & Hambly (2000) (henceforth TJH) have recently performed a photometric and spectroscopic study of NGC 6633, complete down to and extending down to . A search of the TJH catalogue for objects within the error circles of our X-ray sources found optical candidates for 22 sources222The giant we have identified with source 29 falls just outside its error circle, but the probability of such a bright object appearing so close to an X-ray source by chance is so small, we consider this to be the correct identification.. Photometry and positional information for these potential counterparts are listed in columns 2–6 of Table 6. For 8 X-ray sources there was more than one optical object in the error circle. We would expect a total of catalogued objects to fall into the error circles simply by chance (the majority of these fainter than 18th magnitude), suggesting several further mis-associations in addition to the eight obvious (multi-object) cases. The TJH catalogue covers 83 per cent of the entire field we are using and is incomplete for . Photometric and positional data for these bright stars (the two giants) were taken from the Tycho ACT catalogue (Urban, Corbin & Wycoff 1997), and are given in columns 2–6 of Table 6. Complete coverage of the field was found by searching the USNO-A2.0 catalogue (Monet et al. 1998), which extends down to , but is complete only to : this yielded 21 candidate identifications for 20 sources, 19 of these the same as those found from the TJH/ACT catalogues. Positional and photometric information are listed in columns 2–3 and 8–10 of Table 6. We would expect nine objects to fall into the error circles simply by chance.
In all, 26 of the 31 X-ray sources were matched with one or more potential counterpart. We tried to determine the nature of each counterpart based on X-ray and two-colour visual photometric data. Following the method used by Stocke et al. (1991) in the Einstein Medium Sensitivity Survey (EMSS), we constructed a plot of X-ray to visible flux ratio vs. colour index to try to distinguish extragalactic from galactic counterparts333 Stocke et al. (1991) advise that the distinction between galactic coronal and extragalactic sources on such a diagram will be less for ROSAT-band fluxes than for Einstein-band fluxes. Using PIMMS, we find that the extragalactic-zone boundary needs to be shifted only by 0.13 towards lower in converting from Einstein to ROSAT bands, which is smaller than the typical 1 error of 25 per cent in the X-ray flux. Fig. 3 of Motch et al. (1998) also indicates clear separation of coronal and extragalactic sources., and then plotted a colour-magnitude diagram to try to identify possible cluster members (c.f. Jeffries 1997).
Fig. 2a shows X-ray–to–visual flux ratio (listed in column 7 of Table 6) as a function of colour index ( ), for optical candidates to the X-ray sources in the NGC 6633 field. Only those candidates found in the TJH and ACT catalogues are plotted. Where there is more than one optical object within the error circle of an X-ray source, those candidates are joined by a dot-dashed line. The solid horizontal line indicates the flux ratio above which extragalactic sources are expected to dominate (cf. the EMSS results of Stocke et al. (1991)). The solid diagonal line indicates the approximate upper boundary expected for galactic coronal sources, derived from Stocke et al. (1991), Fig. 7, such that this zone contains 98 per cent of the coronal sources plotted in that figure. The parallel dashed diagonal line bounds a zone that contains 90 per cent of those sources.
We stress that the plotted flux ratios were calculated assuming no absorption and the colour indices were not corrected for reddening because absorption data are not available for many of our X-ray counterparts.
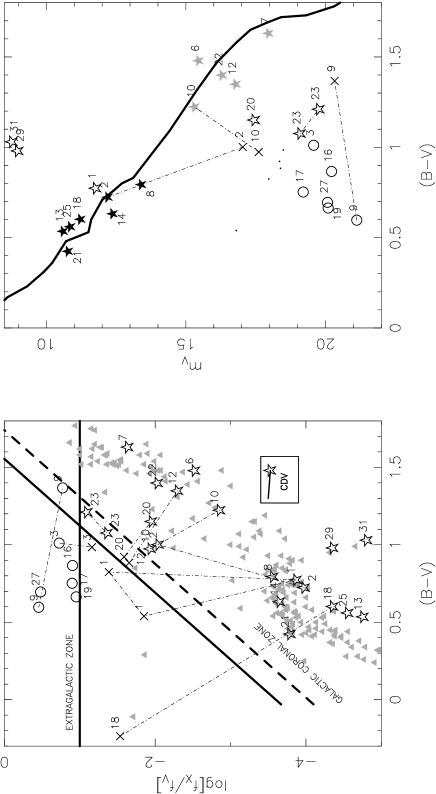
The shift of a source in Fig. 2a from the plotted (reddened) position to its intrinsic position, its dereddening vector, is nearly horizontally leftwards as the flux ratio is insensitive to absorption until of a few 1021 cm-2. Thereafter the attenuation of the optical flux dominates and gives the dereddening vector a slope in the same sense as the coronal zone boundary, but which remains shallower. Our classification of sources by their reddened positions may be erroneous for objects that fall just inside the coronal or extragalactic zone boundary, since their intrinsic positions could lie outside.
We have considered objects that lie in neither the extragalactic nor the coronal regions of Fig. 2a to be false counterparts to X-ray sources. We have plotted the Hyades members (Stern et al. 1995) as shaded triangles in Fig. 2a, which demonstrates that even the most active Hyads are not excluded from our coronal zone. The only Hyads that fall outside are white dwarfs, which we would not expect to detect through the absorbing column to NGC 6633. While X-ray binaries and CVs may also fall in this ‘No Man’s Land’ these are rather rare objects (c.f. Stocke et al. 1991; Motch et al. 1997) and we do not take further account of them here. This approach is supported by the fact that all such sources (1, 3 and 18) have other possible counterparts that fall in either the coronal or extragalactic zones, and only one source (23) with a candidate just within the coronal boundary has no alternative deeper in the coronal zone. Any alternatives to the 3 candidates (to sources 16, 17 and 19) that fall just within the extragalactic zone must be fainter and hence fall deeper in the extragalactic zone. A candidate counterpart to source 9 falls in the overlap region: it may be a highly reddened extragalactic object, or an active K-type dwarf, or a mismatch; an alternative counterpart lies deep in the extragalactic zone. In summary, we classify 17 sources as ‘coronal’, 5 as ‘extragalactic’ and one has a candidate in each zone. There are 3 cases where two possible counterparts to a source both have the same classification.
The counterparts we had not already rejected were plotted on a colour-magnitude diagram (CMD, Fig. 2b) to determine which were possible photometric members of the cluster. Dash-dotted lines connect pairs of counterparts associated with the same X-ray source. We constructed a model Main Sequence (MS) from an empirical multicolour survey of MS stars grouped by spectral type (Johnson 1966), and a numerical calculation of absolute magnitude () for each MS spectral type (Schmidt-Kaler 1982). The plotted MS has been adjusted for the reddening () and apparent distance modulus () of NGC 6633. The 7 recognised proper-motion members444We note that only 4 of our ‘proper motion members’ were included in the membership catalogue used by Harmer et al. (2000), as the other 3 fell just outside their strict criteria: two (possible equal-mass SB2) stars appear 0.2 mag above their photometric acceptance limit; the third has a membership probability slightly below their 85 per cent limit. (counterparts to sources 2, 8, 13, 14, 18, 21, 25) appear within mag. of the MS as we would expect. They are accompanied by the proper-motion non-member (source 1) already mentioned. There are also 4 fainter counterparts that are 1 mag. from the MS (candidates for sources 6, 7, 10 and 22) and 1 further candidate (to source 12) within 2 mag. of the MS. We noted these as potential photometric members of NGC 6633. In all cases where one of two possible counterparts appears close to the MS we took that identification to be the correct one, as a late-type member of an open cluster is more likely to be an X-ray emitter than an average (typically older, and in this case more distant) field star. The two giants (sources 29 and 31) are at the top of the diagram and there are two coronal sources (20, 23) well below the MS. If the source-9 candidate in the overlap zone of Fig. 2a is the correct counterpart and is a MS star, it is 3 kpc distant and has erg s-1, which is rather high for a late-type coronal source. It has (see Table 6), so must have been emitting above the saturation limit of , but cannot be ruled out from being a flaring coronal source. For classification purposes we have preferred the alternative ‘extragalactic’ counterpart.
To find counterparts in the 17 per cent of our NGC 6633 field not covered by the TJH study, we used the USNO-A2.0 catalogue. The USNO photometry is in and bands, derived from the red and blue POSS–I photographic plates. It is reported to be accurate only to within 0.2-0.3 magnitudes (Monet et al. 1998). Bright objects (V 11) have very poorly determined magnitudes in the USNO Catalogue, with many flagged as ‘probably wrong’ (denoted by asterisks in column 10 of our Table 6), but all such objects should have better photometry available in other catalogues.
19 of the candidates found previously in the TJH/ACT catalogues were also found in the USNO-A2.0 Catalogue, and there were 2 new matches: to sources 26 and 30 that were in regions not covered by the TJH survey.
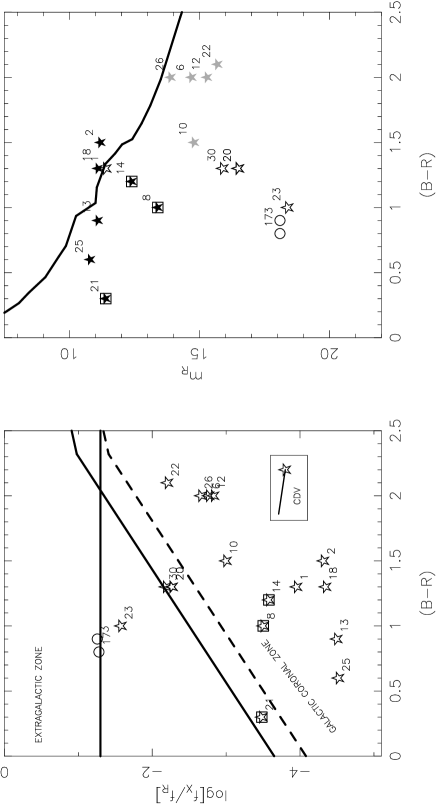
We have tested whether the USNO photometry is good enough to determine the nature of source counterparts by plotting vs and colour-magnitude diagrams for candidate counterparts to the NGC 6633 sources found in the USNO Catalogue (Fig. 3a, 3b) and comparing the results to those of the diagrams plotted using CCD photometry (Fig. 2a, 2b).
The zone boundaries in the vs diagram were adjusted for -band photometry. The coronal-zone boundary was recalculated by fitting the empirical vs values appropriate for MS stars (Johnson 1966) as a broken, linear relation555 We use MS relations because the EMSS results show that most objects near the coronal-zone boundary are fast-rotating MS stars. .
| Position | TJH‡/ACT data | USNO-A2.0 data | |||||||||||
| Nr | RA (J2000) | Dec (J2000) | Sep | - | Sep | - | Class | Name | |||||
| (1) | (2) | (3) | (4) | (5) | (6) | (7) | (8) | (9) | (10) | (11) | (12) | (13) | (14) |
| 1 | 18 26 50.92 | + 6 41 49.5 | 0.85 | 11.77 | 0.77 | -3.87 | 0.70 | 11.4 | 1.3 | -3.95 | 2.5 1.1 | C N PM | S190 |
| 18 26 50.98 | + 6 41 46.2 | 3.11 | 16.81 | 0.54 | -1.85 | M | |||||||
| 18 26 51.37 | + 6 41 49.0 | 7.13 | 17.97 | 0.82 | -1.39 | M | |||||||
| 2 | 18 26 54.75 | + 6 33 30.6 | 1.18 | 12.20 | 0.72 | -3.98 | 1.31 | 11.2 | 1.5 | -4.32 | 1.3 0.6 | C Y PM | S202 |
| 18 26 54.38 | + 6 33 27.4 | 5.14 | 17.04 | 1.00 | -2.04 | M | |||||||
| 3 | 18 26 55.46 | + 6 43 07.0 | 3.62 | 18.49 | 0.98 | -1.16 | 3.67 | 18.1 | 0.9 | -1.26 | E? | 0900-12850039 | |
| 18 26 55.45 | + 6 43 00.9 | 4.07 | 19.58 | 1.01 | -0.73 | M | |||||||
| 4 | U | ||||||||||||
| 5 | U | ||||||||||||
| 6 | 18 27 00.85 | + 6 33 42.6 | 3.81 | 15.46 | 1.48 | -2.52 | 4.41 | 14.7 | 2.0 | -2.76 | 1.9 0.6 | C Y?Ph | 0900-12854908 |
| 7 | 18 27 03.23 | + 6 39 50.2 | 2.03 | 17.96 | 1.63 | -1.64 | 1.4 0.6 | C Y Ph | |||||
| 8 | 18 27 07.54 | + 6 27 55.8 | 3.91 | 13.40 | 0.79 | -3.56 | 3.78 | 13.4 | 1.0* | -3.50 | 1.1 0.5 | C Y PM | J27 |
| 9 | 18 27 08.00 | + 6 35 16.9 | 5.12 | 21.12 | 0.60 | -0.46 | E | ||||||
| 18 27 07.78 | + 6 35 20.6 | 1.51 | 20.33 | 1.37 | -0.77 | C N Ph | |||||||
| 10 | 18 27 11.62 | + 6 31 06.5 | 2.29 | 15.31 | 1.22 | -2.85 | 2.48 | 14.8 | 1.5 | -3.00 | 1.0 0.5 | C Y Ph | 0900-12863797 |
| 18 27 11.44 | + 6 31 07.3 | 3.68 | 17.61 | 0.97 | -1.94 | M | |||||||
| 11 | U | ||||||||||||
| 12 | 18 27 18.90 | + 6 35 39.5 | 4.00 | 16.79 | 1.35 | -2.30 | 3.76 | 15.3 | 2.0 | -2.83 | 0.9 0.5 | C Y?Ph | 0900-12870017 |
| 18 27 18.85 | + 6 35 40.7 | 3.29 | 18.39 | 0.88 | -1.66 | M | |||||||
| 13 | 18 27 20.19 | + 6 38 54.5 | 0.54 | 10.60 | 0.54 | -4.76 | 0.82 | 11.1 | 0.9 | -4.50 | 0.9 0.5 | C Y PM | S279 |
| 14 | 18 27 26.40 | + 6 34 18.3 | 2.56 | 12.38 | 0.63 | -3.65 | 2.10 | 12.4 | 1.2* | -3.58 | 2.4 0.6 | C Y PM | J34 |
| 15 | U | ||||||||||||
| 16 | 18 27 35.57 | + 6 38 11.9 | 1.91 | 20.22 | 0.87 | -0.90 | E? | ||||||
| 17 | 18 27 39.47 | + 6 25 58.2 | 1.38 | 19.20 | 0.75 | -0.90 | 1.77 | 18.1 | 0.8 | -1.28 | E? | 0900-12886981 | |
| 18 | 18 27 43.43 | + 6 41 11.4 | 3.57 | 11.23 | 0.60 | -4.35 | 3.37 | 11.1 | 1.3 | -4.35 | 1.3 0.6 | C Y PM | J25 SB |
| 18 27 43.63 | + 6 41 13.1 | 4.36 | 18.27 | 0.24 | -1.54 | M | |||||||
| 19 | 18 27 44.31 | + 6 38 50.3 | 2.93 | 20.09 | 0.66 | -0.95 | E? | ||||||
| 20 | 18 27 44.87 | + 6 37 20.5 | 3.24 | 17.44 | 1.15 | -1.95 | 3.33 | 16.5 | 1.3 | -2.27 | 1.1 0.5 | C N Ph | 0900-12891233 |
| 18 27 44.84 | + 6 37 23.7 | 4.41 | 18.35 | 0.92 | -1.59 | 4.80 | 16.5 | 1.3 | -2.27 | M | 0900-12891208 | ||
| 21 | 18 27 45.49 | + 6 29 23.6 | 1.62 | 10.78 | 0.42 | -3.79 | 1.77 | 11.4 | 0.3* | -3.48 | 7.4 1.0 | C Y PM | S359 SB |
| 22 | 18 27 46.53 | + 6 45 39.8 | 2.74 | 16.30 | 1.40 | -2.03 | 3.01 | 15.7 | 2.1 | -2.21 | 2.7 1.0 | C Y Ph | 0900-12892577 |
| 23 | 18 27 51.97 | + 6 35 10.7 | 2.52 | 19.09 | 1.08 | -1.36 | 2.67 | 18.4 | 1.0 | -1.58 | 0.9 0.5 | C?N Ph | 0900-12896782 |
| 18 27 51.91 | + 6 35 11.5 | 3.42 | 19.76 | 1.21 | -1.09 | 0.9 0.5 | C?N Ph | ||||||
| 24 | U | ||||||||||||
| 25 | 18 28 00.46 | + 6 31 45.2 | 1.24 | 10.86 | 0.56 | -4.55 | 1.87 | 10.8 | 0.6 | -4.52 | 1.2 0.5 | C Y PM | S407 |
| 26 | 18 28 00.61 | + 6 20 59.3 | 5.15 | 13.9 | 2.0 | -2.66 | 4.9 1.6 | C Y?Ph | 0900-12903693 | ||||
| 27 | 18 28 01.78 | + 6 25 46.1 | 1.27 | 20.07 | 0.70 | -0.48 | E | ||||||
| 28 | Spurious detection (see text for details) | ||||||||||||
| 29 | 18 28 17.64 | + 6 46 00.0 | 6.19 | 8.98 | 0.98 | -4.35 | 6.20 | 8.3 | 4.0* | -4.57 | 10.6 1.9 | C N?PM | BD+06 3796 |
| 30 | 18 28 19.27 | + 6 35 12.3 | 5.13 | 15.9 | 1.3 | -2.18 | 2.4 0.9 | C?N Ph | 0900-12919311 | ||||
| 31 | 18 28 22.99 | + 6 42 29.1 | 4.39 | 8.77 | 1.03 | -4.81 | 4.61 | 8.0 | 3.3* | -5.05 | 4.6 1.6 | C N?PM | BD+06 3798 |
| 32 | U | ||||||||||||
To recalculate the ‘extragalactic-zone’ boundary, we used a photometric survey of 27 bright () radio galaxies (Machalski & Wiśniewski 1988) to find a mean extinction-corrected of 0.9, corresponding to a shift of from to .
When we plotted (listed in column 11 of Table 6) vs (Fig. 3a), for potential counterparts found in USNO-A2.0, all matches common with the TJH/ACT candidates were found to have the same classification, excepting the source 23 candidate, which appeared in the ‘No-Man’s Land’ region of the diagram, and not borderline coronal. Counterparts to sources 20 and 21, although still within the coronal zone, appear much closer to the coronal boundary than in Fig. 2a. The photometry of the source 21 counterpart (as those of sources 8 and 14) is flagged as ‘probably wrong’. We conclude that the USNO photometry is sufficient to determine the general classification of the source.
We plotted the counterparts found in the USNO database on an vs. colour-magnitude diagram (Fig. 3b). Note that the two giants are not plotted as their USNO values are 3.0 and ‘probably wrong’. A model MS in this band was constructed in a similar way to the Fig. 2b MS from numerical calculations (Schmidt-Kaler 1982) and empirical , colour values (Johnson 1966). The values were tested by superposing the model MS in these colours onto a plot of Praesepe members down to on a vs diagram (data from Upgren, Weis & de Luca 1979; Weis 1981; Stauffer 1982 and Mermilliod et al. 1990, converted from Kron to Johnson using colour conversions of Bessell (1987) and Fernie (1983)). A good observational fit was found. An intrinsic distance modulus () of 7.5 and absorption were taken to set the MS at the expected position for NGC 6633. Note the proper-motion members are scattered much more widely around the MS; even those whose photometry is not flagged as ‘probably wrong’ diverge by as much as 1.5 mag. (or 0.4 mag. in colour). The fainter coronal counterparts that appeared as ‘possible photometric members’ from their TJH magnitudes now mainly appear well below the MS (sources 6, 10, 12 and 22). We do not know the cause of this apparently systematic effect. We conclude that the USNO photometry is not good enough to identify sources as probable photometric members of the cluster, although the candidate counterpart to source 26 appears close enough to the MS to be interesting, and it seems sufficient to denote some stars as confident non-members – as in the case of the source 30 candidate counterpart. Our proposed classification for each source appears in column 13 of Table 6, and is based on the ACT/TJH photometry where possible. We consider these classifications to be sound for (82 per cent of the background sources are fainter than this). In a region so close to the Galactic plane, there is a strong probability of fainter objects falling into an X-ray error circle by chance. We expect to be able to identify even fainter potential cluster members (), as most (85 per cent) of the background objects have . We have calculated 0.1–2.4 keV luminosities for ‘coronal’ sources, using an intrinsic count-to-flux conversion factor () of 5.3 erg cm-2 s-1 per HRI count/s, and assuming a cluster distance of 320 pc. This factor was calculated for a 1.4 keV Raymond-Smith plasma, with cm-2 using PIMMS. A 0.86 keV plasma with the same column gives a of 4.5 erg cm-2 s-1 per HRI count/s. We list these luminosities in column 12 of Table 6, indicating upper and lower limits for foreground and background objects respectively, as appropriate. We also list errors in these values, calculated from individual count-rate errors and allowing for a 25 per cent uncertainty in and a 10 per cent uncertainty in the cluster distance. The Hipparcos parallax of NGC 6633 (Robichon et al. 1999) is based on only 4 members, and has too large an uncertainty to calculate a useful distance.
3.2 IC 4756
| ACT data | USNO-A2.0 data | ||||||||||||
|---|---|---|---|---|---|---|---|---|---|---|---|---|---|
| Nr | RA (J2000) | Dec (J2000) | Sep | - | Sep | - | Class | Name | |||||
| (1) | (2) | (3) | (4) | (5) | (6) | (7) | (8) | (9) | (10) | (11) | (12) | (13) | (14) |
| 1 | 18 38 20.36 | +05 25 00.9 | 2.52 | 14.2 | 1.5 | -2.85 | 3.8 1.2 | C Y?Ph | 0900-13330140 | ||||
| 2 | U | ||||||||||||
| 3 | 18 38 35.87 | +05 34 49.4 | 3.23 | 9.90 | 0.41 | -4.41 | 2.57 | 10.8* | 0.0 | -3.98 | 6.3 1.6 | C Y PM | BD +05 3863 |
| 4 | U | ||||||||||||
| 5 | 18 38 38.04 | +05 33 56.5 | 2.63 | 14.5 | 1.4 | -2.71 | 3.9 1.2 | C Y?Ph | 0900-13341340 | ||||
| 6 | U | ||||||||||||
| 7 | U | ||||||||||||
| 8 | 18 38 51.16 | +05 31 52.0 | 2.83 | 10.95 | 0.33 | -3.83 | 2.49 | 10.6 | 1.8 | -3.91 | 9.0 1.8 | C N PM | HSS 247 |
| 9 | 18 39 04.96 | +05 19 35.0 | 0.20 | 13.7 | 1.7 | -2.62 | 10.2 2.4 | C Y?Ph | 0900-13359235 | ||||
| 10 | 18 39 05.93 | +05 35 01.8 | 2.84 | 16.1 | 2.0 | -1.85 | 6.6 1.8 | C Y?Ph | 0900-13359846 | ||||
| 11 | 18 39 05.90 | +05 34 26.0 | 2.51 | 11.5 | 2.5 | -3.41 | 12.6 2.2 | C N Ph | GSC 0455 00727 | ||||
| 12 | U | ||||||||||||
| 13 | 18 39 22.03 | +05 22 52.0 | 4.46 | 18.1 | 1.1 | -1.18 | E? | 0900-13370352 | |||||
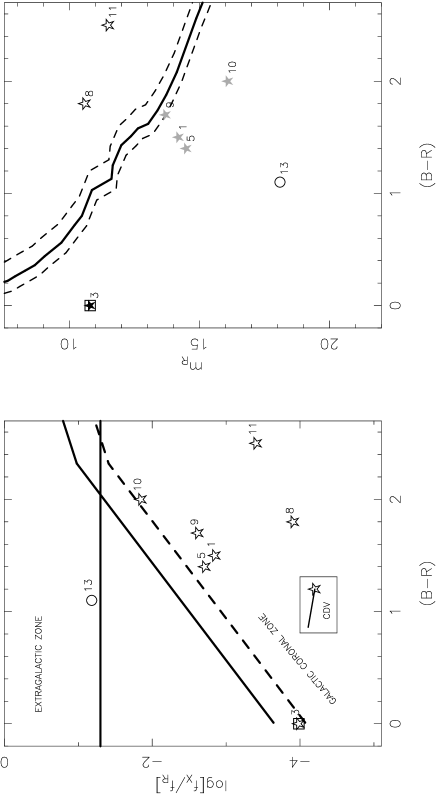
Of their 10 X-ray sources, Randich et al. (1998) could identify three with optical counterparts: one (BD +05 3863) a member of the cluster; the second (HSS 247) a galactic non-member; the third a object listed in the GSC. We have attempted, employing the method described above with the USNO-A2.0 Catalogue, to improve the identification of sources in the IC 4756 field.
The USNO-A2.0 Catalogue was searched for optical matches within 12 arcsec of the X-ray source positions; this indicated a systematic shift (of +4.3 and 0.5 arcsecs in RA and Dec respectively) that was added to each X-ray source position. The USNO-A2.0 Catalogue was then searched again for optical matches within the error circles of the X-ray sources. 8 were found and their positional and photometric data appear in columns 2–3 and 8–10 of Table 7 (there were no multiple-candidate cases). When plotted on a vs diagram (Fig. 4a), 7 are suggested as coronal sources, and one (source 13) as ‘extragalactic’. When plotted on a CMD (Fig. 4b), the coronal sources are scattered widely around an empirical MS. The positions of the counterparts to sources 1, 5 and 9 on the diagrams are similar to that of the NGC 6633 source 10, and so cannot be ruled out as potential cluster members; nor can source 10, which occupies a similar position to NGC 6633 source 22 in the CMD. BD +05 3863 — the cluster member identified as an X-ray source in R98 (and corresponding to our source 3) — sits well below the MS but its magnitudes are flagged as ‘probably wrong’ in USNO-A2.0. This star and HSS 247 — the non-member identified by R98, corresponding to our source 8 — are included in the Tycho (ACT) Catalogue (see columns 4–7 of Table 7 for data). Their positions on a vs diagram confirm their coronal nature, and both appear within 0.5 mag. of the mean MS on a V vs plot. HSS 247 has a value much larger than that expected for a main-sequence star with its Tycho photometry, despite its USNO magnitudes being unflagged. It appears that the USNO photometry of any bright star () should be treated with caution. GSC 0455 00727 — the third identification made by R98, counterpart to our source 11 — appears well above the IC 4756 MS, indicating that it is a foreground object. Our proposed classification for each source appears in column 13 of Table 7. We consider our proposed classifications to be very tentative. We calculate 0.1–2.4 keV luminosities for coronal sources, using a of 5.3 erg cm-2 s-1, and assuming a cluster distance of 400 pc, indicating upper limits for foreground objects as appropriate, and list these and associated errors (estimated as for NGC 6633) in column 12 of Table 7. The recently derived Hipparcos distance of 330 pc, based on the parallaxes of 9 members, has an associated error of 20 per cent (Robichon et al. 1999).
4 Comparisons with simulations of the Hyades
We have compared NGC 6633 and IC 4756 to the Hyades by simulating observations of the Hyades at the distance and sky position of each cluster. The X-ray luminosity of each cluster member was taken from the Hyades ROSAT All-Sky Survey (RASS) Catalogue (Stern, Schmitt & Kahabka 1995): undetected early-type stars were assigned zero luminosities, while undetected K and M dwarfs ( 0.8) were assigned luminosities at random from the Hyades pointed-survey luminosity functions (Pye et al. 1994).
We also simulated the field sources expected at the position in the sky of each cluster. We assumed the field sources would be comprised of galactic coronal sources (late-type stars) and extragalactic sources (mainly active galaxies). Galactic sources were simulated using the flux distribution () constructed by Guillout (1996), appropriate for the sky position of the simulated field. 475 sources per square degree brighter than erg cm-2 s-1 were simulated, and the X-ray flux of each was selected at random from the . Extragalactic sources were simulated using the broken power-law flux distribution () of Hasinger et al. (1993), attenuated by a galactic transmission factor (GTF 1.0) to account for absorption along the line of sight through the Galaxy. For each cluster, we used the due to atomic hydrogen (Dickey & Lockman 1990) and added the mean due to molecular hydrogen (Dame et al. 1987) in that direction, getting 3 cm-2 for NGC 6633 and 5 cm-2 for IC 4756. 685 sources per square degree brighter than erg cm-2 s-1 were simulated, and the X-ray flux of each was selected at random from the . The position of each field source was computed from a uniform random distribution.
We used PSS to construct ‘sensitivity’ maps from the NGC 6633 and IC 4756 ROSAT HRI images and backgrounds. The sensitivity map shows the minimum detectable point-source count rate at each location in the HRI image, for the selected significance threshold (as summarised in Table 3). The flux of each simulated source was compared to the value of the sensitivity map at the source position. Sources within 17 arcmin of the field centre whose flux exceeded the minimum detectable flux at their position were flagged as detections. The numbers of detected sources of each source type were compared to the samples we obtained from the HRI observations. The results are summarised in Table 8. The range in simulated field-source detections is the confidence interval of multiple simulations, while the range in simulated cluster-source detections simply applies a error to the fixed number of simulated cluster detections. Note that this is a ‘perfect’ simulation as we know a priori the type of each simulated source. We have not simulated the optical properties of the field sources, and so do not make predictions on possible errors made in classification by the method used in §3; all cluster members fall well within the coronal zone.
| NGC 6633 | IC 4756 | ||||
| Distance (pc) | 320 | 400 | |||
| Exposure time (ks) | 119 | 88 | |||
| Source Type | |||||
| ‘Coronal’ sources | 18–31 | 19 | 8–18 | 7 | |
| Cluster sources | 10–17 | 13 | 5–11 | 5 | |
| Galactic field sources | 8–14 | 6 | 4–9 | 2 | |
| ‘Extragalactic’ sources | 2–7 | 6 | 0–5 | 1 | |
| Unidentified sources | 6 | 5 | |||
| Total number of sources | 20–40 | 31 | 8–23 | 13 | |
In agreement with our simulations (Table 8), cluster members are the dominant source type in both measured fields. At first sight, the agreement between the predicted and classified numbers of cluster members is good, and suggests that NGC 6633 in particular has X-ray properties similar to our template cluster the Hyades. However, our simulation takes no account of differences in richness between clusters, i.e. the spatial density of cluster members. The incompleteness of membership lists means we can compare the richness of NGC 6633 and the Hyades only for F- and G-type stars. Harmer et al. (2000) find 15 members in the range 0.4 within 17 arcmin of the field centre. When we account for the 83 per cent coverage of the TJH study, this figure is increased to 18. Note that Harmer et al. used strict proper motion and photometric criteria for membership, and so near-equal mass binaries in particular will have been excluded from this number. We find 19 members in this colour range in the field of the Hyades at 320 pc (which includes binaries (Stern et al. 1995)) suggesting the two clusters are of similar richness (at least in F- and G-type members, although there is a 30 per cent uncertainty in the counting statistics). The agreement in detected members between our HRI study of NGC 6633 and our simulation of NGC 6633 as the Hyades at 320 pc suggests that the proportion of members that emit X-rays is similar in both clusters. This analysis does not take into account the X-ray luminosities of these detected members. Harmer et al. (2000) and Franciosini et al. (2000) both find the mean level of X-ray activity in NGC 6633 to be lower than that of the Hyades. None of the sources we classify as a member of NGC 6633 has an X-ray luminosity as high as 1030 erg s-1, so the cluster appears to be lacking a population of highly active stars like those seen in the Hyades and Praesepe.
Membership lists for IC 4756 are less complete than those for NGC 6633, but the list given in R98 suggests a richness in the aforementioned F-G-type colour range similar if not slightly lower than the Hyades (13 MS members). Given the uncertainties in the USNO-A2.0 photometry, it is difficult to make a judgement on the number of detected members in IC 4756, but the uncertain nature of 4 of our 5 classified ‘members’ may point more toward a lower than a higher activity level than that of the Hyades.
We cannot draw comparisons between the simulated and classified numbers of field sources to meaningfully constrain the number-flux distributions employed. The ratio of classified extragalactic to coronal sources is higher than expected from simulations, but the high surface density of faint stars this close to the plane (b = 8.3∘) suggests that at least half of our candidate ‘extragalactic’ associations are erroneous, reducing such sources to the status of the 5 unidentified ones. The completeness level of the TJH survey is , so these unidentified objects must have . They may still be extragalactic, or faint, red, fast-rotating coronal sources — dK or dM stars, some of which could be cluster members.
5 The Potential of XMM for studying Hyades-age Open Clusters
The problem of differing X-ray activity among coeval open clusters remains. Two hindrances are apparent: this work suggests that faint, as yet unrecognised members contribute considerably to X-ray emission from Hyades-age clusters, so the incompleteness of membership lists is the first problem. Ongoing spectroscopic and photometric work by Jeffries et al. (e.g. Totten, Jeffries & Hambly 2000) may resolve this problem for NGC 6633, and a study by Upgren et al. (Upgren, Lee & Weis 1998) should do likewise for IC 4756. Secondly, X-ray studies of these two clusters (this work; Harmer et al. 2000; R98) have demonstrated that the obtained ROSAT observations were not sensitive enough to study intermediate-age open clusters beyond the nearby Hyades, Praesepe and Coma systems down to the emission level at which comprehensive comparisons could be made. We do not know if the Hyades or Praesepe should be considered the archetype, or whether a continous spread of activity levels means there is no archetype.
We have produced a simulation to test if the recently launched XMM X-ray observatory is capable of probing NGC 6633 and IC 4756 down to a sufficiently deep activity level in a reasonable exposure time. We constructed a sensitivity map appropriate for a 5 detection threshold in a 50 ks XMM EPIC pn observation, by assuming a background rate of 2.0 count s-1 arcsec-2 and using a sliding detection cell with diameter equal to the nominal PSF HEW of 15 arcsec (vignetting is also taken into account). As in §4 with the HRI sensitivity map, our simulation of the X-ray characteristics of the Hyades at 300 pc was compared to this map to determine the detection rate of members of different spectral types, and the number of contaminating field sources detected. We find 44 cluster, 47 galactic field and 26 extragalactic field sources were detected. All 15 F- and G-type stars in the field were detected, 71 per cent of K-dwarfs and 61 per cent of M-dwarfs, indicating that such an XMM observation could reach a sensitivity comparable to that achieved by ROSAT with the Hyades.
6 Summary
We have studied deep ROSAT HRI observations of the Hyades-age open clusters NGC 6633 and IC 4756, primarily to search for unrecognised cluster members. Based on X-ray (photometric) data and high-quality (CCD) optical two-band photometry alone, we have classified the majority of the 31 sources detected in the field of NGC 6633, proposing 6 possible new members and demonstrating that field sources do not strongly confuse such efforts, down to 18.
An attempt to classify these same sources using photometry listed in the USNO-A2.0 deep, all-sky catalogue has indicated that this photometry is sufficient to distinguish coronal from extragalactic sources, but not to confidently establish photometric membership of the cluster.
We have used USNO-A2.0 to propose optical counterparts for 8 of the 13 X-ray sources detected in the field of IC 4756, and indicated 4 objects whose available photometry appears consistent with cluster membership.
A novel comparison with the Hyades has been made by predicting the number of sources the ROSAT HRI would detect if it observed the Hyades, set at the distances and galactic latitudes of NGC 6633 and IC 4756, for the respective exposure times granted those two clusters. We have found good agreement between these predicted numbers and our classified numbers of sources, with cluster members composing 40 per cent in each case. This result suggests that NGC 6633 and IC 4756 are consistent with having a similar proportion of X-ray emitting stars to the Hyades, although there is considerable uncertainty in the relative richness of these clusters, particularly for K- and M-type stars. Both clusters appear to lack the populations of highly active F- and G-stars seen in the Hyades and Praesepe.
Our simulation of an NGC 6633-distance Hyades predicts that a 50 ks XMM observation would reach activity levels in NGC 6633 similar to those probed by ROSAT in the Hyades, enabling a comprehensive comparison to be made between these intermediate-age clusters.
Acknowledgments
KRB and JPP acknowledge the financial support of the UK Particle Physics and Astronomy Research Council. This work made use of archival material from the SIMBAD and VIZIER systems at CDS, Strasbourg, and the Leicester Database and Archive Service (LEDAS). The Digitized Sky Survey was produced at the Space Telescope Science Institute, under US Government grant NAG W-2166 from the original National Geographic–Palomar Sky Survey Plates.
References
- [1] Allan D. J., 1992, asterix User note 004, Starlink, Rutherford Appleton Laboratory
- [2] Bessell H. L., Weis E. W., 1987, PASP, 99, 642
- [3] Cash W., 1979, ApJ, 228, 939
- [4] Dame T. M., et al. , 1987, ApJ, 322, 706
- [5] David L. P., Harnden F. R. J., Kearns K. R., Zombeck M. V., 1998, ROSAT High Resolution Imager Calibration Report, US ROSAT Science Center/SAO
- [6] Dickey J. M., Lockman F. J., 1990, ARAA, 28, p215
- [7] Fernie J. D., 1983, PASP, 95, 782
- [8] Franciosini E., Randich S., Pallavicini R., 2000, in Pallavicini R., Micela G., Sciortino S., eds., Stellar clusters and associations: Convection, rotation and dynamos. ASP, San Francisco, in press
- [9] Guillout P., 1996, Ph.D. thesis
- [10] Guillout P., Haywood, M., Motch, C., Robin, A. C., 1996, A&A, 316, 89
- [11] Harmer S., Jeffries R. D., Totten E. J., Pye J. P., 2000, MNRAS, submitted
- [12] Hasinger G., Burg R., Giacconi R., Hartner G., Schmidt M., Trümper J., Zamorani G., 1993, A&A, 275, 1
- [13] Heiles C., Kulkarni S., Stark A. A., 1981, ApJ, 247, 73
- [14] Hertz P., Grindlay J. E., 1984, ApJ, 278, 137
- [15] Herzog A. D., Sanders W. L., Seggewiss W., 1975, A&AS, 19, 211
- [16] Hiltner W. A., Iriarte B., Johnson H. L., 1958, ApJ, 127, 539
- [17] Jeffries R. D., 1997, MNRAS, 292, 177
- [18] Jeffries R. D., 1999, in Butler C. J., Doyle J. G., eds., Solar and Stellar Activity: Similarities and Differences, ASP 158, 75
- [19] Johnson H. L., Ann. Rev. Astron. & Astrophys. 1966, 4, 193
- [20] Kopff E., 1943, Astr. Nach., 274, 93
- [21] Lyngå G., 1987, Technical Report, Catalogue of open cluster data, 5th ed., Lund Observatory
- [22] Machalski J., Wiśniewski W. Z., 1988, MNRAS, 231, 1065
- [23] Mermilliod J.-C., Weis E. W., Duquennoy A., Mayor M., 1990, A&A, 235, 114
- [24] Monet D., et al. 1998, USNO-A V2.0, A Catalog of Astrometric Standards, U.S. Naval Observatory Flagstaff Station (USNOFS) and Universities Space Research Association (USRA) stationed at USNOFS.
- [25] Motch C., Guillout P., Haberl F., Pietsch W., Reinsch K., 1997, A&A, 318, 111
- [26] Motch C., Guillout P., Haberl F., Krautter J., Pakull M. W., Pietsch W., Reinsch K., Voges W., Zickgraf F.-J., 1998, A&AS, 132, 341
- [27] Pye J. P., Hodgkin S. T., Stern R. A., Stauffer J. R., 1994, MNRAS, 266, 798
- [28] Randich S.,1997, MmSAI, 68, 971
- [29] Randich S., Schmitt J. H. M. M., 1995, A&A, 298, 115
- [30] Randich S., Singh K. P., Simon T., Drake S. A., Schmitt J. H. M. M., 1998, A&A, 337, 372
- [31] Robichon N., Arenou F., Mermilliod J.-C., Turon C., 1999, A&A 345, 471
- [32] Sanders W. L., 1973, A&AS, 9, 213
- [33] Schmidt E. G., 1978, PASP, 90, 157
- [34] Schmidt-Kaler Th., 1982, ‘Physical parameters of the stars,’ Landolt-Börnstein Numerical data and functional relationships in science and technology, New Series, Group IV, Volume 2b, Springer-Verlag, Berlin
- [35] Stauffer J., 1982, PASP, 95, 678
- [36] Stern R. A., Schmitt J. H. M. M., Kahabka P. T., 1995, ApJ, 448, 683
- [37] Stocke J.T., Morris S. L., Gioia I. M., Maccacaro T., Schild R., Wolter A., Fleming T. A., Henry J. P., 1991, ApJS, 76, 813
- [38] Totten E. J., Jeffries R. D., Hambly N., 2000, in Pallavicini R., Micela G., Sciortino S., eds., Stellar clusters and associations: Convection, rotation and dynamos. ASP, San Francisco, in press
- [39] Trümper J., et al. , 1991, Nature, 349, 579
- [40] Upgren A. R., Weis E. W., de Luca E. E., 1979, AJ, 84, 1586
- [41] Upgren A.R., Lee J.T., Weis E.W. (Yale Observatory), A Pilot Study of the Kinematics of the Open Cluster IC 4756., AAS Meeting 193 - Austin, Texas, January 1998
- [42] Urban S.E., Corbin T.E., Wycoff G.L., 1997, The ACT Reference Catalog, U.S. Naval Observatory, Washington D.C.
- [43] Vasilevskis S., Klemola A., Preston G., 1958, AJ, 63, 387
- [44] Weis E. W., 1981, PASP, 93, 437