Chandra imaging of the complex X-ray core of the Perseus cluster
Abstract
We report subarcsec-resolution X-ray imaging of the core of the Perseus cluster around the galaxy NGC 1275 with the Chandra X-ray Observatory. The ROSAT-discovered holes associated with the radio lobes have X-ray bright rims which are cooler than the surrounding gas and not due to shocks. The holes themselves may contain some hotter gas. We map strong photoelectric absorption across the Northern lobe and rim due to a small infalling irregular galaxy, known as the high velocity system. Two outer holes, one of which was previously known, are identified with recently found spurs of low-frequency radio emission. The spiral appearance of the X-ray cooler gas and the outer optical parts of NGC 1275 may be due to angular momentum in the cooling flow.
keywords:
galaxies: individual: Perseus – cooling flows – galaxies: individual: NGC 1275 – X-rays: galaxies1 Introduction
The Perseus cluster, Abell 426, at a redshift or distance about 100 Mpc is the brightest cluster in the sky in X-rays. It hosts the nearest large cooling flow (e.g. Fabian et al 1981; Allen et al 1990; Fabian et al 1994). X-ray analysis of ASCA spectra indicates that the mass deposition rate is about (Allen et al 1999). At the centre is the galaxy NGC 1275, surrounded by a spectacular low-ionization, emission line nebula (Lynds 1970). The nucleus powers the radio source 3C84 (Pedlar et al 1990). ROSAT HRI images of the central region around NGC1275 show two ’holes’ in the X-ray emission coincident with the 0.5 arcmin sized radio lobes of 3C84 (Böhringer et al 1993). The overlap of the holes with both radio and optical images of NGC1275 have been discussed further by McNamara, O’Connell & Sarazin (1996) and the overall X-ray structure by Churazov et al (2000). Here we present Chandra observations of the core of the Perseus cluster using the ACIS-S detector, covering the energy range 0.5–7 keV.
2 The X-ray image
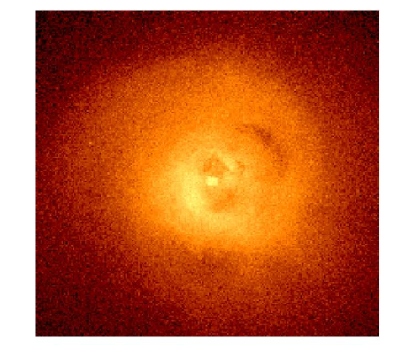
The core of the Perseus cluster was observed with the Chandra X-ray Observatory (Weisskopf et al 2000) on 2000 Jan 29 for 24,453 s. The 0.5–7 keV band image of the innermost 6.5 arcmin (195 kpc) diameter region centred on NGC1275 is shown in Fig. 1. It has been exposure-map corrected, chiefly to remove the effects of nodal readout boundary structures. These mainly consist of 2 rows of pixels running from close to the nucleus out to the west (p.a. 260 deg).
The holes in the emission associated with the inner radio lobes of 3C84 are clearly seen, as well as the larger hole to the NW, known from Einstein Observatory images (Fabian et al 1981; Branduardi-Raymont et al 1981). The inner radio holes in the 0.5–7 keV image are deep with a central surface brightness (20–25 ct arcsec-2 for the S hole and 15-30 ct arcsec-2 for the N hole) comparable to that of regions generally at a twice their radius (Fig. 2). The holes are surrounded by bright rims at about 60 to 30 ct arcsec-2 to the N and 40 to 30 in the S. The simplest interpretation is that the rims of bright emission are shells enclosing the holes. A bright patch of emission to the E, about 40 by 15 arcmin yields about 50–80 ct arcsec-2. The outer NW hole is at 7 ct arcsec-2 and is surrounded by emission at about 23 to 17 ct arcsec-2.

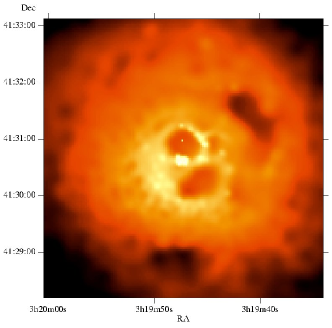
The nucleus of NGC 1275 appears slightly extended and is spectrally hard in our images. (Correction for the nodal readout boundary structures, one of which passes close to the nucleus, has artificially increased the apparent size of the nucleus in the images shown here.) We defer discussion of its structure and detailed spectrum to future work.
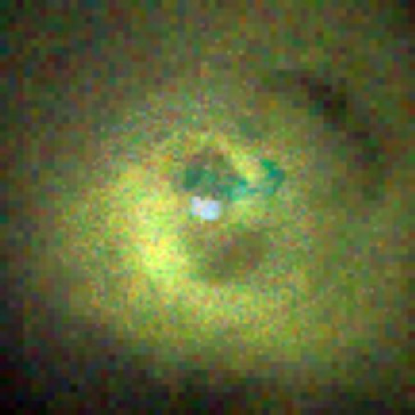
3 X-ray colour analysis
We have made soft (0.5–1 keV), medium (1–2 keV) and hard (2-7 keV) X-ray maps in order to study the X-ray colours of the inner parts of the cluster. They have been simply superimposed using the software tool GIMP to provide the colour image shown in Fig. 3. It is immediately seen that there are no strong colour gradients, apart from some patches of hard emission (blue) across the N hole and its W rim. The holes are clearly not due to absorption (or they would appear blue in Fig. 3) and the rims are not hard but moderately soft, of the same colours as the W bright patch. Inspection of separate colour images bears this last result out; the rims are not distinguishable as sharp features on a 3–7 keV image. They are therefore not shock features, contrary to the prediction of Heinz, Reynolds & Begelman (1998) and the holes are not expanding supersonically.
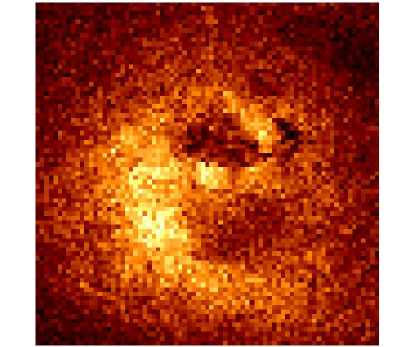
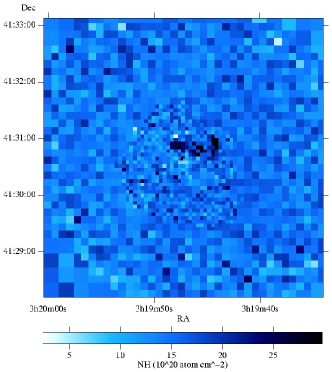
The patchy absorption structure seen across the N hole and its W rim is clearly seen in Fig. 4, which covers the 0.5–1 keV band. This structure coincides in position and length with the high-velocity emission-line nebulosity seen to the N of NGC 1275 (Unger et al 1990 and references therein). This gas is thought to be associated with a small irregular galaxy falling into the centre of the Perseus cluster at a relative velocity of . Since it is seen in absorption at 21 cm (de Young, Roberts & Saslaw 1973) and Ly (Briggs, Snijders & Boksenberg 1982), it must lie in front of NGC1275. Our discovery of extended X-ray absorption by this galaxy means that it must lie well in front of innermost regions, or such deep absorption features would not be apparent. Without knowledge of the detailed geometry of the holes and emission features we cannot establish any precise estimate of its radial distance from the centre, but note that the count rate at the bottom of the absorption patches is lower than anywhere else within the inner 2 arcmin radius. This suggest that the infalling galaxy may be more than 60 kpc from the cluster centre. The westernmost part of the absorption structure appears to be surrounded by brighter X-ray emission (Figs. 4 and 5). This could be shocked gas within the infalling galaxy.
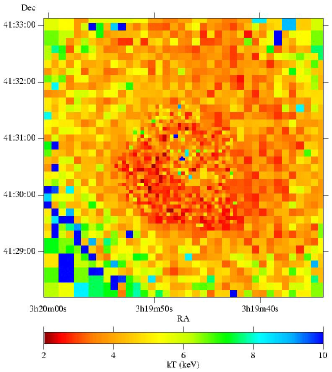
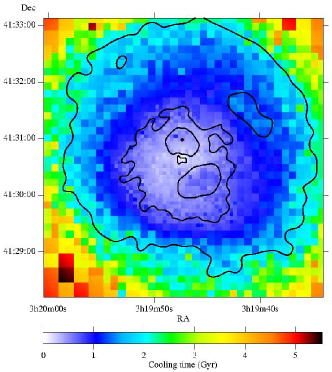
In order to quantify the temperature and absorption column-density structure in the inner parts of the image we have compared colour ratio images with tables of theoretical colour ratios. First we have adaptively binned the data, after background subtraction, using a local bin size which approximately equalizes the joint fractional error per bin (over all colours) across the image. The counts from the 3 bands in each bin then provide the colour ratios. The tables were predicted using the appropriate response matrices and auxilary responses for the S3 detector and the MEKAL spectral code in XSPEC. A metallicity of 0.4 times the cosmic value for all bins has been assumed. Temperature and column density maps have been produced by least-squares fitting of the observed colour ratios to the tables. An adaptively smoothed (Ebeling et al 1999) image is included in Fig. 5 to illustrate the various features on the scale of the temperature and column-density maps. The results confirm and quantify the appearance obtained from inspection of the separate maps. The brighter emission is due to gas which is at about 2.7 keV temperature, less than half that of the outer gas which has a temperature of about 6.5 keV, in good agreement with the ASCA results (e.g. Allen et al 2000). The infalling galaxy has a mean excess column density of about which, over the region covered, corresponds to any absorbing mass of about at cosmic abundance.
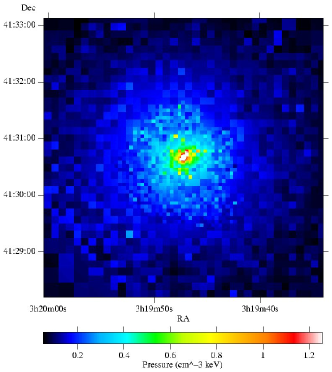
The maps have then been converted into (hot) electron density, pressure and radiative cooling-time maps using the surface brightness of the 1–2 keV map (the band with the highest count rate). The XSPEC constructed tables enable the spectral normalization of the assumed MEKAL models to be obtained and thereby the emission measure of each pixel. We have then assumed that the path length through the emitting gas is equal to the radius from the nucleus of that pixel, in order to convert the emission measure into a density. This is a gross assumption approximately correct for a symmetrical, highly-peaked emission profile. Despite the holes etc in our image it should give a rough indication of the gas properties (the density depends on the inverse square root of the path length). We note that the pressure inferred for the gas within a few kpc of the nucleus agrees with that determined from the optical [SII] line ratio by Johnstone & Fabian (1988) and Heckman et al (1989).
4 Optical and radio
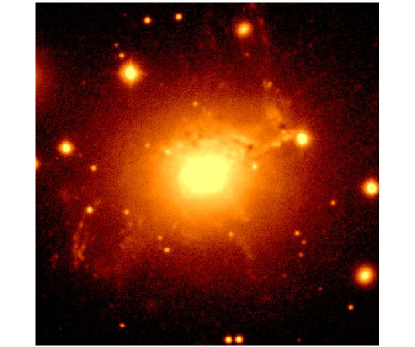
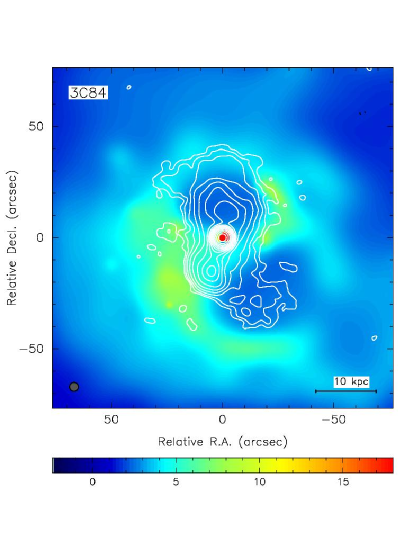
The soft X-ray image is shown next to an optical B-band image in Fig. 4. The B-band image was constructed from data obtained from the Isaac Newton Group Archive. The image is the combination of images taken on 1997 Dec 25 and 1998 Aug 22 with the Jacobus Kapteyn Telescope (JKT) using the Tek1024 detector, with a total exposure time of 17.7 ksec. The data have been bias-subtracted and flat-fielded before being combined. The correspondence between the soft X-ray absorption structure and the high velocity system in the optical image is good. There are no other obvious optical structures correlated with the X-ray image.
VLA Observations at a frequency of 1.4 GHz were combined from several runs of 3–10 hours duration each taken between 1989 and 1999 in the A, B and C configurations. The resulting radio image, shown in Fig. 7, has been restored with a 5 arcsec synthesised beam. Contour levels start at 1 mJy/beam and increase by factors of 2 to just below the peak of 21.7 Jy/beam.
We note that the steepest part of the radio contours abut the brightest part of the E patch.
5 Discussion
The overall X-ray appearance of the core of the Perseus cluster is of a broadly circularly symmetric peak centred on NGC 1275. The gas temperature decreases inward with radius, from about 6.5 to less than 3 keV, as determined from the colour ratios assuming a single phase gas. The radiative cooling time of the gas across the bright patch SE of the nucleus is about . Therefore, unless there is a balance with heating, the gas is part of a cooling flow (see Fabian 1994) and is expected to be multiphase, with the measured temperatures being an emission-weighted mean. The radiative cooling time is less than across the whole of the images shown.
The radio lobes of 3C84 occupy holes in the X-ray emission. The simplest interpretation of the low surface brightness is that they are devoid of X-ray gas and have pressure support from cosmic rays and magnetic fields. However there may be hotter gas in the holes and indeed we find that the pressure map shows little evidence for the holes (the temperature map, Fig. 5, indicates 4–5 keV for the holes; a result which is highly geometry dependent). The data are consistent with the holes being filled with pressure-supporting hotter gas. Future work involving detailed deprojection and spectral fits to the data will enable this possibility to be carefully tested.
The composition of the radio lobes is important in determining the energy content of the radio source and, using a synchrotron age, the mean power output of the central engine. We have already noted that there is no evidence for shocks so any expansion is subsonic. If the holes only contain magnetic fields and cosmic rays then the energy is approximately (assuming that the holes are spheres of radius 6 kpc each). A similar amount of work must have been done in making the holes. That work probably causes a very low frequency sound wave to propagate out from the hole region and dissipate beyond the cluster core. There is no reason that it should lead to local heating. The age of the inner holes is unclear but probably of order , from synchroton ageing estimates and also buoyancy considerations (Pedlar et al 1991; McNamara et al 2000; Churasov et al 2000). The mean power of the nucleus is then .
If the holes are just apparent and filled with hotter, lower surface brightness gas than the rims, then it is difficult to estimate the energy of the radio source. A probable lower estimate is the minimum energy one of Pedlar et al (1990), which implies a pressure for the relativistic fluid about ten times less than the local gas pressure. The magnetic fields and/or cosmic rays need not be space-filling; pressure balance is obtained if they occupy about 2 per cent of the volume. The relativistic fluid may still have a large covering factor and just pushes denser, cooler gas clouds out of the way, so that they accumulate at the edge of the lobes, forming the bright rims. The brightness of the rims relative to the surrounding region is consistent with this hypothesis (i.e. , where and are surface brightness and radius, respectively).
The origin of the outer NW hole is unclear. It could, as suggested by Churazov et al (2000), be a buoyant old radio lobe, or lobes, produced by the central engine in NGC 1275. If so then it must have considerable surface tension, presumably due to ordered magnetic fields, in order that it has not fallen apart. Perhaps the galaxy is moving slowly to the SE and shed this lobe in the past. Such a scenario could also account for the W bright patch as being where cooler X-ray emitting clouds of gas are swept up by the radio lobes.
The situation is clarified somewhat by the recent low-frequency (74 MHz) radio image of Blundell et al (2000) which shows a spur of radio emission out to the position of the outer hole (there is also some structure in the maps of Pedlar et al 1991 in this position). The low-frequency map also shows a spur to the SSE, in the direction of another hole seen in Fig. 5. Such low-frequency radio emission is likely to originate from the oldest electron populations, thereby supporting the idea that the spurs point to fossil radio lobes now devoid of energetic electrons.
Of course, some of the apparent displacement of the outer holes from the present jet (N–S) axis may be due to motion of the gas, rather than the galaxy. If there is slow rotation of the gas then this could explain the ‘swirly’ appearance of the outer gas in Fig. 1 (noted by Churazov et al 2000). It could be the remains an an earlier cooler subcluster which merged with the cluster core. The impression of a spiral structure winding inward in a clockwise sense is reinforced by similar structures apparent in optical images (see e.g. Carlson et al 1998). We note that such an overall structure is consistent with a cooling flow if the gas has some angular momentum which is roughly conserved as the slow inflow proceeds. The streamlines of the flow will be spiral rather than radial lines. These can then become apparent if the gas at radius has some large-scale inhomogeneity in the form of of wider spread of denser, cooler gas over, say, one quadrant. As the gas cools the denser gas cools fastest and as it flows inward creates an X-ray bright and cooler spiral. The optical spiral is explained by star formation from the cooled gas.
Neither movement of gas nor galaxy obviously explains however the outer S hole being along the present jet axis. The outer holes may result as much from previous beaming directions of the central engine as from its displacement. The situation resembles that around M87, as found by Böhringer et al (1995) and most recently by Owen, Eilek & Kassim (1999). If this explanation is correct then it argues against rapid spin of the central black hole being the origin of the jets. The outer holes nevertheless do provide direct evidence that the central radio source is sporadic and had earlier outbursts.
6 Acknowledgements
ACF is grateful to NASA for the opportunity to participate as an InterDisciplinary Scientist and the Chandra project for such a superb instrument. ACF, CSC and SWA thank the Royal Society for support.
References
- [] Allen S.W., Fabian A.C., Edge A.C., Johnstone R.M., Nulsen P.E.J., 1992, MNRAS, 254, 51
- [] Allen S.W., Fabian A.C., Johnstone R.M., Nulsen P.E.J., Arnaud K.A., 1999, MNRAS, submitted, astro-ph/9910188
- [] Blundell K., Kassim N., Perley R., 2000, ASP Conf. Series in press, astro-ph/0004005
- [] Böhringer H., Voges W., Fabian A.C., Edge A.C., Neumann D.M., 1993, MNRAS, 264, L25
- [] Böhringer H., Nulsen P.E.J., Braun R., Fabian A.C., 1995, MNRAS, 274, L67
- [] Briggs S.A., Snijders M.A.J., Boksenberg A., 1982, Nature, 300, 336
- [] de Young D.S., Roberts M.S., Saslaw W.C., 1973, ApJ, 185, 809
- [] Carlson M.N., et al 1998, AJ, 115, 1778
- [] Churazov E., Forman W., Jones C., Böhringer H., 2000, A&A, 356, 788
- [] Ebeling H., White D.A., Rangarajan V., 1999, MNRAS, in press
- [] Fabian A.C., Hu E.M., Cowie L.L., Grindlay J., 1981, ApJ, 248, 47
- [] Fabian A.C., 1994, ARAA, 32, 277
- [] Heckman T.M., Baum S.A., van Breugel W.J.M., McCarthy P., 1989, ApJ, 338, 48
- [] Heinz S., Reynolds C.S., Begelman M.C., 1998, ApJ, 501, 126
- [] Johnstone R.M., Fabian A.C., 1988, MNRAS, 233, 581
- [] Lynds C.R., 1970, ApJ, 159, L151
- [] McNamara B.R., O’Connell R.W., Sarazin C.L., 1996, AJ, 112, 91
- [] McNamara B.R. et al 2000, ApJ, 534,135
- [] Owen F., Eilek J., Kassim N., 1999, in ’Diffuse Thermal and Relativistic Plasmas in Galaxy Clusters’, MPE report 271, p107
- [] Pedlar A., Ghataure H.S., Davies R.D., Harrison B.A., Perley R., Crane P.C., Unger S.W., 1990, MNRAS 246, 477
- [] Unger S.W., Taylor K., Pedlar A., Ghataure H.S., Penston M.V., Robinson A., 1990, MNRAS, 242, 33P
- [] Weisskopf M.C., Tananbaum H.D., Van Spebroeck L.P., O’Dell S.L., 2000, Proc SPIE, 4012, in press astro-ph/0004127