HST infrared imaging polarimetry of Centaurus A: implications for the unified scheme and the existence of a mis-directed BL Lac nucleus111Based on observations with the NASA/ESA Hubble Space Telescope, obtained at the Space Telescope Science Institute, which is operated by AURA, Inc., under NASA contract NAS 5-26555 and by STScI grant GO-3594.01-91A
Abstract
We report results from HST/NICMOS 2 imaging polarimetry of the central region of Centaurus A. In the vicinity of the nucleus we observe a complex polarization structure which we explain by a combination of scattering of nuclear light and dichroic polarization associated with the dust lane. The scattered nuclear radiation is found in an angular region which extends over and thus it does not originate from a highly collimated beam, but is associated with more omni-directional nuclear illumination. These observations also show the presence of an unresolved, highly polarized (P = 11.1%) nuclear source whose polarization angle is perpendicular to the jet axis. We set an upper limit of 0.8 pc) to its extent. The observed nuclear polarization is naturally accounted for if we are observing scattered light from an otherwise obscured nucleus provided that both the scattering region and the occulting torus are extremely compact, with an outer radius of less than pc. Alternatively, we might be directly seeing the infrared counterpart of the radio core, similar to those found in other low luminosity radio-galaxies observed with HST. We discuss these results in the framework of the FR I / BL Lac unifying model.
keywords:
Galaxies - individual (NGC 5128=Centaurus A); Galaxies - active; PolarizationCapetti et al. \rightheadHST Infrared imaging polarimetry of Cen A
and
1 Introduction
Centaurus A (= NGC5128) is the nearest active galaxy, and both the AGN and the jet have been the subject of extensive studies in all wavelength bands from radio through gamma rays. Radio observations provide strong upper limits on the size of the central source - at 0.5 0.1 milliarcsec (0.01pc), it is the smallest known extragalactic radio source (Kellerman, Zensus & Cohen 1997). Because of the heavy obscuration due to the dust lane, it is very difficult to study the AGN itself at high spatial resolution in the optical. Ground-based IR observations have provided evidence for a strong, highly polarized source at the nucleus (cf. [Bailey et al. 1986], [Packham et al. 1996]) and Bailey et al. suggested that Cen A contained a low luminosity, mis-directed BL Lac source. Further evidence for this hypothesis came from the conclusions of Morganti et al. (1991), that the blue filaments in the jet are photo-ionized by a relativistically beamed continuum source. Conversely, Antonucci and Barvainis (1990) attributed the observed polarization to scattering of nuclear light. While similarly arguing for scattering as the source of the polarization, Packham et al. (1996) suggested that Cen A could still be a BL Lac type object.
High resolution polarimetry of this nearest AGN is important not only to the understanding of AGN in general, but to verifying the unified model and more specifically, the suggestion that Fanaroff-Riley type I radio galaxies provide the parent population for BL Lac objects (cf. Urry & Padovani 1995). Previous Hubble Space Telescope (WFPC-1) R band imaging polarimetry of the inner region of NGC5128 ([Schreier et al. 1996]) failed to reveal any details of the polarization structure at the nucleus because of its extreme reddening but identified a small region of polarization with a scattering knot southwest of the nucleus. Subsequent Near Infrared Camera and Multi-Object Spectrometer (NICMOS) observations revealed the existence of a nuclear point source which could also be identified in the optical images of the Wide Field Planetary Camera (WFPC2) allowing its flux to be determined from V through K (Marconi et al. 2000). NICMOS narrow band imaging in Pa and FeII lead to the discovery of an elongated structure which was interpreted as a 20 pc radius ionized gas circumnuclear disk (Schreier et al. 1998).
We report here HST (NICMOS) polarimetric observations at 2 which allow us to map the polarization structure in the vicinity of the nucleus at much higher resolution (0\farcs3) than previously possible. HST’s improved spatial resolution over the ground, and NICMOS’s sensitivity and polarimetric capability at 2 allow us to isolate the polarized nuclear component, and to study the effects of the AGN on its nearby environment. We summarize the observations and data reduction in Section 2 and the analysis and observed results in Section 3. The interpretation of the off-nuclear polarization structure is presented in Section 4. The origin of the polarized nuclear emission, and the implications for the AGN unified scheme, are discussed in Sections 5 and 6. Summary and conclusions are given in Section 7. Throughout, we assume a distance to Centaurus A of 3.5 Mpc ([Hui et al. 1993]), whence 1\arcsec17pc.
2 Observations and Data Reduction
The nuclear region of NGC 5128 was observed on May 6, 1998 using NICMOS Camera 2 with the long wavelength polarizers. The bandpass of the polarizers covers the spectral range 1.9 - 2.1 and their principal axes of transmission are nominally oriented at PA 0, 120 and 240 degrees. The spatial resolution is 0\farcs075/pixel and the field of view of the camera is 19\farcs4 19\farcs4 (256 256 pixels.) All observations were carried out with a MULTIACCUM sequence ([MacKenty et al. 1997]), i.e. the detector is read out non-destructively several times during each integration to facilitate removal of cosmic rays and saturated pixels. The data were re-calibrated using the pipeline software CALNICA v3.0 ([Bushouse et al. 1997]) and the best reference files in the Hubble Data Archive to produce flux calibrated images. Bad pixels were removed interpolating from values of neighboring pixels.
The observing strategy used varying integration times from 16s to 960s for each polarizer, to allow for potential saturation, caused by the bright IR nucleus. Repeating the observation sets with all polarizers in each of 4 orbits, allowed the removal of time dependent effects. The highest count rate observed is 330 c/s per pixel; even for the longest exposure times, the total counts only reach in each of the 25 individual read-outs, well below the saturation limit of and within the linearity regime of the camera. Thus, all the observations are within the linear regime of the camera. This is confirmed by comparing the short and long exposure images, which reveal no significant differences in observed count rates. We present results from the analysis of the set of 12 images obtained with the longest (960s) exposure times, one for each of the three polarizers, taken in four subsequent orbits.
A drift in the bias level is known to be present in the NICMOS images and this results in spatially dependent residuals in the calibrated images (the “pedestal” problem, [Skinner at al. 1997]). We estimated the effects of the pedestal on our observations by comparing images taken with each polarizer in different orbits. The differences between the images are always smaller than 0.5 %. We thus estimate that the presence of the pedestal could translate into a spurious polarization on an otherwise unpolarized source of less than 0.6 %.
A bright star is clearly visible in the field of view, southwest of the nucleus, as in all previous HST images of Cen A. We used the position of this star to check the alignment of the individual images. Shifts between images taken with the different polarizers are negligible, 0.03 pixels. There is a small drift between images taken in different orbits, amounting to a total of 0.12 pixels from the first to the fourth orbit. The point-spread functions in the three polarizers do not show significant differences.
After registration, images were co-added and combined to produce the final polarization maps. Preflight thermal vacuum tests showed that the transmission of the polarizers is not identical and that they are offset from their nominal position angles (Hines, Schmidt & Lytle 1997). Polarization parameters were then estimated using the algorithm developed by Sparks and Axon (1999) which deals with this non ideal instrumental configuration and which allowed us to derive the Stokes parameters and, finally, the polarization images.
The vacuum tests also showed that any instrumental NICMOS polarization is . On-orbit calibration observations of the polarized star CHA-DC-F7 produce values that agree with 2 ground based observations within 0.2% at the 1% polarization level.
3 Results
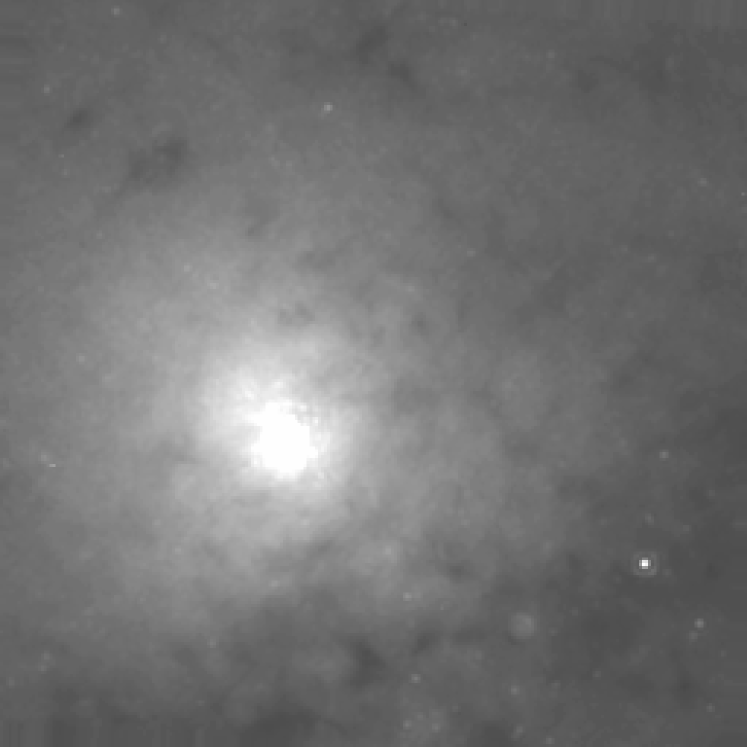
Fig. 1 shows the total intensity map over the entire NICMOS field of view. Not surprisingly, given the similarity between the long wavelength polarizers spectral band and the medium band F222M (”K-band”) filter, this image displays the same basic features as the NICMOS image presented by Schreier et al. (1998). A central unresolved source is superimposed on a smooth galactic structure, punctuated by regions of high absorption that are particularly evident toward the South where the thickest regions of the dust lane are located.
3.1 The off-nuclear polarization
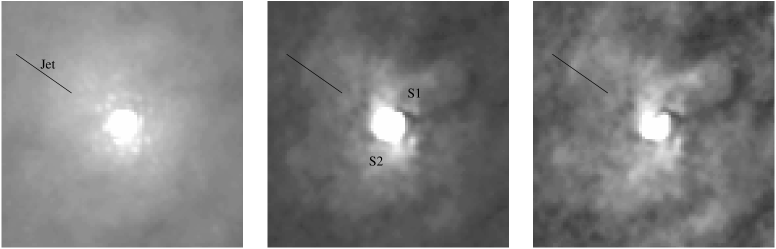
In Fig. 2 we present, from left to right, maps of the total intensity, polarized flux and percentage polarization, respectively, in the central 7\arcsec 7\arcsec. The polarized flux clearly shows a more complex structure than the total intensity image. Two elongated features extend out from opposite sides of the nucleus along PA to a distance of about 1\arcsec, where the polarization reaches 4%. These features, together with two fainter extensions oriented approximately perpendicularly to the previous ones, suggest an S-shaped structure centered on the nucleus; this structure is more apparent in the percentage polarization map. The rest of the polarized emission is rather diffuse, with polarization ranging between 2 and 3 %.
Fig. 3 shows the polarization field for the same central 7\arcsec 7\arcsec re-binned at 4 4 pixels (0\farcs3 0\farcs3); the lengths of the vectors are proportional to the polarized flux and the orientation of the vectors indicates the polarization position angle. Outside the central source, the overall polarization pattern is dominated by a uniform structure oriented approximately along the dust lane. The integrated polarization of the central 2\farcs25, after subtracting the nuclear component, is oriented at PA 106∘, with = 2.6%. This is consistent with the ground based measurements and with the HST/WFPC1 value for the polarization angle, 110∘. However, there are clearly large deviations from a uniform field which suggest a centro-symmetric structure.
To quantify this effect, we plot in Fig. 4 the polarization angle at each pixel versus the position angle (plotted twice for clarity). As usual, position angle 0 corresponds to North and the angle increases towards East. In addition to a uniform polarization field oriented at PA105∘, large deviations with a quasi-periodic behavior suggest that an additional component or components are present. We suggest that the dominant effect can be understood as a nuclear-symmetric pattern superimposed on the uniform field. We discuss the origins of the extended polarization components in Section 4 below.
3.2 Nuclear polarization and photometry
We performed aperture photometry on each of the 12 long exposure images separately, to estimate the polarization parameters of the nucleus and to derive direct estimates of the statistical errors. The total flux density of the nucleus is 21.2 0.2 mJy (1.6 erg cm-2 s-1 Å-1). Its percentage polarization is 11.10.2% and the polarization position angle is 148.21.0∘. Systematic errors are estimated at 5% for the total intensity, due to the uncertainty in the NICMOS calibration, while the effects of instrumental polarization and pedestal are negligible on such a highly polarized source.
The size of the nuclear infrared source is estimated by fitting the radial profiles of the nucleus and the bright star SW of the nucleus as a comparison. The FWHM are 2.30 0.02 and 2.32 0.01 pixels for the nucleus and the star respectively (errors derived from the spread of the 12 independent images). We conclude that the central IR source in Cen A is unresolved at HST resolution. An upper limit to its extent can be determined assuming that the PSF and the nuclear angular dimension add in quadrature. The three-sigma upper limit for the nuclear FWHM is then 0.6 pixels, or 0.8 pc. The polarized source is also unresolved, with a formal FWHM = 2.34 0.06 pixels; the corresponding three-sigma upper limit on its size is 1.2 pixels, or 1.4 pc.
A direct comparison with previous (ground-based) IR imaging polarimetry of Cen A cannot be performed since the NICMOS polarizers bandpass differs significantly from standard infrared filters. The mismatch is particularly important due to the steepness of the Cen A nuclear infrared spectrum (Marconi et al. 2000). We note, however, that within a 2\farcs25 synthetic aperture, our values for the polarization parameters fall between those measured by Packham et al. (1996) in the H and K bands, bracketing the wavelength range of our observations (see Tab. 1).
4 The extended components: scattering and the dust lane
The polarization map presented above suggests a superposition of two components - a constant field and a centro symmetric component. The field resulting from this superposition depends on the relative intensity of the two polarizing mechanisms. If the uniform field dominates, the reflection pattern would produce periodic oscillations around the mean value, whose amplitude increases with . In the limit of pure scattering (no uniform field), we would expect straight lines representing an offset of 90 degrees with respect to the polar angle. In Fig. 4 we illustrate two models, for (dotted line) and for (solid line), respectively. Note that the intensity ratio of the two components is the only free parameter; the average value of the uniform polarization field can be fixed from ground based observations. Clearly, the largest deviations from uniform polarization, which occur around PA and are well fitted by models in which the scattering field dominates, i.e. for large values of .
In Fig. 5 we plot the deviations from constant polarization angle as a function of position with respect to the nucleus. The deviations range up to 70∘, and the largest occur from PA 35∘ to 60∘ and from PA 190∘ to 280∘. Much smaller amplitude deviations of 15∘ degrees are present at PA 130∘, and no significant deviations are seen in the fourth quadrant (PA 300∘). This shows that significant scattering occurs in the nuclear region of Cen A, in a broad bi–cone centered on the jet axis (PA 55∘).
The two elongated features seen in the polarization images, which form the body of the S-shaped structure we pointed out in Section 3.1 (labeled S1 and S2 in Fig. 2b) are not aligned along the position angle of the jet (at the VLBI scale, PA=51∘, Tingay et al. 1998). On the other hand, they are co-spatial with the small, ionized gas disk discovered in Pa by Schreier et al. (1998) and the polarization vectors are perpendicular to the radius vector to the nucleus. The most likely explanation of these structures is therefore that they are the result of a concentration of scattering material associated with the disk of ionized gas rather than being directly associated with a collimated nuclear beam.
The faint outer extensions of the S-shape structure show a rather different behavior than the inner parts: 1) they are not associated with line emission, and 2) their polarization angle is aligned with the large-scale dust lane. Both results can be accounted for if these features lie outside the region illuminated by the nucleus, with their polarization therefore being accounted for by dichroic transmission rather than scattering.
5 Origin of the polarized nuclear emission
In this section, we examine three possible explanations for the highly polarized source observed at the nucleus of Centaurus A - 1) dichroic transmission through dust, 2) scattering, and 3) synchrotron radiation - as other authors have previously done (cf. Packham et al. 1996). In the next section, we discuss the implications of our results.
5.1 Dust dichroic transmission
If we assume the observed polarization arises from dichroic transmission through aligned dust grains, we can calculate the implied extinction. We empirically compare our data to observations of the center of our own galaxy, where a polarization of 6.4% at K is seen (Bailey, Hough & Axon 1984), and the extinction is 30 mag. We conclude that 50 mag (i.e. 6.6 mag) is required to produce the observed polarization of 11.1% at the nucleus of Cen A. The intrinsic 2 flux of Cen A would then be of Jy. As a comparison, the mid-infrared nuclear flux of Cen A at, e.g., 15 is 1.2 Jy (Mirabel et al. 1999). Such a large flux increase toward shorter wavelengths is not expected regardless on the origin of the nuclear emission. In fact, broad band spectra of radio quiet quasars (Barvainis 1990), which we take as representative of the case in which the nuclear emission is thermally dominated, as well as optically thin synchrotron emission, show the opposite behaviour. The discrepancy with the predicted intrinsic Cen A spectrum is sufficiently large that cannot simply be ascribed to, e.g., a higher efficiency of dichroic polarization and leads us to rule out this explanation.
5.2 Scattered nuclear light
If the nuclear polarization originates from scattering of light from an otherwise obscured nucleus, our observations put a strong constraint on the size of the scattering region and the obscuring torus, both of which must have an outer radius smaller than 0.8 pc. To test this possibility we have used the scattering model presented in Young (2000) to determine if the implied compact region can scatter enough flux to account for the observed unresolved source. The model, itself an expansion of the model of Young et al. (1995), allows for a conical electron scattering region within a torus-like geometry of a flared disk. The extinction through the torus from any point within the scattering region is calculated in-situ.
The outer radius of the scattering cone was taken to be 0.8 pc, the largest size compatible with our unresolved source. The inner and outer radii of the torus were chosen to be 0.03 pc and 1 pc, respectively. The model included a vertical scale-height for the dust density away from the torus equatorial plane, taken to be 1 pc.
Typically for active galaxies with obscured broad line regions about 1 per cent of the incident flux is scattered into the line of sight (Miller and Goodrich 1990; Young et al. 1996). With an inner scattering radius of 0.03 pc, and an extinction through the torus of AV = 47 magnitudes along the direct line of sight, it was possible to reproduce the observed degree of polarization while maintaining an optically thin scattering region with a number density of scatterers of cm-3 at the inner scattering radius. Such a density is comparable to that implied from the scattering modelling of some IRAS galaxies (Young et al. 1996).
While the inner radius of obscuring tori in AGN is set by the dust sublimation radius, the appropriate value for its outer radius is matter of debate but it has been usually taken between 10 and 100 pc (Young 2000 and references therein), much larger than the limit set by our observations. However, modelling of the Spectral Energy Distribution (SED) of Cen A also suggests a quite compact torus, with an outer radius of 3.6 pc (Alexander et al. 1999), when compared to other sources (e.g. Efstathiou, Hough & Young 1995). Furthermore the radio observations by Jones et al. (1996) require the presence of dense material confined to within 1 pc from the nucleus. Taken together these results imply that any obscuring torus in Cen A must be very compact and surrounded by a high density scattering cloud.
5.3 Synchrotron emission
Analysis of a complete sample of HST images of Fanaroff-Riley type I (FR I) radio galaxies shows a strong linear correlation between optical and radio core emission (Chiaberge, Capetti & Celotti 1999). The average radio-to-optical spectral index of the sample, defined by the best-fit correlation, is 0.75. The correlation extends over four orders of magnitude in luminosity, with a dispersion of only 0.4 dex. This lead Chiaberge et al. to argue for a common, non-thermal synchrotron origin for both the radio and optical emission.
The very high column density estimated from soft X-ray photoelectric absorption of cm-2 (Rothschild et al. 1999) is often thought to be too large to allow a direct view of the nucleus of Cen A at optical wavelengths. In fact, it corresponds to a visual extinction of mag, assuming a standard gas-to-dust ratio which would completely obscure the nuclear source in the optical and, as discussed above, require an untenably high intrinsic infrared flux. However, Granato, Danese & Franceschini (1997) argue that most of the X-ray absorption in optically obscured AGNs is produced within the dust sublimation radius, where the gas is essentially dust free. A conversion of column density to extinction based on the galactic gas-to-dust ratio may thus lead to an overestimate of . A value of only one third standard would reduce the extinction to mag, making the optical nucleus directly observable even in the optical band. We note this value agrees with that derived from the 10 silicate absorption feature and with the observations of the nuclear spectral energy distribution by Marconi et al. (2000).
In this context, the radio core flux for Cen A of 9.1 Jy at 15 GHz (Clarke, Burns & Norman 1992) predicts a flux of 10 mJy at 2 which, seen through a reddening of 15 mag, is only 0.7 dex smaller than our measurement of 21 mJy. Similarly, the optical V flux of 6.3 erg cm-2 s-1 Å-1 (Marconi et al. 2000), when corrected for such an amount of extinction falls again only 0.7 dex below the FR I radio/optical nuclear correlation 222As discussed in detail by Marconi et al. the central wavelength of the F555W image, 5440 Å, is significantly offset from its effective value, 5990 Å, due to the steepness of Cen A nuclear spectrum, wavelength at which fluxes and extinction must by then evaluated..
Potentially, a more substantial problem for the synchrotron interpretation of the continuum is that while the nucleus of Cen A is heavily polarized in the IR, it is unpolarized at 800 and 1100 (with a 3 upper limit of 0.7 % at 1100 Packham et al. 1996) and it shows little polarization in the radio band (0.46 %, Burns, Feigelson and Schreier, 1983). However, a similar behaviour is seen in the two FR I nuclei for which nuclear polarization measurements exist from HST observations. In M 87 the nucleus is polarized at 2.9 % in the UV (Capetti et al. 1995) while it shows a polarization level of only 0.95 % in the radio (Eric Perlman, private communication); similarly, analysis of archival UV images of 3C 264 revealed a polarization of 23 %, while the radio polarization is only 3.5 % (Lara et al. 1997). All polarization angles are, within the errors, consistent with being perpendicular to the respective radio jet axis, and this is the case also for Cen A whose radio polarization is oriented at PA = 149 (Rusk and Seaquist 1985). The observed IR polarization properties of the nucleus of Cen A nicely fit in this scheme which suggests a common synchrotron origin for the polarization in the radio and in the IR/optical/UV bands. Certainly intriguing is the location and origin of the medium responsible for the depolarization observed at radio wavelengths.
6 Implications for the FR I / BL Lac unified model
In this section we explore the implication of our results for Cen A as a representative member of the FR I population in the framework of the unifying model for low luminosity radio-sources. The role of obscuration in this scheme is still a matter of debate. Although circumnuclear tori are crucial for the unification of broad and narrow line Seyfert galaxies and powerful radio sources, there is as yet no evidence in favour of their existance in FR I. Indeed they are not required implicitely for the FR I / BL Lac unification (see Urry and Padovani 1995). The results of Chiaberge et al. suggest that tori are either geometrically thin (height over radius ) or present only in a minority of FR I.
It is clear from our previous discussion that our IR polarization observations of Cen A can be well explained in a model in which the nucleus is surrounded by an obscuring torus and the infrared nuclear source (as well as its optical counter part) is purely due to scattering. By allowing the scattering region to be partially obscured, the extinction observed between the V-band and the near-IR can also be reproduced.
Alternatively, as discussed in the previous section, we might have a direct view of the synchrotron emission from the nucleus of Cen A. Packham et al. (1996) pointed out that the nucleus of Cen A has rather different properties from BL Lac objects. In particular, they noted: a) lower polarization at mm wavelengths than typical for BL Lacs; and b) a polarization angle which is approximately perpendicular to the jet axis, while in BL Lacs it is usually parallel to it. In addition our observations do not show a highly collimated polarized region cospatial with the jet axis which again argues against the presence of a misdirected BL Lac nucleus in Cen A.
However convincing these arguments appear when taken together with our discussion about scattering, they do not strictly rule out a synchrotron origin for the nuclear polarization, since there is growing evidence that the emission which dominates in BL Lacs does not originate from the same region of that seen in FR I. First, the polarization of radio cores in all radio galaxies is much lower than in BL Lacs (Saikia 1999). Second, the intensity ratio between BL Lacs and FR I nuclei is typically , indicative of Lorentz factors again smaller that typical values for BL Lacs, i.e. (Ghisellini et al. 1993, Chiaberge et al. 2000). In fact Chiaberge et al. concluded that the core emission in FR I comes from a less anisotropic component than in BL Lacs, due to the presence of a velocity structure within the jet, which allows slower components to dominate the faster ones at large viewing angles. A similar conclusion has been derived by Laing et al. (1999) discussing the jet asymmetry of FR I. If we adopt this view then the nuclear polarization of Cen A can still be due to synchrotron from an unresolved slow jet halo, surrounding a high jet.
A key constraint provided by our observations is that one has to explain not only the nuclear polarization but also the nature of the off nuclear scattered light. While this is readily accounted for if there is a shadowing torus, in the synchrotron picture the polarized light is reflecting the intrinsic anisotropy of the nuclear radiation field. Our images show that the angular region covered by scattered light has an opening angle of ∘ and therefore requires only modest anisotropy in the nuclear emission. The opening angle (FWHM) of the illuminating beam is related to the jet bulk Lorentz factor as . If this is due to Doppler beaming it requires in agreement with the estimates of Lorentz factors for the jet halo derived by Chiaberge et al. (2000).
Because the source of illumination is intrinsically polarized in principle one should expects deviations from circular symmetry in the polarization pattern. The detailed modeling of this effect shows that the source polarization must be comparable with the maximum polarization caused by scatterers (60 %) in order to have a significant impact on the observed pattern. Unfortunately in Cen A the foreground dichroic sheet prevents any such effect to be seen.
However, we also have to explain the absence of a collimated scattered counter part to the fast synchrotron core of the radio jet. The only obvious way to do it is to make this region essentially devoid of scatterers by clearing them with the passage of the arcsec scale jet.
7 Summary and conclusions
The large scale polarized component seen in the nuclear regions of Cen A is consistent with previous ground-based and HST WF/PC-I observations and is explained by dichroic transmission through the foreground dust lane. Significant quasi-periodic deviations in the polarization angle within a few arcseconds of the nucleus are caused by scattering of nuclear radiation. The strongest effects are seen in the quadrants that contain the jet symmetry axis, but there is no detailed correlation with the jet itself.
The nucleus is found to be unresolved, with a 3-sigma upper limit on the FWHM of 0.8 pc. It is highly polarized, at 11.10.2%, with a position angle of 148.21.0∘, perpendicular to the jet axis.
The nuclear polarization cannot be explained by dichroic transmission through dust, as this would require an absorption of 50 mag. The intrinsic 2 flux would then exceed by a factor 10 the mid infrared measurements and this is not expected regardless on the origin (thermal or non thermal) of the nuclear emission.
Our modeling shows that it is possible to explain the nuclear polarization as optically thin scattering from a pc cone. This requires the existence of an extremely compact torus. However, this is in agreement with the modeling of the SED of the Cen A nucleus and also with the radio observations. This model also naturally explains the large scale biconical scattering morphology.
A synchrotron origin for the nuclear radiation requires that it originates from a low unresolved jet halo surrounding the faster jet core so that the angular size of extended scattering can be matched. This kind of jet morphology is expected on the basis of recent results on the statistical properties of FR I radio-galaxies. In order to explain the absence of a bright scattered BL Lac beam, i.e. a high jet core, one has to assume that the jet clears away the scattering material along its trajectory.
It would be very important at this stage to establish whether circumnuclear tori are common in FR I or whether their observed properties are dominated by their jet emission. Unfortunately, previous measurements of the nuclear polarization in FR I have always been hampered by the dominant dilution of starlight as their nuclear sources only account for a few per cent of the total flux in typical ground based apertures (see e.g. Impey, Lawrence & Tapia 1991). A high resolution HST study of the sort present here for the FR I class as a whole is needed to establish the polarization properties of their IR and optical cores and their pattern of illumination.
Acknowledgements.
We would like to thank the referee, R. Antonucci, for his useful comments and suggestions.References
- [Alexander et al. 1999] Alexander, D. M., Efstathiou, A., Hough, J. H., Aitken, D., Lutz, D., Roche, P., & Sturm, E., 1999, MNRAS 310, 78
- [Antonucci and Barvainis (1990)] Antonucci, R. and Barvainis, R. 1990, ApJ, 363, L17
- [Bailey Hough & Axon 1984] Bailey, J., Hough, J. H. & Axon, D. J. 1984, MNRAS, 208, 661
- [Bailey et al. 1986] Bailey, J., Sparks, W. B., Hough, J. H., & Axon, D. J., 1986, Nature, 322, 150
- [Barvainis (1990)] Barvainis, R. 1990, ApJ, 353, 419 J. O., Feigelson, E. D. and Schreier, E. J. 1983, ApJ, 273, 128
- [Bushouse et al. 1997] Bushouse, H., Skinner, C.J., MacKenty, J.W, 1997, NICMOS Instrument Science Report, 97-28 (Baltimore STScI)
- [Capetti, et al. (1995)] Capetti, A., Macchetto, F., Axon, D. J., Sparks, W. B. and Boksenberg, A. 1995, ApJ, 452, L87
- [Chiaberge Capetti & Celotti 1999] Chiaberge, M., Capetti, A. & Celotti, A. 1999, A&A, 349, 77
- [Chiaberge et al. 2000] Chiaberge, M., Celotti, A., Capetti, A. & Ghisellini, G. 2000, A&A, 358, 104
- [Clarke Burns & Norman 1992] Clarke, D. A., Burns, J. O. & Norman, M. L. 1992, ApJ, 395, 444
- [Efstathiou Hough & Young 1995] Efstathiou, A., Hough, J. H. & Young, S. 1995, MNRAS, 277, 1134
- [Ghisellini et al. 1993] Ghisellini, G., Padovani, P., Celotti, A., Maraschi, L., 1993, ApJ, 407, 65
- [Granato Danese & Franceschini 1997] Granato, G. L. , Danese, L. & Franceschini, A. 1997, ApJ, 486, 147
- [Hawarden et al. 1993] Hawarden, T. G., Sandell, G., Matthews, H. E., Friberg, P., Watt, G. D. & Smith, P. A. 1993, MNRAS, 260, 844
- [Hines Schmidt & Lytle 1997] Hines, D. C., Schmidt, G. D. & Lytle, D. 1997, The 1997 HST Calibration Workshop with a New Generation of Instruments, p. 217, 217
- [Hui et al. 1993] Hui, X., Ford, H.C., Ciardullo, R., Jacoby, G.H. 1993, ApJ, 414, 463
- [Impey Lawrence & Tapia 1991] Impey, C. D., Lawrence, C. R. & Tapia, S. 1991, ApJ, 375, 46
- [Jones et al. 1996] Jones, D.L., Tingay, S.J., Murphy, D.W., et al., 1996, ApJ, 466, L63
- [Laing Parma de Ruiter & Fanti 1999] Laing, R. A., Parma, P., de Ruiter, H. R. & Fanti, R. 1999, MNRAS, 306, 513
- [Kellermann Zensus & Cohen 1997] Kellermann, K. I., Zensus, J. A. & Cohen, M. H. 1997, ApJ, 475, L93
- [MacKenty et al. 1997] MacKenty, J.W., et al., 1997, NICMOS Instrument Handbook, Version 2.0 (Baltimore STScI)
- [Marconi et al. 2000] Marconi, A., Schreier, E. J., Koekemoer, A., Capetti, A., Axon, D. J., Macchetto, F. D., Caon, N., 2000, ApJ 528, 276
- [miller 1990] Miller, J. S., Goodrich, R. W., 1990, ApJ, 355, 456
- [Mirabel, et al. (1999)] Mirabel, I. F., et al., 1999, A&A, 341, 667
- [Morganti et al. 1991] Morganti, R., Robinson, A., Fosbury, R. A. E., di Serego Alighieri, S., Tadhunter, C. N. & Malin, D. F. 1991, MNRAS, 249, 91
- [Packham et al. 1996] Packham, C., Hough, J.H., Young, S., Chrysostomou, A., Bailey, J.A., Axon, D.J., Ward, M.J., 1996, MNRAS, 278,406
- [Rothschild et al. 1999] Rothschild, R. E., et al. 1999, ApJ, 510, 651
- [Rusk and Seaquist (1985)] Rusk, R. and Seaquist, E. R. 1985, AJ, 90, 30
- [Saikia 1999] Saikia, D. J. 1999, MNRAS, 302, L60
- [Schreier et al. 1996] Schreier, E.J., Capetti, A., Macchetto, F., Sparks, W.B., Ford, H.C., 1996, ApJ, 459, 535
- [Schreier et al. 1998] Schreier, E.J., Marconi, A., Capetti, A., Caon, N., Axon, D., Macchetto, F., in preparation.
- [Skinner at al. 1997] Skinner, C.J., Bergeron, L.E., Daou, D., 1997, HST Calibration Workshop, Eds. S. Casertano et al. (Baltimore STScI), in press
- [Sparks & Axon 1999] Sparks, W. B. & Axon, D. J. 1999, PASP, 111, 1298
- [Urry & Padovani 1995] Urry, C. M. & Padovani, P. 1995, PASP, 107, 803
- [Tingay et al. 1998] Tingay, S. J., et al. 1998, AJ, 115, 960
- [Tubbs 1980] Tubbs, A.D., 1980, ApJ, 241, 969
- [Young 2000] Young, S., 1999, MNRAS, in press
- [Young 1995] Young, S., Hough, J. H., Axon, D. J., Bailey, J. A., Ward, M. J., 1995, MNRAS, 272, 513
- [Young 1996] Young, S., Hough, J. H., Efstathiou, A., Wills, B. J., Bailey, J. A., Ward, M. J., Axon, D. J., 1996, MNRAS, 281, 1206


| Band | I [mJy] | P [mJy] | |||
|---|---|---|---|---|---|
| H | 3.45 | 129.7 | 73 | 2.5 | |
| HST | 3.83 | 135.6 | 69 | 2.6 | |
| Kn | 5.43 | 142.2 | 88 | 4.8 |