Spectral energy distributions of FR I nuclei and the FR I/BL Lac unifying model
Abstract
We consider archival ROSAT and Hubble Space Telescope (HST) observations of five FR I radio galaxies and isolate their nuclear emission from that of the host galaxy. This enable us to determine the Spectral Energy Distributions (SED) of their nuclei spanning from the radio to the X–ray band. They cannot be described as single power–laws but require the presence of an emission peak located between the IR and soft X-ray band. We found consistency between the SED peak position and the values of the broad band spectral indices of radio galaxies with those of BL Lac, once the effects of beaming are properly taken into account. FR I SED are thus qualitatively similar to those of BL Lacs supporting the identification of FR I sources as their mis-oriented counterparts. No dependence of the shape of the SED on the FR I orientation is found.
keywords:
galaxies:active - jets - nuclei - photometry - BL Lacertae objects:general1 Introduction
In the framework of the unifying models for AGN, the low luminosity Fanaroff–Riley (1974) type I, FR I, radio galaxies are identified as the parent population of BL Lac objects: the non–thermal continuum of BL Lacs is dominated by beaming effects, resulting from the relativistic motion of plasma at a small angle with respect to the line of sight (Blandford & Rees 1978), and FR I radio galaxies would represent their mis-oriented counterparts. Support to this unification comes from different and independent observational pieces of evidence (see Urry & Padovani 1995 for a review).
In this scenario the detection of any non–thermal jet emission in FR I would allow a quantitative analysis of the unified model based on the direct comparison of the beamed component in the two populations. However, to pursue this goal we need to isolate the jet emission in the cores of radio galaxies.
Recently, Chiaberge, Capetti & Celotti (1999) have analyzed HST images of a complete sample of 33 FR I radio galaxies and found an unresolved central optical source in the majority of them. The luminosity of these sources show a striking linear correlation with that of the radio cores, strongly arguing for a non–thermal synchrotron origin also for the optical emission. Furthermore, the high detection rate suggests that obscuring tori in the nuclei of FR I must be either geometrically thin or present only in a minority of the objects.
HST images also reveal the presence of extended nuclear disks in low luminosity radio galaxies (e.g. Jaffe et al. 1993). As shown by Capetti & Celotti (1999, hereafter CC99) from the analysis of 5 objects, such disks can be used as reasonably good indicators of the orientation of the radio sources. All of the 5 FR I also show the optical central source. By comparing their intensity with the emission of BL Lacs with similar extended (isotropic) characteristics they found that: i) BL Lacs are – brighter than the corresponding radio galaxies and ii) the relative core brightness decreases with increasing observing angle, quantitatively consistent with the inference that also the FR I nuclear component is dominated by the beamed jet emission.
In this framework, multi–wavelengths observations of FR I radio galaxies clearly represent an alternative and more detailed way to test the model, as their SED can be directly compared with those of BL Lacs. The latter ones are well described by two broad peaks (in ), the first one attributed to non–thermal synchrotron emission while the second one is most commonly ascribed to inverse Compton scattering. Moreover, the whole BL Lac (and Flat Spectrum Radio Quasar, FSRQ) broad band phenomenology seems to be accounted for by the (continuous) distribution in the energy position of the two peaks and their relative luminosity (Padovani & Giommi 1995; Fossati et al. 1998): an increase in the inverse Compton vs synchrotron luminosity ratio corresponds to a decrease in the peak frequencies, describing the progressive trend from FSRQ, to High and Low Energy Peaked BL Lacs (HBL and LBL, Giommi & Padovani 1994). This establishes a direct relation between the type of SED/object and the relative contribution of the two components in the X–ray band (steep synchrotron turnover vs flat Compton power law; Padovani & Giommi 1996). These phenomenological trends seem also to be simply connected with the source (bolometric and radio) power, increasing from HBL to LBL (Ghisellini et al. 1998).
But how does orientation affect the SED ? While it has been rather convincingly shown that orientation alone cannot account for the differences in the SED of blazars (Sambruna, Maraschi & Urry 1996), the alternative interpretation just described has been - so far - focused only on highly beamed sources (blazars), neglecting the (comparatively smaller) effects due to orientation.
SED of radio-galaxies and in particular of FR I have been derived by several authors (e.g. Impey & Gregorini 1993; Ho 1999). However, the comparison with those of BL Lacs is hampered by the large aperture from which data have been obtained, which often includes a dominant contribution from the host galaxy. We therefore gathered archival observations of FR I from which it is possible to separate the nuclear from the extended emission, in particular ROSAT data and HST/NICMOS infrared images. These can be combined with our analysis of the HST optical images and radio core measurements from the literature. Clearly, data in the infrared/optical and X–ray bands could also provide an independent test for the role of absorption from thick material (torus) in this unifying scheme.
As the orientation of the radio galaxies is a crucial parameter, in this paper we focus on the sample of 5 objects studied in CC99 (see Table 1), for which we have such information.
ROSAT archival pointed observations of 4 out of 5 galaxies are available and are presented in Section 2. HST/NICMOS infrared images have been obtained for 3 of the selected objects and are described in Section 3. In Section 4 we discuss the role of absorption with respect to the inferred nuclear SED, which we assemble in Section 5. The comparison with the SED of BL Lacs and the implications for the FR I/BL Lac unified scheme are discussed in Section 6, while in the final Section 7 we present our conclusions and future perspectives.
Throughout this work, we adopt the following values for the cosmological parameters: km s-1 Mpc-1 and .
2 The ROSAT observations
ROSAT HRI and PSPC data are available for 3 of the selected sources, namely 3C 31, 3C 270 and 3C 465, while for 3C 264 only PSPC data exist. In Table 2 we list the available pointed observations. The X–ray properties of these targets have been already discussed by different authors (see last column of the table) but we decided to re-analyze the data to follow a more homogeneous approach.
For the analysis we have used the EXSAS package (release of Jan. 1996; Zimmermann et al. 1995) and the data have been corrected for vignetting and dead time. In the PSPC observations only the energy range 0.15 - 2.1 keV has been considered and the spectra have been rebinned according to the source count rate 111The minimum signal to noise ratio per energy channel is for 3C 264 and 3C 270, for 3C 31 and for 3C 465..
All targets are members of clusters or groups of galaxies, and this implies that any central non–thermal X–ray emission must be disentangled from that of a hot intergalactic medium, with temperatures keV (Sarazin 1986), and of the extended hot halos ( keV; Donnelly et al. 1990; Trussoni et al. 1997). Therefore for the spectral analysis of the PSPC data we used composite models allowing for the presence of both a thermal and a non–thermal (power-law) component. The free physical parameters in the spectral fits are, besides the two normalizations, the hydrogen column density , the photon index for the power–law spectrum, the temperature and metallicity for the thermal component (optically thin plasma, Raymond & Smith 1977). As count rates are usually quite low, some parameters must be fixed in order to deduce usefully constrained fits. In all cases (except for 3C 264) we set to its galactic value , and , as typical for hot galactic halos (Fabbiano 1989). Fixing the metallicity does not significantly affect our results as the parameters describing the non-thermal component depend only weakly on – at least if it lies within the plausible range . To establish the statistical significance of the non thermal component, we have then checked through an F-test when its inclusion improves the fit.
The HRI data should allow in principle to spatially separate the unresolved central component from the coronal emission. However, the spatial resolution of the HRI is insufficient to fully resolve the cores of the galactic coronae, particularly for the more distant sources. Furthermore, problems in the aspect solution associated with the satellite wobble may lead to smearing of point-like sources (algorithms proposed to overcome this problem work only for bright sources, Morse 1994; Harris et al. 1998; Sarazin et al. 1999) compromising the spatial analysis. We therefore preferred to use the HRI observations just to check their consistency with the count rates predicted by the PSPC spectral decomposition.
No statistically significant variability has been found in the light curves of the observations, and in the targets observed with PSPC and HRI the count rates are consistent in both instruments. This is also true for two very short HRI exposures of 3C 31 (Jan. 1992; see Trussoni et al. 1997) and 3C 270 (Jul. 1994), that we have not included in the present analysis.
2.1 Individual sources
In the following we discuss the X–ray properties of the targets and in particular the results from the spectral fits with a two components model (thermal + power-law). The results are summarized in Table 3.
3C 31. The host galaxy of 3C 31 (NGC 383) is the dominant member of the group Arp 331. A fit to its PSPC spectrum including a non-thermal source is more acceptable at % confidence level than a single thermal component. We obtain a gas temperature of keV, but the spectral index of the non–thermal component is essentially unconstrained, . We derive the power-law flux adopting two values of the photon index (namely and see Table 3): the resulting estimates differ by only 20 % indicating that in this case uncertainties are dominated by photon statistics. Our spectral results are basically consistent with those of Komossa & Böhringer (1999).
The HRI brightness radial profile (Fig. 1a) shows a compact component (broader than the PSF) and faint extended emission out to . From the PSPC analysis we expect a HRI photon flux of cts s-1 and cts s-1 from the thermal and non–thermal components, respectively. The total HRI count rate (within the same extraction radius of the PSPC spectrum) is cts s-1, in agreement with our estimates. Furthermore, the predicted non–thermal photon flux cannot exceed that measured in the central compact component. Indeed within we measure cts s-1.
3C 264. This radio galaxy lies at a projected distance of from the center of the cluster A1367. Low brightness emission from the cluster gas is detected around the galaxy, but it is effectively removed after background subtraction. The spectrum is remarkably well fitted with a single power law () absorbed by a column density , consistent with the Galactic one (), in agreement with the results of Edge & Röttering (1995). A thermal component might be present at level (assuming keV) at a confidence level of %.
3C 270. This source is associated to NGC 4261, main member of a group of galaxies located behind the Virgo cluster. The emitted flux is fitted better by a composite spectrum than by a single thermal law (improving of the quality of the fit at a significance level of %). The two component spectral model provides acceptable fits to the PSPC data with and keV. These results, and in particular the presence of a flat non–thermal component, are confirmed by the analysis of the ASCA observations (Sambruna et al. 1999).
The HRI brightness profile (Fig. 1b) is similar to that of 3C 31 but the extended emission (detected up to a radius ) is much more prominent. Again the central compact region is more extended than the PSF. In the HRI we detect a total count rate cts s-1, as expected from the PSPC data which predict cts s-1 and cts s-1 for the thermal and power–law components, respectively. The photon flux of the compact component is cts s-1 again consistent with the derived intensity of the power–law one.
3C 465. The galaxy NGC 7720 (3C 465) is the brightest member of the cluster A2634. The PSPC emission from the central region is well fitted by a thermal spectrum with keV. The addition of a non–thermal component does not improve the fit. We set an upper limit to the non–thermal luminosity of erg s-1 (see Table 3). This contrasts with the results obtained by Hardcastle & Worrall (1999) based on the spatial analysis of the HRI brightness profile.
NGC 7052. No pointed observation is available for this source. From the RASS an upper limit of the count rate cts s-1 is found (Brinkmann, private comm.). Assuming a power-law spectrum with this corresponds to a total luminosity erg s-1.
2.2 Summary of the X-ray data
Non–thermal emission is detected in 3 out of the 4 targets with pointed X–ray observations: in 3C 264 it is the dominant source, while in 3C 270 and 3C 31 the inclusion of a non–thermal component significantly improves the fit. Only an upper limit can be set for the power-law emission from the nucleus of 3C 465. The photon fluxes predicted by the spectral decomposition agree with those observed in the HRI images.
Worral & Birkinshaw (1994) & Worral (1997) found a correlation between the luminosities of FR I radio galaxies in the radio and soft X-ray bands, recently confirmed by Canosa et al. (1999) and Hardcastle and Worrall (1999) who analyzed the PSPC and HRI brightness profiles of a large sample of objects. This trend appears to hold also at harder X-ray energies for brighter radio galaxies (Trussoni et al. 1999a). The non-thermal luminosity of the three detected sources we found is consistent with this correlation. Conversely, the upper limit for 3C 465 is times lower than expected. Concerning the thermal component, elliptical galaxies show a correlation between the coronal X–ray luminosity and the optical magnitude in the band (Fabbiano et al. 1984, Donnelly et al. 1990, Eskridge et al. 1995, Trussoni et al. 1997, Beuing et al. 1999). The thermal luminosities derived for 3C 31 and 3C 270 (as well as the upper limit deduced for 3C 264) are again consistent with this X-ray/optical relation. Only the luminosity of 3C 465 is significantly lower (by a factor ) than expected.
This overall agreement provides independent support to the validity of our spectral decomposition.
3 The HST/NICMOS observations
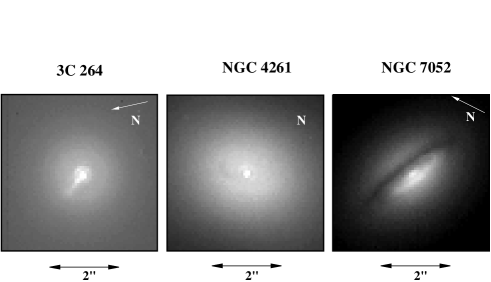
HST/NICMOS observations are available in the public archive for 3C 264, 3C 270 and NGC 7052. For the first two objects we analyzed images taken with the F110W, F160W and F205W wide band filters (approximatively corresponding to the H, J and K bands, respectively), while for NGC 7052 only F160W images exist.
The targets were observed using NICMOS Camera 2 (0075/pixel). The field of view of this 256 256 pixels camera is 194 194. All observations were carried out with a MULTIACCUM sequence (MacKenty et al. 1997), i.e. the detector is read out non-destructively several times during each integration to facilitate removal of cosmic rays and saturated pixels. The data were re-calibrated using the pipeline software CALNICA v3.0 (Bushouse et al. 1997) and the best reference files in the Hubble Data Archive to produce flux calibrated images. Bad pixels were removed interpolating from values of neighboring pixels. A log of the observations is given in Table 4.
The final images are presented in Fig. 2. While in NGC 7052 the extended dusty disc seen in the optical images is clearly visible, we do not find evidence for circum–nuclear structures in 3C 264 and 3C 270. This is somewhat expected at this longer wavelengths where dust absorption is less efficient, confirming that these discs are associated with dust with small optical depth (e.g. Jaffe et al. 1993). On the other hand, similarly to what found in the optical band, in all targets it is detected a central IR source, whose emission can be now easily isolated from that of the host galaxy. We performed aperture photometry to measure their nuclear fluxes in the different bands (reported in Table 4). Photometric errors are dominated by the accuracy of the NICMOS internal flux calibration, which is within 5%, except in the case of NGC 7052 where the relative error is %.
4 The role of absorption in FR I nuclei
As absorption could have significantly affected our measurements in the optical and X–ray bands, and thus in principle alter the inferred SED properties, in this section we carefully examine its possible role.
Photoelectric absorption can be very effective on soft X-rays, and thus measures in this band provide a powerful tool to estimate the (equivalent) column density in neutral hydrogen . In 3C 264 the X-ray emission is dominated by a power–law component over the whole ROSAT energy range and its spectrum is sufficiently well determined that we could directly measure a column density which – as already mentioned – is fully consistent with the Galactic one: no significant local absorption is present in this source. This is somewhat expected as 3C 264 is likely to be seen at a small angle from the jet axis (see Table 1) and thus along an unobscured line of sight (within the nuclear region). Conversely, in 3C 31, 3C 270 and 3C 465, the observed X-ray flux is dominated by extended thermal emission which is unaffected by nuclear absorption. The detection in 3C 31 and 3C 270 of non–thermal emission above 1 keV only sets an upper limit of cm-2222This column density corresponds to an attenuation of a factor 100 in the intensity at 2 keV. Note that these results are in agreement with the conclusions of Chiaberge et al. (1999), namely that optically thick material (torii) affects the nuclear emission at most in a minority of FR I. Clearly only X-ray observations at higher spatial resolution, increasing the fraction of nuclear vs extended component, can provide more stringent and valuable estimates of in these cases.
Obviously optical images do not directly lead to estimates of absorption. However, the tight linear correlation which exists between the optical (R band) and radio fluxes/luminosities of FR I cores (see Introduction) can set interesting upper limits on the nuclear extinction. In fact, even if the entire dispersion of this correlation (0.4 orders of magnitude) is due unically to foreground dust absorption varying from source to source, the extinction can not exceed 2 magnitudes. This limit translates into a gas column density of (assuming a standard gas-to-dust ratio and the extinction curve by Cardelli, Clayton & Mathis 1988), and thus the flux at 1 keV could be depressed at most by a factor of 4 (photoelectric absorption values tabulated by Morrison & McCammon 1983).
Given these upper limits on the exctintion, what would be its effect on the SED properties (and more specifically on the broad band spectral indeces)? As the fluxes in the V band and at 1 keV can be underestimated by a factor and respectively, the corresponding (maximum) changes in the spectral indeces are limited to , and ( 333they are calculated between 5 GHz, 5500 Åand 1 keV (rest frame)). Such uncertainties do not affect significantly our findings and conclusions.
5 Spectral Energy Distributions of FR I nuclei
Combining the available data in different energy bands, it is possible to build a SED for the FR I nuclei, isolating for the first time this emission from that of the host galaxy (see Fig. 3 and Table 5). Besides the IR and X–ray data presented in the previous sections, we used HST optical fluxes from CC99 and radio data taken from the literature. In the following we describe the individual SED – always referring to a representation – and characterize them through the broad band spectral indices, , and (the potential effects produced by the presence of local absorption are discussed in the previous Section 4).
3C 31. The average radio-to-optical spectral index is while the optical-to-X–ray one is . These spectral indices imply the presence of a peak in the energy distribution. A better energy coverage or the determination of the optical (or X–ray) spectral slope are necessary in order to better constraint its location.
3C 264. Its SED is the better determined in our sample as there are data at radio, infrared and optical frequencies, the X–ray spectrum is also well defined and the absorption is constrained to a negligible value. The energy distribution rises from the radio toward higher frequencies (with an average index ) and it is still rising in the IR/optical band, although with a flatter slope. At 1 keV the intensity is 20% larger than in the optical (in Lν) but the X–ray spectrum is rather steep (= 1.45) indicating that the SED has already reached its peak, which must be thus located in the interval Hz.
3C 270. This SED is characterized by the sharp decline in the IR/optical range described by a spectral index . Clearly dust absorption can play a significant role in producing this rapid decline. However its spectrum in the X–ray band, as also measured by ASCA, indicates that the minimum observed at optical energies is real, although possibly enhanced by the presence of dust. Moreover, its representative point is not located significantly below the radio-optical correlation described by Chiaberge et al. (1999), arguing against an obscuration larger than average.
3C 465. After rising from the radio to the optical (), the SED of 3C 465 is already falling at higher energies as the X–ray upper limit lies below the optical point. This indicates that also in this case a peak in the emission is reached below the X–ray band, although the poorly determined SED does not allow us to better constrain its location.
NGC 7052. The average radio-to-optical spectral index is . Contrarely to what seen in 3C 270, the nuclear source in NGC 7052 is (marginally) fainter in the infrared than in the optical band. This indicates that, although the extended disk is seen at the highest inclination ( 70∘) and has a very large optical depth, the nuclear emission is not significantly affected by dust obscuration. The upper limit derived from the RASS requires a flattening of the SED slope at higher energies.
Summarizing, the nuclear SED of the selected FR I present a wide variety of behaviors. However three common features can be recognized: i) it always rises from the radio to the infrared/optical; ii) no SED can be described as a single power law; iii) for all of the sources with pointed X–ray data the presence of a peak in the emission can be localized at energies lower than soft X–rays.
6 Discussion
6.1 Comparison of the SED of FR I and BL Lacs
Let us now compare the SED of FR I with those of BL Lacs. Despite of the poor spectral coverage of the FR I SED (somewhat reminiscent of the SED coverage of BL Lac objects in the 80s), it is possible to recognize a qualitative similarity with the SED of blazars, and in particular the likely presence of one broad peak (see Fig. 3). In fact, as discussed in Section 5, the spectra appear to raise from the radio to the IR/optical band, and in all cases - except for NGC 7052 - the X–ray information (flux and/or spectrum) suggest that a peak in the SED occurs at lower energies.
In the specific case of 3C 270 the flat X–ray spectrum is plausibly due to the dominance of a rising Compton component in this band. And interestingly its extremely steep IR-optical spectrum seems to indicate the presence of a minimum, fully consistent with the indications derived from the X–ray spectral shape. Agreement between the hints inferred from the IR/optical and X–ray spectra is also found in the SED of 3C 264 in which the X–rays can be interpreted as the steep high energy cut-off of the synchrotron component.
Clearly, the paucity of spectral information limits any detailed analysis and in particular does not allow us to determine the location of the energy peak precisely enough to identify the ’type’ of blazar putatively hosted in the radio galaxies, except possibly for 3C 270 and 3C 264, which resemble an LBL and HBL, respectively.
Nevertheless, it is possible to profitably use the available data to compare the broad band spectral indices with those of BL Lacs, as shown in Fig. 4 where complete samples of BL Lacs (and FSRQ) are considered 444The separation between LBL and HBL does not univocally correspond to the selection band of BL Lacs (i.e. Radio selected BL Lacs and X-ray selected BL Lacs, RBL and XBL). However, there is a sufficiently large overlap of RBL with LBL (and of XBL with HBL) that we consider the values of spectral indices for RBL and XBL as representative of the respective classes as defined from the SED peak location.. Three out of the four radio galaxies (3C 31, 3C 264 and 3C 465) lie in the area occupied by FSRQ and RBL. Particularly puzzling is the case of 3C 264. In fact this source is observed at a small angle with respect to the jet axis, re-enforcing the view that its nucleus should be rather similar to that of a BL Lac. Furthermore its SED suggests that the putative synchrotron peak is located between the optical and X–ray bands, analogously to HBL, in contrast with its position in the spectral index planes. The fourth source, 3C 270, is located on its own in the upper left corner of the diagrams.
However, as discussed in detail by Chiaberge et al. (2000)
relativistic beaming can have strong effects on the position of the
source in the – plane. Due to the
shift in energy caused by beaming, these quantitatively depend on the
shape of the SED if there are changes in the spectral slope (even in
the simplest case in which the degree of beaming does not depend on
energy). The transformation law for broad band spectral indices,
derived in Chiaberge et al. (2000), is
where , are the radio, optical or X-ray spectral indices and , are the relativistic beaming factors.
For 3C 264 and 3C 270, for which in both the optical and X-ray bands are measured, we can determine “beaming tracks”, i.e. the changes of the broad band spectral indices for increasing Doppler boosting (Fig. 4), adopting . For 3C 264, since the SED slope in the X–ray is steeper than in the IR/optical and radio bands, blue-shifting the SED has the effect of reducing all spectral indices. Its representative point thus moves toward the origin in both the – and – planes and the beaming track crosses the region in which HBL are located. Similarly, the track of 3C 270 intercepts the region typical of LBL 555As dust absorption can cause an enhancement of the minimum in the IR/optical region of the SED of 3C 270, we also estimated its ‘beaming track’ allowing for the presence of extinction. This turns out to be similar to the case of no absorption.. For both objects, the inconsistency between SED shape and the values of the spectral indices might be thus resolved, once the effects of beaming are properly taken into account.
We note, however, that the beaming factor required in the case of 3C 264 is (the beaming correction for 3C 270 is heavily dependent on possible effects of dust extinction and thus is not quantitatively reliable). As the nuclear luminosity increases as (with ), when seen pole-on 3C 264 would be 3 - 6 orders of magnitude brighter in the optical band (where and for ). This is only marginally consistent with the estimates of the ratio between its luminosity and that of BL Lacs of similar extended (isotropic) power, which are only times brighter (CC99). Furthermore, as discussed in the Introduction the radio luminosity of BL Lacs appears to be univocally connected with their SED. As the nuclear radio luminosity of 3C 264 is erg s-1, if seen pole-on this would increase by (again for ) reaching values which are typical of LBL and higher than those seen in HBL (Fossati et al. 1998). Chiaberge et al. (2000) found a similar problem when comparing the luminosities of complete samples of FR I and BL Lacs: FR I appear to be overluminous with respect to what is expected by debeaming the BL Lacs emission, modeled with a single emitting component. They suggested that this can be ascribed to a velocity structure within the relativistic jet and that in FR I the emission is dominated by components/regions moving slower than those seen in BL Lacs.
Summarizing, the SED of FR I are qualitatively similar to those of BL Lac objects, supporting the identification of these sources as their mis-oriented counterparts, but their intensity does not seem to be compatible with the simplest model in which we are observing a single beamed emitting component in both classes of objects.
6.2 X-ray emission and radio-galaxy orientation
Following the method developed in CC99, we compare the luminosity of FR I nuclei with that of BL Lac objects in the X-ray band. In order to restrict the comparison to objects which potentially belong to the same region of the luminosity function of the FR I/BL Lacs population, we identify BL Lacs whose isotropic properties are similar to those of our radio-galaxies. More specifically, we consider objects whose extended radio luminosity (data taken from Kollgaard et al. 1996) differs by less than a factor of two from each of our FR I. 666 With respect to CC99, we dropped the further requirement of similar host galaxy magnitude since this does not appear to strongly correlate with the nuclear properties neither in BL Lacs nor in FR I. This less restrictive choice enables us to increase the number of BL Lac counterparts for each FR I. We thus selected between 6 and 10 ‘relatives’ for each FR I. Their X–ray fluxes (1 keV rest frame energy, corrected for absorption) and spectral indices in the ROSAT band are taken from Lamer et al. (1996) and Urry et al. (1996). The X-ray nuclear emission of FR I is fainter than that of BL Lacs by a factor which ranges from 10 up to 3104.
For a given FR I, the X-ray luminosity ratios with respect to the different ‘relative’ BL Lacs present a very large dispersion, of 2 – 3 orders of magnitude, and therefore, contrarely to what is found in the optical band (CC99) we cannot draw any conclusion on whether a trend with orientation is present.
7 Summary and future perspectives
We used ROSAT and HST observations to isolate the emission originating from the nuclei of 5 FR I sources with the aim of studying their Spectral Energy Distributions. For the ROSAT PSPC observations, in order to disentangle the nuclear non-thermal emission from that of the host galaxy halo, we performed fits allowing for the presence of both a thermal and a power–law component: in the case of 3C 264 the emission is dominated by a power law spectrum; in 3C 31 and 3C 270 the inclusion of the non–thermal component improves the fit, while this is not required in 3C 465. A nuclear source is clearly seen in the HST/NICMOS infrared images, available for 3 objects.
Combining the measurements in the X-ray and IR band with optical nuclear luminosities derived from HST/WFPC2 images and radio data taken from the literature, we have been able to build for the first time the SED of FR I nuclei.
These indicate the presence of a peak between the IR and the soft X–ray bands, and the X–ray slopes are consistent with the broad band indications. For the two best constrained SED, it is also possible to tentatively classify the FR I nuclei similarly to what is done for BL Lacs, in High and Low Energy Peaked sources. This turns out to agree with that derived from the comparison of the broad band spectral indices once the changes in the SED due to the beaming are properly taken into account. However, the intensity of the nucleus of 3C 264 does not appear to be compatible with the simplest model in which we are observing a single beamed emitting component in both FR I and BL Lacs. The SED of FR I are thus qualitatively (but probably not quantitatively) similar to those of BL Lacs.
The proposed approach of comparing the SED of the parent and beamed population appears to be promising. Better data and energy coverage are clearly required, particularly in the X–ray band, as the spectral shape at these energies is essential in giving clues on the frequency range where most of the synchrotron emission is released and thus in ‘classifying’ FR I sources similarly to what is done for BL Lacs. Both the AXAF and XMM missions will soon provide us with X–ray spectra for large, and especially complete, samples of FR I.
Acknowledgments
The authors would like to thank the referee for their useful comments and suggestions. The authors acknowledge the Italian MURST for partial financial support under grant Cofin 98-02-32 and from the Italian Space Agency (ASI). This research was supported in part by the National Science Foundation under Grant No. PHY94-07194 (A. Celotti). We wish to thank I. Lehmann for providing the inflight calibrated PSF of the HRI, and W. Brinkmann for allowing us to access to the RASS data on NGC 7052.
References
Beuing J., Döbereiner S., Böhringer H., Bender R., 1999, MNRAS 302, 209
Blandford R.D., Rees M.J., 1978, in BL Lac Objects, A.N. Wolfe, ed., Univ. Pitt. Press (Pittsburgh), p. 328
Buote D.A., Fabian A.C., 1998, MNRAS 296, 977
Bushouse H., Skinner C.J., MacKenty J.W, 1997, NICMOS Instrument Science Report, 97-28 (Baltimore STScI)
Canosa C.M., Worrall D.M., Hardcastle M.J., Birinshaw M., 1999, MNRAS, 310, 30
Capetti A., Celotti A., 1999, MNRAS, 304, 434 (CC99)
Cardelli, J.A., Clayton, G.C., Mathis, J.S. 1988, ApJ, 329, L33
Chiaberge, M., Capetti A., Celotti A., 1999, A&A 349, 77
Chiaberge, M., Celotti A., Capetti A., Ghisellini G., 2000, A&A 358, 104
Davis D.S., Mushotzky R.F., Mulchaey J.S., Worrall D.M., Birkinshaw M., Burstein D., 1995, ApJ 444, 582
Donnelly H.L., Faber S.M., O’Connell R.M., 1990, ApJ 354, 52
Edge A.C., Rottgering H., 1995, MNRAS, 277, 1580
Eskridge P.B., Fabbiano G., Dong-Woo K., 1995, ApJS 97, 141
Fabbiano G., 1989, ARAA 27, 87
Fabbiano G., Miller L., Trinchieri G., Lomgair M., Elvis M., 1984, ApJ 277, 115
Fossati G., Maraschi L., Celotti A., Comastri A., Ghisellini G., 1998, MNRAS, 299, 433
Fanaroff B.L., Riley J.M., 1974, MNRAS, 167, 31p
Ghisellini G., Celotti A., Fossati G., Maraschi L., Comastri, A., 1998, MNRAS 301, 451
Giommi P., Padovani P. , 1994, MNRAS, 268, L51
Hardcastle M.J., Worrall D.M., 1999, MNRAS, 309, 969
Harris D.E., Silverman J.D., Hasinger G., Lehman I., 1998, A&AS 133, 431
Impey C., Gregorini L., 1993, AJ, 105, 853
Jaffe W., Ford H.C., Ferrarese L., Van den Bosch F., O’Connell R.,W. 1993, Nat, 364, 213
Ho L.C. 1999, ApJ 516, 672
Kollgaard R.I., Palma C., Laurent-Muehleisen S.A., Feigelson E.D. 1996, ApJ 465, 115
Komossa S., Böhringer H., 1999, A&A 344, 755
Lamer G., Brunner H., Staubert R., 1996, A&A, 311, 384
MacKenty J.W., et al., 1997, NICMOS Instrument Handbook, Version 2.0 (Baltimore STScI)
Matsumoto H., Koyama K., Awaki H., Tsuru T., Loewenstein M., Matsushita K., 1997, ApJ 482, 133
Morrison R., McCammon D., 1983, ApJ, 270, 119
Morse J.A., 1994, PASP 106, 675
Padovani P. , Giommi P., 1995, ApJ, 444, 567
Padovani P. , Giommi P., 1996, MNRAS, 279, 526
Perlman E.S. , Stocke J.T., 1993, ApJ, 406, 430
Raymond J.C., Smith B.W., 1977, ApJS 35, 419
Sakelliou I., Merrifield M.R., 1998, MNRAS 304, 434
Sambruna R.M., Maraschi L., Urry C.M., 1996, ApJ, 463, 444
Sambruna R.M., Eracleous M., Mushotzky R.F., 1999, ApJ, 526, 60
Sarazin C.L., 1986, Rev. Mod. Phys. 58, 1
Sarazin C.L., Koekemoer A.M., Baum S.A., O’Dea C.P., Owen F.N., Wise M.W., 1999, ApJ 510, 90
Schindler S., Prieto M.A., 1997, A&A 327, 37
Tananbaum H., Tucker W., Prestwich A., Remillard R., 1997, ApJ 476, 83
Trussoni E., Massaglia S., Ferrari R., Fanti R., Feretti L., Parma P., Brinkmann W., 1997, A&A 327, 27
Trussoni E., Vagnetti F., Massaglia S., Feretti L., Parma P., Morganti R., Fanti R. Padovani P., 1999a, A&A 348, 437
Trussoni E., Feretti L., Capetti A., Celotti A. Chiaberge M., 1999, Ap. Lett. Comm., in press
Urry C.M., Padovani P., 1995, PASP, 107, 803
Urry, C.M., et al., 1996, ApJ, 463, 424
Worrall D.M., Birkinshaw M., 1994, ApJ, 427, 134
Worral D.M., 1997, in Relativistic Jets in AGN’s, M. Ostrowski, M. Sikora, G. Madjeski, M. Begelman eds., Astron. Obs. of the Jagiellonian Univ., Krakow, p. 20
Zimmermann H.U., Becker W., Belloni T., Döbereiner S., Izzo C., Kahabka P., Schwentker O., 1995, EXSAS User’s GUide, ed. 5, MPE Rep. n 257
| Source | Alt. name | z | Envir. | Orient.a | |
|---|---|---|---|---|---|
| 3C 31 | NGC 383 | 0.0169 | -21.19 | Arp 331 | 35∘ |
| 3C 264 | NGC 3862 | 0.0216 | -21.15 | A 1367 | 15∘ |
| 3C 270 | NGC 4261 | 0.0074 | -21.02 | Group | 65∘ |
| 3C 465 | NGC 7720 | 0.0291 | -22.30 | A 2634 | 45∘ |
| NGC 7052 | B2 2116+26 | 0.0164 | -21.41 | Pair | 72∘ |
a Radio source orientation taken from CC99.
| Source | Instrument | Obs. Date | texp (s) | Countsa | Ref.d | ||
|---|---|---|---|---|---|---|---|
| 3C 31 | PSPC | Jul 91 | 29430 | (1)(2) | |||
| HRI | Apr 94 | 25007 | (2)(3) | ||||
| 3C 264 | PSPC | Nov 91 | 18745 | (3)(4)(5) | |||
| 3C 270 | PSPC | Dec 91 | 21863 | (6) | |||
| HRI | Jun 95 | 18477 | |||||
| 3C 465 | PSPC | Jun 91 | 9866 | ||||
| PSPC | Dec 92 | 10522 | (7) | ||||
| HRI | Jan 95 | 29063 | |||||
| HRI | Jun 95 | 33392 | (3)(8) |
a Background subtracted; the errors are at
b Merging the data of the two observations
c External radius, the inner radius
d References: (1) Trussoni et al. (1997); (2) Komossa & Böhringer (1999); (3) Hardcastle & Worrall (1999); (4) Edge & Röttering (1995); (5)Tananbaum et al. (1997); (6) Worral & Birkinshaw (1994); (7) Schindler & Prieto (1997); (8) Sakelliou & Merrifield (1997)
| Source | (d.o.f.) | |||||
| cm-2 | keV | erg s-1 | erg s-1 | |||
| 3C 31 | 5.23 | 0.75 | 2.3 | 0.30 (15) | ||
| 5.23 | 0.59 | 1.7 | 0.30 (15) | |||
| 3C 264 | 1 | 0.88 (81) | ||||
| 3C 270 | 1.63 | 0.70 (33) | ||||
| 3C 465 | 5.22 | 2.3 | 1.10 (17) | () | 0 () | |
| 5.22 | 1.7 | 1.09 (17) | () | 0 () |
| Source | Obs. Date | Filter | texp (s) | Fluxa |
|---|---|---|---|---|
| 3C 264 | May 98 | F110W | 112 | 6.7 |
| F160W | 112 | 4.3 | ||
| F205W | 112 | 2.6 | ||
| 3C 270 | Apr 98 | F110W | 192 | 0.69 |
| F160W | 192 | 1.2 | ||
| F205W | 192 | 1.6 | ||
| NGC 7052 | Aug 98 | F160W | 160 | 0.06 |
aFluxes in units of 10-17 erg s-1 cm-2 Å-1
| Name | LR | LIR | LO | LX | |||
|---|---|---|---|---|---|---|---|
| 3C 31 | 39.57 | — | 40.63 | 40.49 | 0.79 0.03 | 0.88 0.05 | 1.05 0.12 |
| 3C 264 | 39.94 | 41.77 | 41.81 | 42.01 | 0.63 0.02 | 0.73 0.02 | 0.93 0.05 |
| 3C 270 | 38.96 | 40.30 | 39.08 | 40.32 | 0.98 0.04 | 0.82 0.04 | 0.54 0.09 |
| 3C 465 | 40.34 | — | 41.21 | 40.91 | 0.83 0.02 | 0.92 | 1.11 |
| NGC 7052 | 39.07 | 39.72 | 40.04 | – | 0.81 0.06 | — | — |
a Luminosities, log (), in erg s-1 measured at 5 GHz, 1.6 m, 0.5 m and 1 keV.