Heavy X-ray Absorption in Soft X-ray Weak Active Galactic Nuclei
Abstract
Recent ROSAT studies have identified a significant population of Active Galactic Nuclei (AGN) that are notably faint in soft X-rays relative to their optical fluxes. Are these AGN intrinsically X-ray weak or are they just highly absorbed? Brandt, Laor & Wills have systematically examined the optical and UV spectral properties of a well-defined sample of these soft X-ray weak (SXW) AGN drawn from the Boroson & Green sample of all the Palomar Green AGN with . We present ASCA observations of three of these SXW AGN: PG 1011–040, PG 1535+547 (Mrk 486), and PG 2112+059. In general, our ASCA observations support the intrinsic absorption scenario for explaining soft X-ray weakness; both PG 1535+547 and PG 2112+059 show significant column densities (– cm-2) of absorbing gas. Interestingly, PG 1011–040 shows no spectral evidence for X-ray absorption. The weak X-ray emission may result from very strong absorption of a partially covered source, or this AGN may be intrinsically X-ray weak. PG 2112+059 is a Broad Absorption Line (BAL) QSO, and we find it to have the highest X-ray flux known of this class. It shows a typical power-law X-ray continuum above 3 keV; this is the first direct evidence that BAL QSOs indeed have normal X-ray continua underlying their intrinsic absorption. Finally, marked variability between the ROSAT and ASCA observations of PG 1535+547 and PG 2112+059 suggests that the soft X-ray weak designation may be transient, and multi-epoch 0.1–10.0 keV X-ray observations are required to constrain variability of the absorber and continuum.
1 Introduction
The canonical, blue X-ray loud AGN have received much attention though there are other numerically significant AGN populations (e.g., Elvis 1992). Here we study one of the ‘minority’ populations: UV-excess AGN () with weak X-ray emission. X-ray weak AGN were first noted in Einstein data (e.g., Elvis & Fabbiano 1984; Avni & Tananbaum 1986). ROSAT extended these studies and identified a significant population of type 1 AGN notably faint in the soft X-ray band (0.1–2.0 keV) relative to their optical fluxes (e.g., Laor et al. 1997). Although not as strong as the radio-loud/radio-quiet dichotomy (e.g., Kellermann et al. 1989), soft X-ray weakness is quite a strong effect. The Laor et al. (1997) soft X-ray weak (SXW) AGN lie at least an order of magnitude below the mean of the X-ray to optical flux ratio for the Palomar Green (PG) AGN sample (Schmidt & Green 1983). Possible explanations for this distinct trait are intrinsic X-ray absorption, inherently different spectral energy distributions, and variability of the X-ray and/or optical fluxes. Only significant optical variability has been disallowed by optical monitoring (e.g., Giveon et al. 1999). SXW AGN have yet to be systematically investigated with X-ray spectroscopy in order to determine the cause for their faintness.
Brandt, Laor & Wills (2000; hereafter BLW) have identified and studied the SXW AGN population in the Boroson & Green (1992; hereafter BG92) sample of all PG QSOs with . Specifically, they took SXW AGN to be those with the optical to X-ray spectral index, .111 is the slope of a power law defined by the flux densities at rest-frame 3000 Å and 2 keV. A large negative value of indicates weak X-ray emission. The mean value for radio-quiet AGN is (e.g., Laor et al. 1997) with a typical range from to (e.g., BLW). Other authors prefer , the slope of a power law between the flux densities at rest-frame 2500 Å and 2 keV. For a slope of between 2500 and 3000 Å, =1.03 (BLW). Values of from the literature have been converted to (assuming ) to facilitate direct comparisons; the original values are indicated in parentheses. In soft X-rays, these sources are 10–30 times fainter relative to their optical fluxes than most AGN. This effect is much more extreme than any possible luminosity dependence of (e.g., Green et al. 1995). For example, even the most luminous objects in Green et al. (1995) have .
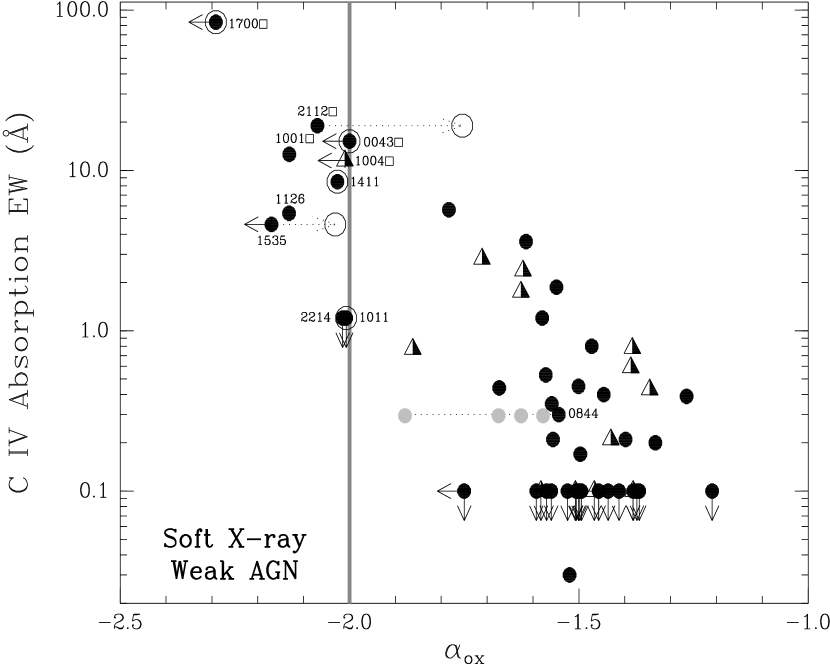
BLW demonstrated a strong correlation between and the equivalent width (EW) of intrinsic C iv absorption, suggestive of a physical link between soft X-ray weakness and UV absorption. Intrinsic X-ray absorption does depress soft X-ray flux; however, the underlying X-ray power-law continuum will recover in the harder 2–10 keV band if cm-2. The absorption hypothesis is thus testable with spectroscopic X-ray observations which makes such sources ideal targets for ASCA. ASCA offers access to penetrating X-rays and thus the ability to probe much larger column densities of absorbing gas than ROSAT. If soft X-ray weakness does indeed arise from intrinsic absorption, this is a significant step towards understanding the link between X-ray and UV absorbers. Precisely relating the X-ray and UV absorbers has proved difficult in practice although there is highly suggestive evidence for some connection (e.g., Mathur et al. 1998, BLW, and references therein).
We have undertaken a project to observe the 10 SXW AGN studied by BLW over a broad X-ray band to test the absorption interpretation for a significant number of objects. In addition to identifying absorption, X-ray spectral analysis can constrain the nature of the absorbing gas, e.g., column density, ionization state, covering factor, and velocity distribution. These quantities are important for determining the total mass outflow rates from AGN. We proposed ASCA observations of the seven SXW AGN from BLW that had not yet been observed, and here we report on the three we were able to observe before the end of the normal ASCA operations phase. The SXW AGN in this study are more extreme in soft X-ray weakness than warm absorber AGN, and they cover a large range in UV absorption up to the strength of Broad Absorption Lines (BALs). BAL QSOs lie at the extreme end of the BLW correlation of C iv absorption EW with , but those examined thus far (e.g., PG 0043+008 and PG 1700+518; Gallagher et al. 1999) have not offered enough X-ray photons for significant spectroscopic work. Therefore, X-ray analyses of BAL QSOs have always assumed an underlying X-ray power law the same as that observed in normal QSOs. We aim to investigate by direct spectroscopic observations whether the range of absorption properties represents a continuum in the X-rays. If this is the case, it would support the assumption that the extreme X-ray weakness observed in BAL QSOs is due to heavy intrinsic absorption.
Basic properties of the observed SXW AGN and the observations are listed in Table 1. Following, we present background information on each of the objects.
PG 1011–040: The small H Full Width at Half Maximum (FWHM) of 1440 km s-1 for this SXW AGN makes it a Narrow-Line Seyfert 1; its type 1 nature is supported by the presence of Fe ii emission (BG92). PG 1011–040 does not show any evidence for C iv or Ly absorption lines in analyses of available IUE spectra (BLW) and is potentially useful for comparison with the other targets for exploring whether UV and X-ray absorption are always related.
PG 1535+547 (Mrk 486, 1 Zw 1535+55): This source has strong optical Fe ii emission first noted by de Veny & Lynds (1969), and it is the X-ray weakest, detected SXW AGN in the BLW sample. It has a Narrow-Line Seyfert 1 spectrum with H FWHM=1480 km s-1 and is notable as the PG AGN with the highest optical continuum polarization (=2.5%; Berriman et al. 1990). The structure in the polarization and C iv absorption has been studied in detail by Smith et al. (1997). PG 1535+547 was the only radio-quiet AGN observed by Neugebauer & Matthews (1998) to exhibit significant near-infrared variability from 1980–1998.
PG 2112+059: This SXW AGN is one of the most luminous low-redshift () PG QSOs with , and it has the second largest C iv absorption EW, 19 Å, of all the AGN in the BLW sample. HST spectra revealed broad, shallow C iv absorption making this a BAL QSO with a balnicity index of km s-1 (Jannuzi et al. 1998; BLW; and see Figure 1), well above the lower limit that defines the class (Weymann et al. 1991). There are no spectra in the literature that cover the Mg ii region, and so it is not known whether PG 2112+059 has broad Mg ii absorption lines (see Boroson & Meyers 1992 for further discussion of Mg ii BAL QSOs) . This source was detected by ROSAT which is unusual for a BAL QSO (Kopko et al. 1994; Green & Mathur 1996). Since few BAL QSOs are even detected in X-rays, observations of this source provide a valuable test of the hypothesis that BAL QSOs have the same underlying X-ray continua as normal QSOs.
2 Observations and Data Analysis
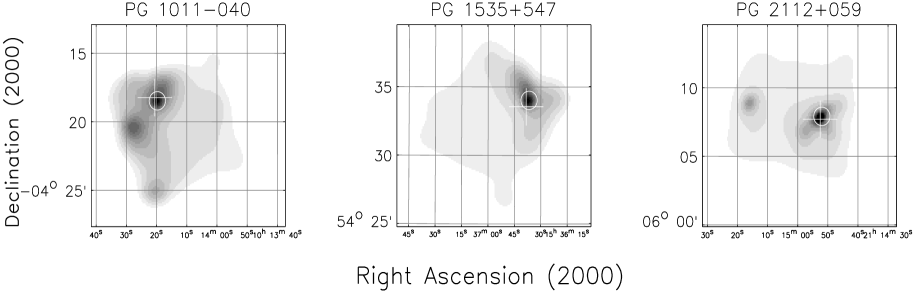
In Table 1, we list the relevant observation dates, exposure times, and instrument modes for our targets, and SIS images for each source are displayed in Figure 2. For PG 1535+547 and PG 2112+059, we were able to use serendipitous X-ray sources in archival ROSAT PSPC data to confirm the ASCA pointing. PG 1011–040 was only observed off-axis with ROSAT; thus the ASCA pointing could not be independently confirmed. However, ASCA pointings are generally quite reliable, and the detected source position was coincident with the optical position within the expected error (Gotthelf 1996). The spectra resulting from these observations were extracted with xselect, a program in the ftools package, following the general procedures described in Brandt et al. (1997b). We have used Revision 2 data (Pier 1997) and adopted the standard Revision 2 screening criteria. In Table 2, the ASCA count rates or count rate upper limits for each detector are listed. Count rates were determined by subtracting the counts in a source-free background region (normalized to the area of the source region) from those in the source region, and then dividing by the exposure time. The count rates in Table 2 and the spectra below are filtered in energy from 0.6–9.5/0.9–9.5 keV in the SIS/GIS detectors in order to eliminate poorly calibrated channels. Fluxes in the 0.5–2.0 keV and 2.0–10.0 keV bands are calculated from the best-fitting models with the SIS0 normalization (see Table 2). Unless otherwise noted, we used the rest-frame 3000 Å continuum flux densities from Neugebauer et al. (1987) and the rest-frame 2 keV flux densities from the best-fitting SIS0 model to calculate . Galactic absorption is fixed in all of the model fits, and errors stated are always for 90% confidence conservatively taking all model parameters to be of interest other than absolute normalization. We adopt km s-1 Mpc-1 and throughout.
2.1 PG 1011–040
PG 1011–040 was detected in all instruments except GIS2 at greater than 3 above the background. Low signal-to-noise ratio spectra were successfully extracted from SIS0 and GIS3 for analysis with the X-ray spectral analysis tool xspec (Arnaud 1996). There were not enough counts in the SIS1 detector to warrant spectral analysis. The background spectrum for SIS0 was extracted from a region on the CCD free from point source contamination, while that for GIS3 was extracted from blank-sky background files as detailed in Ikebe et al. (1995) in order to mitigate vignetting effects.
The spectra were first fit with a power law with fixed Galactic absorption. The fit was statistically acceptable, and the resulting photon index, (see Table 3), is consistent with those typically observed in radio-quiet type 1 AGN, –2.5 (Brandt et al. 1997a; Reeves & Turner 2000). However, PG 1011–040 has an extremely low 2–10 keV X-ray luminosity, , of erg s-1. In order to determine if X-ray absorption is the cause of the weakness of PG 1011–040 in soft X-rays, we examined the spectrum for any indications of absorption. If the intrinsic neutral column density were cm-2, then the X-ray spectrum would start to recover to the level of the incident power law by –5 keV. Such a recovery is not evident in the spectrum, and thus we do not see evidence for absorption of this magnitude (see Figure 3). Given the current data, we constrain the intrinsic column density to be cm-2, though the poor photon statistics prevent detailed modeling of the data. Another possibility is that the observed power law may not be the direct nuclear source, but only an indirect scattered component. If this is the case, then the direct component can reasonably be modeled as an additional power law with and the expected 1 keV normalization for an AGN of this optical brightness assuming an intrinsic of . A large neutral column density of cm-2 is then required to extinguish the primary continuum throughout the ASCA bandpass. If the observed X-ray emission is only scattered light, one might expect a narrow iron K emission line; given the poor quality of the data, the EW for a line in the range from 6.4–6.97 keV can only be constrained to be keV.
A nearby source away in the SIS1 and GIS detectors complicated the measurement of count rates. We searched the Palomar Optical Sky Survey for an optical counterpart to this nearby source, but none was apparent. The confusing source was quite faint in SIS1, and the lack of its detection in SIS0 can be understood as resulting from the different position of each detector with respect to the optical axis of the telescope. For GIS2, the count rate upper limit for PG 1011–040 in Table 2 is /, where is the number of counts in the source cell and is the exposure time. Counts from the nearby source mentioned above were excluded.
We have investigated potential variability between the 350 s ROSAT All-Sky Survey observation and our ASCA exposure. Although the constraints are not tight, we do not find highly significant evidence for variability.
2.2 PG 1535+547 (Mrk 486)
PG 1535+547 was clearly detected in all four detectors with enough total counts, , for spectral analysis. The source spectra were extracted using circular source cells with radii / for the SIS/GIS to maximize the signal-to-noise ratio, and the background regions were extracted as described in 2.1. The following spectral analysis was also done using different background regions on the CCDs for the SIS as well as source-free background regions on the GIS. The results were consistent and thus are not sensitive to the choice of background region.
For the first fit to the data in all four detectors, a power law with fixed Galactic absorption was used. The resulting photon index, , is abnormally flat for a typical type 1 AGN. In addition, the residuals showed a systematic excess below 1 keV indicating that the fit was poor. A of 134.7 for 119 degrees of freedom was obtained indicating that this model can be rejected with 84% confidence according to the probability distribution as defined in of Bevington & Robinson (1992; see Table 3). Next, we fit a power law with fixed Galactic absorption also allowing for the presence of intrinsic absorption. The fitted photon index was again low, , with negligible intrinsic absorption and =134.7 for 118 degrees of freedom; this model can be rejected with 86% confidence. A plot of the residuals again showed an excess below 1 keV. Forcing the photon index to lie in the typical range for radio-quiet AGN, 1.5–2.5, only worsened the fit. Finally, we fit a model adding intrinsic neutral absorption partially covering the incident power law. The choice of this model was motivated by the presence of low energy photons which would be completely absorbed by total coverage of the emission source by neutral gas. An effective partial covering situation could result from two lines-of-sight to the source of the X-ray emission. In this scenario, the first component would be direct emission absorbed by gas along the line-of-sight, and the second component would be unabsorbed emission scattered by electrons towards the observer. Since scattering results in an increased fraction of polarized flux, the high observed optical polarization of PG 1535+547 suggests that scattering is indeed occurring in the nucleus. For the partial covering model, the resulting best-fitting model parameters were an intrinsic neutral absorption column density of cm-2, a covering fraction of %, and (see Figure 4). The was 117.5 for 117 degrees of freedom, a significant improvement over all of the previous fits at the 99% confidence level according to the -test. The residuals showed no obvious trends, and the partial covering model explains the additional soft photons evident in the simple absorption models while also providing a physically reasonable photon index. Confidence contour plots for the two partial covering parameters are displayed in Figure 5. From this best-fitting model to the ASCA data, we obtain =1042.1 erg s-1 (absorption-corrected =1042.4 erg s-1). For completeness, we also tried an ionized absorber model, but the fit left clear systematic residuals. The partial-covering absorption model was preferable, with for the same number of degrees of freedom.
According to the ASCA data, the measured (see Table 2) is greater by =0.42 than that calculated in BLW from the 2678 s ROSAT PSPC observation performed on 1993 February 8. This dramatic change corresponds to a factor of increase in flux for a fixed X-ray spectral shape. However, a closer look at the PSPC data indicates that PG 1535+547 was not actually detected in the 0.5–2.0 keV band but only in the 0.1–0.5 keV band. In the 0.5–2.0 keV band, there were 5 photons in the radius source cell with 2 expected from the background. Using the method of Kraft, Burrows & Nousek (1991), the upper limit on the number of counts from the target is 8.54 at the 95% confidence level. This corresponds to an observed count rate of ct s-1. To estimate , BLW assumed a photon index of based on the H FWHM (see 3.3 of Laor et al. 1997 for discussion) and then found the normalization that gave the proper count rate for the entire 0.1–2.5 keV band. If instead the 0.5–2.0 keV count rate upper limit is used to estimate an upper limit on the 2 keV flux density, then is measured to be . The lower limit on the flux increase for a fixed spectral shape is then a factor of 2.4. Though the limited photon statistics in the ROSAT observation preclude spectral analysis, we can still compare the two observations in order to determine if the increase in is greater than expected from measurement and systematic errors. We took the best-fitting ASCA SIS0 spectral model and convolved it with the ROSAT PSPC response using xspec. From this, we predicted a PSPC count rate of ct s-1 in the 0.5–2.0 keV band (errors are for 90% confidence), clearly above the measured upper limit. Though the absolute calibrations of the two satellites have a systematic offset, measured fluxes in the 0.5–2.0 keV band are generally consistent within errors (Iwasawa et al. 1999); this cannot account for the increase in brightness. The source has varied significantly in the six years between the two observations.
2.3 PG 2112+059
In all four ASCA instruments, PG 2112+059 was clearly detected with enough counts, a total of , for spectral analysis. Source spectra were extracted as described above using circular source cells with radii / arcmin for the SIS/GIS. The GIS source cell was chosen slightly smaller than in 2.2 in order to avoid including photons from a faint source located from the target. Background spectra were also extracted as described in 2.1, and we have verified that our results below are not sensitive to the details of the background subtraction.
For the first fit to the data in all four detectors, a power law with fixed Galactic absorption was used. A of 182.8 for 151 degrees of freedom was obtained indicating that this model can be rejected with 96% confidence. The resulting photon index, , is rather flat for a typical QSO. In addition, the residuals showed a systematic deficit below 1 keV which also indicated that the fit was not good in the soft band and suggested the presence of intrinsic absorption. In order to model only the continuum, we excluded the data below 3 keV in the rest frame (2 keV in the observed frame). Above 3 keV, the absorption of incident photons by neutral or partially ionized gas should be much less than in the softer band, thus allowing the underlying power-law continuum to be observed and fit directly. These data were then fit with a power law plus Galactic absorption. This resulted in a steeper photon index of , more characteristic of radio-quiet QSOs, and =69.0 for 76 degrees of freedom. The data below 3 keV were then included, and the model extrapolated to the lowest ASCA energy bins (0.87 keV rest frame). The resulting plot, shown in Figure 6, is suggestive of the possible nature of the intrinsic absorber. The spectra appear to recover towards the power-law continuum in the lowest energy bins, hinting at either partially ionized absorbing gas or partial covering of the continuum. In contrast, a neutral, cold absorber would depress almost all flux below keV, the energy where the continuum recovers. We fit several models to try to characterize the absorbing gas. The details of each fit are listed in Table 3. Briefly, intrinsic absorption by neutral gas with column density cm-2 was preferable at the % confidence level to a straight power law with only Galactic absorption according to the -test (). In addition, adding neutral intrinsic absorption resulted in a photon index of which is consistent with for the fit to the data above 3 keV in the rest frame (see Figure 7). Fitting the data with a warm absorber or a partial covering model also yielded acceptable fits to the data; however, the fits were not statistically significant improvements over that with a neutral absorber (see Table 3). An iron K line is not detected; we can set an upper limit on the EW of a narrow line from 6.4–6.97 keV of eV.
PG 2112+059 is a luminous X-ray source with and erg s-1, and so any possible starburst X-ray contribution would negligibly influence our spectral fitting. Though absorption of one form or another is certainly required, these data do not have a high enough signal-to-noise ratio to distinguish between various absorption models. Regardless of the nature of the absorber, the photon index is consistently , completely typical for a radio-quiet QSO. We have investigated the impact of the changing SIS calibration on the results of our spectral-fitting (T. Yaqoob 1999, private communication) and find that our general conclusions are not substantively affected.
The archival ROSAT PSPC data from a 21.1 ks observation on 1991 November 15 cannot be simultaneously fit with the ASCA data without allowing the power-law normalization to drop by a factor of . If we convolve the ASCA SIS0 model with the ROSAT PSPC response, then the predicted 0.5–2.0 keV count rate for the ROSAT observation is ct s-1. This value is almost a factor of four larger than the observed PSPC count rate in the same band of ct s-1. The ROSAT data have a low signal-to-noise ratio, but spectral analysis allows for a measurement of the 2 keV flux density which is relatively insensitive to the specific model. Recalculating more robustly from spectral fitting of the data (rather than assuming a model and using the PSPC count rate as in BLW), one obtains , similar to the BLW value of . The measured from the best-fitting ASCA data is significantly higher than any consistent with the ROSAT data; of 0.32 between the two observations corresponds to an increase in the rest-frame 2 keV flux density by a factor of . The discrepancy between the relative increases in the 2 keV flux density and the observed versus predicted PSPC count rates can be reconciled if the X-ray spectral shape has varied, perhaps due to changes in the absorbing material along the line-of-sight. For example, a change in ionization state of the material along the line-of-sight could strongly affect the rest-frame 2 keV flux density but cause smaller changes to the observed frame 0.5–2.0 keV integrated flux. Clearly, PG 2112+059 has brightened substantially in the soft X-ray band in the decade since the ROSAT observation. In fact, PG 2112+059 is no longer SXW as defined by BLW.
3 Discussion and Conclusions
3.1 PG 1011–040
From our rudimentary spectral analysis, PG 1011–040 appears to have a typical power-law X-ray continuum with no evidence for absorption beyond the Galactic column density. Forcing a normal underlying AGN X-ray spectrum in addition to the observed component requires an intrinsic neutral column density of cm-2 to extinguish it to the top of the ASCA bandpass; such a large column density would be extraordinary for a type 1 AGN. Detecting a narrow iron K emission line with a large EW would provide evidence for such a situation, but we are unable to set meaningful constraints with the current data. Given that the exact relationship between UV and X-ray absorbers is still unclear, such heavy absorption can perhaps be reconciled with the lack of detected C iv absorption if the gas is dense and cold or very close to the nucleus. Dense, cold gas can effectively absorb X-rays without creating strong absorption in the high-ionization C iv line as can gas lying interior to the UV emission region. Alternatively, this may be an intriguing example of an AGN with intrinsically weak X-ray emission. However, the normal He ii 4686 emission (EW Å; BG92) suggests that the intrinsic X-ray emission cannot be extremely abnormal (Korista, Ferland & Baldwin 1997; BLW). A depressed ionizing continuum in the extreme UV (EUV) would not produce significant He ii emission, and it is difficult to reconcile a normal EUV continuum with drastically reduced X-ray emission. Regardless, PG 1011–040 merits further study in both the X-ray and UV regions of the spectrum in order to more tightly constrain the apparent lack of absorption in both bands (see Figures 8 and 9). In addition, UV emission line studies of this object are important for further investigating the intrinsically weak X-ray continuum scenario.
The ASCA data provide a measurement of consistent with that derived from the ROSAT PSPC count rate, and so this source remains firmly in the SXW category. From archival Einstein data, () was measured (Tananbaum et al. 1986), indicating that this source has been consistently weak in soft X-rays for at least two decades. IUE data from 1993 and 1995 show no evidence for UV variability.
3.2 PG 1535+547 (Mrk 486)
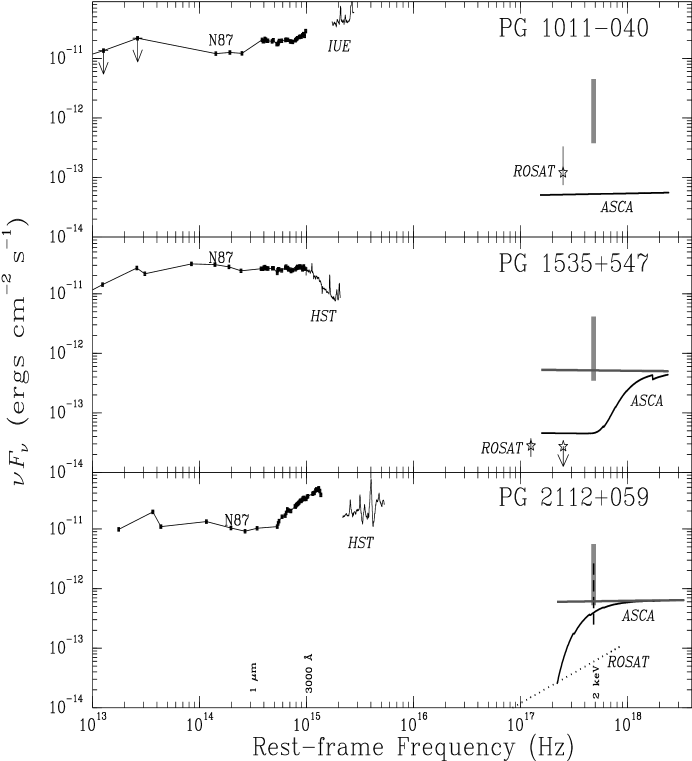
PG 1535+547 shows clear signs of intrinsic absorption by a large column density of gas ( cm-2) with only partial covering of the power-law continuum. The partial covering model is particularly interesting with regard to the optical polarization properties of this AGN since it implies possible electron scattering of X-rays around intrinsic absorbing clouds. This result is consistent with the known high polarization of the optical continuum flux (=2–8%; Smith et al. 1997) and closely resembles the X-ray results for the SXW AGN PG 1411+442 (Brinkmann et al. 1999). PG 1411+442 has a comparable internal column density, = cm-2, and covering fraction, =. From the broad-band spectral energy distribution of PG 1535+547 (see Figure 8), the reddened continuum in the optical and UV is clearly seen, as well as the recovery of the X-ray continuum to within the range expected given the 3000 Å flux density. The amount of reddening in the optical and UV, though significant, is still much less than the expected along the direct line-of-sight if the absorbing material has roughly a Galactic dust-to-gas ratio (Burstein & Heiles 1978). Though dust may be responsible for the optical polarization, it is an inefficient scattering medium for X-rays; electrons are the most likely candidates for X-ray scatterers.
The increase in X-ray brightness of PG 1535+547 in the six years between the ROSAT and ASCA observations is notable. Determining whether the continuum flux has increased or the absorption has decreased is not possible given the limited ROSAT data. During the same epoch, the near-infrared flux of PG 1535+547 in 4 bands from 1.27–3.7 m also varied significantly, increasing by mag from 1993 to 1996 and then dropping by mag between 1996 and 1998 (Neugebauer & Matthews 1999). Our analysis of archival UV data from IUE indicates that on 1982 November 17 and 1984 May 7, PG 1535+547 was 30% brighter than in earlier IUE spectra (1982 June 6 and September 26). Later HST spectra (1992 September 19) are consistent with the earliest IUE data.
3.3 PG 2112+059
With this ASCA observation, PG 2112+059 is found to have the largest X-ray flux of any BAL QSO known. For comparison, the next brightest ASCA-observed BAL QSO, PHL 5200, had broad-band count rates times lower in all detectors (Mathur et al. 1995; Gallagher et al. 1999). Our result of a typical QSO X-ray continuum with absorption is robust. Regardless of the nature of the absorbing gas, neutral, partially ionized or partially covering, the photon index is . This is the first direct spectral evidence for a typical QSO X-ray continuum in a BAL QSO and supports the assumption that they are indeed normal QSOs cloaked by absorbing gas (e.g., Green & Mathur 1996; Gallagher et al. 1999). Our best-fitting model to the ASCA data finds an intrinsic, neutral column density of cm-2. The data are not of sufficient quality to determine the ionization state of the gas; ionized gas would require a larger column density for the same amount of continuum absorption. An additional issue complicating the determination of the line-of-sight column density is the unknown velocity dispersion of the gas. Currently available models for X-ray absorption by neutral or partially ionized gas do not usually account for any velocity dispersion within the absorber. Thus they are severely limited for the study of BAL QSOs which may have velocity dispersions as large as km s-1 if the X-ray and UV absorbing gas have similar velocity structure. At these high dispersions, bound-bound X-ray absorption becomes significant and may dominate over bound-free absorption (see of Netzer 1996; D. Chelouche & H. Netzer 2000, private communication).
The measured neutral column density for PG 2112+059 is more than an order of magnitude lower than the intrinsic column densities implied for the BAL QSOs PG 0946+301 (Mathur et al. 2000) and PG 1700+518 (Gallagher et al. 1999), and it may be that this lower column density is related to the relatively shallow BAL troughs of this object (see Figure 1). Future observations of a larger sample of BAL QSOs can test if the depths in BAL troughs are correlated with the observed X-ray column density, but care must be taken to evaluate the amount of scattering which can partially ‘fill in’ BALs. The measured column density also appears to be insufficient for the ‘hitchhiking’ gas postulated by Murray et al. (1995). In their model, thick, highly ionized gas with cm-2 absorbs soft X-rays and shields the BAL wind from becoming completely stripped of electrons. The X-ray absorbing gas is stalled at the base of the flow and is distinct from the gas causing the broad UV absorption lines. Though our data suggest that this is not the case for PG 2112+059, higher spectral resolution observations are required to constrain the velocity of the X-ray absorbing gas.
From Einstein data, Tananbaum et al. (1986) measured an upper limit of () which is weaker than the current value, but consistent with the ROSAT observations. Since then, the variability of from to over the course of a decade makes further UV studies as well as higher signal-to-noise ratio X-ray observations of this source important. In particular, the demonstrated variability of PG 2112+059 in the X-rays can be compared with the UV BALs. The probable X-ray spectral variability hints at changes in absorption structure, either of the ionization parameter or the column density. BAL QSOs generally have little variability in their UV absorption line profiles (e.g., Barlow 1993). However, if the UV and X-ray absorbing gas are closely related and the increase in X-ray flux is a result of changing absorption structure, then the dramatic change in should occur in concert with significant changes in the UV absorption lines. The gravitationally lensed QSO PG 1115+080 is an example of a mini-BAL QSO which appears to show variable X-ray absorption (Chartas 2000) as well as clear changes in UV absorption (Michalitsianos, Oliversen & Nichols 1996). The archival HST FOS data of PG 2112+059 were taken in 1992, approximately one year after the 1991 ROSAT observation and seven years before this ASCA observation. PG 2112+059 is scheduled for a possible Cycle 9 HST observation as part of a UV absorption snapshot survey.
From the spectral energy distribution of PG 2112+059 (see Figure 8), it is apparent that the HST UV spectra are not continuous with the Neugebauer et al. (1987) UV photometric data points which we used to calculate in Table 2. In the years between the 1980 N87 measurements and the HST FOS observation, it is likely that the UV/optical flux has diminished. Optical variability is not unreasonable as between 1992 and 1996, part of the time between the ROSAT and ASCA observations, PG 2112+059 brightened by 0.18 mag in the band (Rabbette et al. 1998). Additional photometric data up to the present epoch show continued variability of mag in (Garcia-Rissmann et al., in preparation). Analysis of IUE and HST data from 1986 to 1995 shows no evidence for UV continuum variability. If instead of using N87 values the HST continuum data are extrapolated to rest-frame 3000 Å, the ROSAT and ASCA values for are and , respectively. Our ASCA absorption-corrected is then , within of the mean of the Laor et al. (1997) radio-quiet AGN distribution of . This is further evidence supporting the picture of BAL QSOs as AGN with typical underlying X-ray continua.
Since the strongest signatures of X-ray absorption are edges at fairly low energies ( 2 keV), the characteristics of the X-ray absorbing gas are most readily studied in low-redshift objects where rest-frame photons below keV can still be detected with available X-ray instruments. With its high X-ray luminosity, erg s-1 (absorption-corrected erg s-1) and erg s-1, PG 2112+059 is unlikely to suffer significant contamination by a nuclear starburst as the most X-ray luminous starburst galaxy known is more than 200 times fainter (Moran et al. 1999). Two other relatively X-ray bright BAL QSOs, CSO 755 () and PHL 5200 (), are at much higher redshifts, and thus PG 2112+059 offers the most promise for detailed absorption studies with the new generation of X-ray observatories. With higher spectral resolution and greater sensitivity at low energies, parameters such as the ionization state and column density of the absorber can be probed more thoroughly. Ideally, grating observations of this source have the potential to elucidate the dynamical structure of the X-ray absorbing gas.
3.4 X-ray Absorption as the Primary Cause of Soft X-ray Weakness
The number of SXW AGN in BLW with published ASCA spectral constraints is now six out of ten: PG 0043+008, PG 1011–040, PG 1411+442, PG 1535+547, PG 1700+518, and PG 2112+059. As the number of SXW AGN observed in the 2–10 keV band grows, the general identification of soft X-ray weakness with intrinsic X-ray absorption becomes more plausible. PG 1411+442 had been shown previously to have substantial X-ray absorption with a neutral column density of cm-2 (Brinkmann et al. 1999). With two of our sample, PG 1535+547 and PG 2112+059, we have also examined objects with more X-ray absorption than is typically seen in type 1 AGN but still with enough photons for direct spectroscopic analysis. The BAL QSOs PG 0043+008 and PG 1700+518 were not detected by ASCA which suggests that they suffer absorption by a column density larger than cm-2 (Gallagher et al. 1999). PG 1011–040 is the only object to show no evidence for strong UV or X-ray absorption.
With the exception of perhaps PG 1011–040, the SXW AGN which have been spectroscopically studied in the hard band show no evidence for unusual intrinsic spectral energy distributions. In addition, the occurrence of UV and X-ray absorption is now one-to-one; we have found evidence for X-ray absorption in those sources with detected UV absorption. These observations lend direct support to absorption as the primary cause for soft X-ray weakness as put forward by BLW. After correcting the observed X-ray spectra of PG 1411+442, PG 1535+547, and PG 2112+059 for intrinsic absorption, one obtains photon indices and values consistent with typical type 1 AGN. This serves to emphasize the universality of X-ray emission in QSOs, and the value of as a parameter for identifying QSOs with interesting UV and X-ray absorption properties.
The three AGN in this study and PG 1411+442 are ideal targets for higher throughput X-ray spectroscopy and additional UV observations. The most compelling issues to address remain the nature of the relationship between the X-ray and UV absorbers and the dynamics of the X-ray absorbing gas. Since the bulk of the gas in the inner regions may be most readily observable in X-rays, it is essential to measure the velocity of this gas to determine the mass-outflow rates of AGN.
3.5 X-ray and UV Variability
The variability of two SXW AGN, PG 1535+547 and PG 2112+059, suggests that other sources in the intermediate range () may also vary and perhaps even join the ranks of SXW AGN at times. One possible example of such interesting variability is PG 0844+349 which is generally not SXW, but in one out of five X-ray observations had an intermediate of (; Wang et al. 2000).
Additional 0.1–10.0 keV X-ray observations of the sources known to vary in are essential for determining whether the absorbing gas or the underlying continuum itself is changing. PG 2112+059 appears to be an example of a SXW AGN whose spectral shape has changed over time most likely as a result of changing absorption structure (see 2.3). Simultaneous or near-simultaneous UV observations are also required to elucidate the precise relationship of the UV and X-ray absorbers and calculate consistently. Currently, we have direct evidence for variability in X-ray flux which translates into horizontal motion in the BLW C iv absorption EW versus plot (see Figure 9). As of yet, we do not have corresponding multi-epoch C iv absorption EW measurements and cannot determine if the plot is as dynamic vertically. Though monitoring of UV BALs by Barlow (1993) showed little variability, the matter requires further investigation. If the variability is a result of bulk motions of absorbing clouds across the line-of-sight, then the AGN currently towards the absorbed end of the correlation may show more dramatic changes over time as their clouds continue to move.
3.6 Soft X-ray Weak AGN and the X-ray Background
All three of the SXW AGN studied above, and indeed all of the SXW AGN of BLW, were originally selected by their blue optical color, and BLW found no evidence for a systematic difference between the optical continuum slopes of SXW and non-SXW AGN. Thus, given our X-ray spectral fitting results, it appears that a non-negligible fraction of blue type 1 AGN suffer significant X-ray absorption and have hard X-ray spectra qualitatively similar to that of the X-ray background. Such objects need to be remembered when constructing AGN synthesis models for the X-ray background, and indeed some blue QSOs with hard X-ray spectra have been found in X-ray background surveys (e.g., Fiore et al. 1999; Brandt et al. 2000).
References
- Arnaud (1996) Arnaud, K. A. 1996, in ASP Conf. Ser. 101, Astronomical Data Analysis Software and Systems V, ed. G. Jacoby & J. Barnes (San Francisco: ASP), 17
- Avni & Tananbaum (1986) Avni, Y., & Tananbaum, H. 1986, ApJ, 305, 83
- Barlow (1993) Barlow, T. A. 1993, Ph.D. thesis, University of California, San Diego
- Berriman et al. (1990) Berriman, G., Schmidt, G. D., West, S. C., & Stockman, H. S. 1990, ApJS, 74, 869
- Bevington & Robinson (1992) Bevington, P. R., & Robinson, D. K. 1992, Data Reduction and Error Analysis for the Physical Sciences (2nd ed.) (Boston: WCB McGraw Hill)
- Boroson & Green (1992) Boroson, T. A., & Green, R. F. 1992, ApJS, 80, 109 (BG92)
- Boroson & Meyers (1992) Boroson, T. A., & Meyers, K. A. 1992, ApJ, 397, 442
- Brandt et al. (2000) Brandt, W. N., Laor, A., & Wills, B. J. 2000, ApJ, 528, 637 (BLW)
- Brandt et al. (1997) Brandt, W. N., Mathur, S., & Elvis, M. 1997a, MNRAS, 285, L25
- Brandt et al. (1997) Brandt, W. N., Mathur, S., Reynolds, C. S., & Elvis, M. 1997b, MNRAS, 292, 407
- Brandt et al. (2000) Brandt, W. N., et al. 2000, AJ, in press (astro-ph/0002121)
- Brinkmann et al. (1999) Brinkmann, W., Wang, T., Matsuoka, M., & Yuan, W. 1999, A&A, 345, 43
- Burstein & Heiles (1978) Burstein, D., & Heiles, C. 1978, ApJ, 225, 40
- Chartas (2000) Chartas, G. 2000, ApJ, 531, 81
- de Veny & Lynds (1969) de Veny, J. B., & Lynds, C. R. 1969, PASP, 81, 535
- Diplas & Savage (1994) Diplas, A., & Savage, B. D. 1994, ApJ, 427, 274
- Ebeling et al. (2000) Ebeling, H., White, D. A., & Rangarajan, F. V. N. 2000, MNRAS, submitted
- Elvis (1992) Elvis, M. 1992, in Frontiers of X-ray Astronomy, ed. Y. Tanaka & K. Koyama (Tokyo: Universal Academy Press), 567
- Elvis & Fabbiano (1984) Elvis, M., & Fabbiano, G. 1984, ApJ, 280, 91
- Fiore et al. (1999) Fiore, F., La Franca, F., Giommi, P., Elvis, M., Matt, G., Comastri, A., Molendi, S., & Gioia, I. 1999, MNRAS, 306, L55
- Foltz et al. (1987) Foltz, C. B., Weymann, R. J., Morris, S. L., & Turnshek, D. A. 1987, ApJ, 317, 450
- Gallagher et al. (1999) Gallagher, S. C., Brandt, W. N., Sambruna, R. M., Mathur, S., & Yamasaki, N. 1999, ApJ, 519, 549
- Giveon et al. (1999) Giveon, U., Maoz, D., Kaspi, S., Netzer, H., & Smith, P. S. 1999, MNRAS, 306, 637
- Gotthelf (1996) Gotthelf, E. V. 1996, ASCA Newsletter, 4, 31
- Green & Mathur (1996) Green, P. J., & Mathur, S. 1996, ApJ, 462, 637
- Green et al. (1995) Green, P. J., et al. 1995, ApJ, 450, 51
- Ikebe et al. (1995) Ikebe, Y., Ishisaki, Y., Kubo, H., Idesawa, E., Takahashi, T., Makishima, K., & the GIS Team. 1995, ASCA Newletter, 3, 13
- Iwasawa et al. (1999) Iwasawa, K., Fabian, A. C., & Nandra, K. 1999, MNRAS, 307, 611
- Jannuzi et al. (1998) Jannuzi, B. T., et al. 1998, ApJS, 118, 1
- Kellermann et al. (1989) Kellermann, K. I., Sramek, R., Schmidt, M., Shaffer, D. B., & Green, R. 1989, AJ, 98, 1195
- Kopko et al. (1994) Kopko, M., Turnshek, D. A., & Espey, B. R. 1994, in IAU Symp. 159: Multi-Wavelength Continuum Emission of AGN, Vol. 159, 450
- Korista et al. (1997) Korista, K., Ferland, G., & Baldwin, J. 1997, ApJ, 487, 555
- Kraft et al. (1991) Kraft, R. P., Burrows, D. N., & Nousek, J. A. 1991, ApJ, 374, 344
- Laor et al. (1997) Laor, A., Fiore, F., Elvis, M., Wilkes, B. J., & McDowell, J. C. 1997, ApJ, 477, 93
- Lockman & Savage (1995) Lockman, F. J., & Savage, B. D. 1995, ApJS, 97, 1
- Mathur et al. (1995) Mathur, S., Elvis, M., & Singh, K. P. 1995, ApJ, 455, L9
- Mathur et al. (2000) Mathur, S., et al. 2000, ApJ, 533, L79
- Mathur et al. (1998) Mathur, S., Wilkes, B., & Elvis, M. 1998, ApJ, 503, L23
- Michalitsianos et al. (1996) Michalitsianos, A. G., Oliversen, R. J., & Nichols, J. 1996, ApJ, 461, 593
- Moran et al. (1999) Moran, E. C., Lehnert, M. D., & Helfand, D. J. 1999, ApJ, 526, 649
- Murphy et al. (1996) Murphy, E. M., Lockman, F. J., Laor, A., & Elvis, M. 1996, ApJS, 105, 369
- Murray et al. (1995) Murray, N., Chiang, J., Grossman, S. A., & Voit, G. M. 1995, ApJ, 451, 498
- Netzer (1996) Netzer, H. 1996, ApJ, 473, 781
- Neugebauer et al. (1987) Neugebauer, G., Green, R. F., Matthews, K., Schmidt, M., Soifer, B. T., & Bennett, J. 1987, ApJS, 63, 615
- Neugebauer & Matthews (1999) Neugebauer, G., & Matthews, K. 1999, AJ, 118, 35
- Pier (1997) Pier, E. A. 1997, ASCA Getting Started Guide for Rev. 2 Data, V6.1 (Greenbelt, MD: NASA/GSFC)
- Predehl & Schmitt (1995) Predehl, P., & Schmitt, J. H. M. M. 1995, A&A, 293, 889
- Rabbette et al. (1998) Rabbette, M., McBreen, B., Smith, N., & Steel, S. 1998, A&AS, 129, 445
- Reeves & Turner (2000) Reeves, J., & Turner, M. 2000, MNRAS, in press (astro-ph/0003080)
- Schmidt & Green (1983) Schmidt, M., & Green, R. F. 1983, ApJ, 269, 352
- Smith et al. (1997) Smith, P. S., Schmidt, G. D., Allen, R. G., & Hines, D. C. 1997, ApJ, 488, 202
- Tananbaum et al. (1986) Tananbaum, H., Avni, Y., Green, R. F., Schmidt, M., & Zamorani, G. 1986, ApJ, 305, 57
- Wang et al. (2000) Wang, T. G., Brinkmann, W., Matsuoka, M., Wang, J. X., & Yuan, W. 2000, ApJ, in press
- Weymann et al. (1991) Weymann, R. J., Morris, S. L., Foltz, C. B., & Hewett, P. C. 1991, ApJ, 373, 23


| C iv | SIS/GIS Exp. | Observation | ||||||
|---|---|---|---|---|---|---|---|---|
| Target Name | EWa (Å) | cm | Timed (ks) | Date | ||||
| PG 1011–040 | 15.5 | 0.058 | 3.781 | 33.9/38.9 | 1999 Nov 30 | |||
| PG 1535+547 | 15.3 | 0.038 | 4.6 | 1.351 | 31.9/37.5 | 1999 Jun 27 | ||
| PG 2112+059 | 15.5 | 0.457 | 19 | 6.262 | 29.7/36.7 | 1999 Oct 30 |
| Count Ratea ( ct s-1) | Fluxb (10-13 erg cm-2 s-1) | ||||
|---|---|---|---|---|---|
| Target Name | SIS0/SIS1 | GIS2/GIS3 | 0.5–2.0 keV | 2.0–10.0 keV | |
| PG 1011–040 | / | / | |||
| PG 1535+547 | / | / | |||
| PG 2112+059 | / | / | |||
| Modela | Parameter | Values | |||
|---|---|---|---|---|---|
| PG 1011–040 | |||||
| 1. Power law | |||||
| … | … | 53.6/47 | 0.24 | ||
| PG 1535+547 | |||||
| 1. Power law | |||||
| … | … | 134.7/119 | 0.16 | ||
| 2. Power law with intrinsic partial-covering absorption | |||||
| ( cm-2) | 117.5/117 | 0.47 | |||
| Coverage Fraction | |||||
| PG 2112+059 | |||||
| 1. Power law | |||||
| … | … | 182.8/151 | 0.04 | ||
| 2. Power law, keV rest frame (2 keV observed frame) | |||||
| … | … | 69.0/76 | 0.70 | ||
| 3. Power law with intrinsic, neutral absorption | |||||
| ( cm-2) | 142.2/150 | 0.66 | |||
| 4. Power law with intrinsic partial-covering absorption | |||||
| ( cm-2) | 142.0/149 | 0.65 | |||
| Coverage Fraction | |||||
| 5. Power law with an ionized absorption edge | |||||
| Rest-frame Edge Energy (keV) | 142.7/149 | 0.63 | |||
| Maximum Optical Depth, | |||||